How to Keep Your Primavera P6 Clean?

This article addresses to all the schedulers and project professionals who import schedules into scrubbing P6 databases, remove undesired data, export the cleaned XER, and then import to a production database or share with third-parties such as contractors or sub-contractors.

If it happens to you to go through such a process, then you might want to read this article and see the better way to “clean” a XER file, prevent external data from corrupting your database thus maintain security and keep schedule integrity.

You can achieve this with a simple tool called ScheduleCleaner.

Now, I want to explain how the tool works and how you can benefit from it.

How to get started with ScheduleCleaner?

ScheduleCleaner is a desktop application for Windows operating system. It’s not connected to a database, and does not require internet connection to use it.

The “cleaning” process of an XER file can be achieved in 5 steps as explained below.

  1. Launch the software;
  2. Add an XER File;
  3. Select the output folder;
  4. Click on the categories of data you want to remove;
  5. Click “Clean” button.

As you can see, there is no manual work, no editing of a XER file in Notepad, and no scrubbing databases.
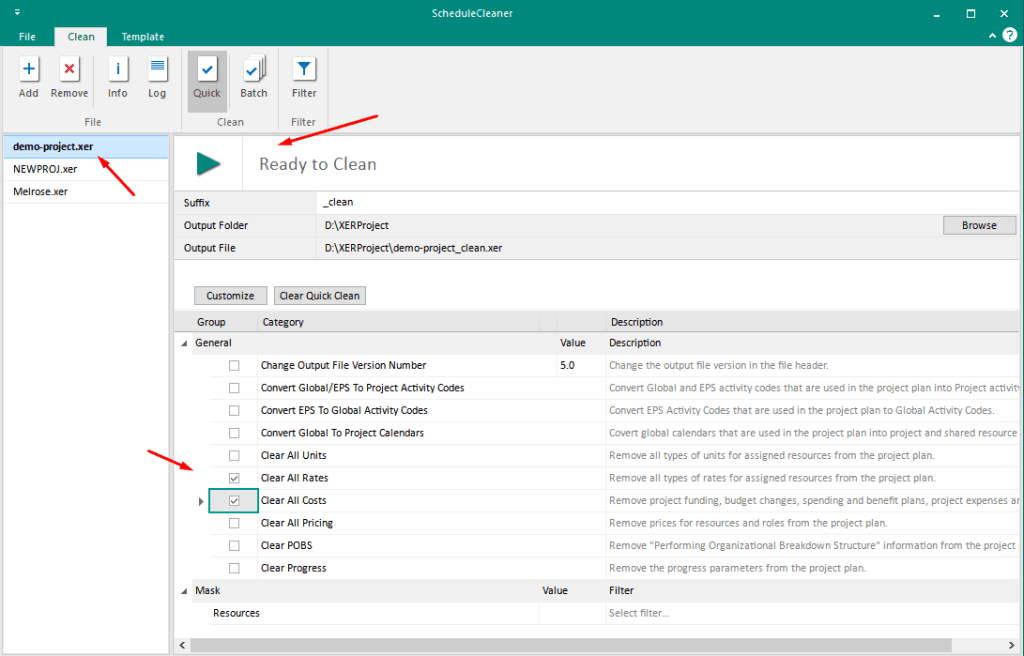
Steps to "clean" XER file with ScheduleCleaner

The software is intuitive, easy-to-use, and works offline as a standalone desktop application.

What’s more important, the software does not modify the original project plan. Instead it creates a copy and modifications are saved in the new file. The original project plan remain untouched.
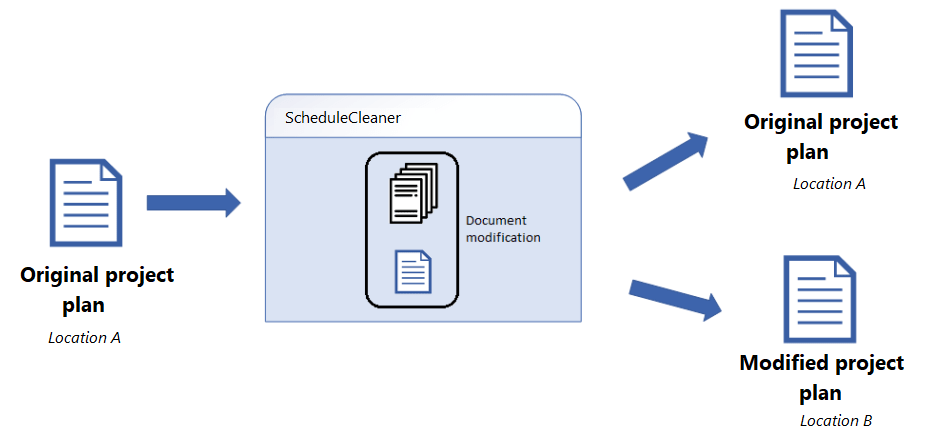
Now, let’s see what you can accomplish with this tool in more specifics.

Removing POBS

If it takes a lot of time to import XER file intro Primavera P6 database, POBS data might be the reason for that.

Overall, the POBS defect affect the performance of the application and users lose valuable during the import operation. According Oracle, the POBS data is not used yet:

“We do not utilize the POBS table yet we export/import the data from this table when completing XER Export/Import. The XER export/import should be written to exclude this data with XER export/import operations of P6 Professional.”

The removal of POBS data can be done manually, but the process is prone to errors and can be time consuming.

The impact of all these errors when managing global data in an enterprise, will ultimately result in a polluted database and unconscious mistakes on a project level.

So using a tool for removing POBS data is desirable.

You can see a significant difference of the file size before and after cleaning POBS which greatly affects the time needed to import XER file into a Primavera P6 database.

Imagine the time that can be saved for larger XER files.

Remove Units, Rates, Cost, Pricing, Progress

As the purpose of exporting data files in XER format is to transmit project data to another database, in many cases data should be kept private. For example, a general contractor wants to send the project to a sub-contractors, but without the cost of resources.

Another examples is related with the GDPR regulation. Namely project schedulers and managers share files that contain sensitive information such as resource names that can disrupt the guidelines of the GDPR.

To be GDPR compliant, companies need to hide/anonymize confidential information, and ScheduleCleaner is the perfect tool to easily and securely protect sensitive information.

Just by clicking checkboxes, users who want to share the XER schedule can pick certain categories of data that want to be removed from the schedule before sending to third-parties or upload to a Primavera P6 database.
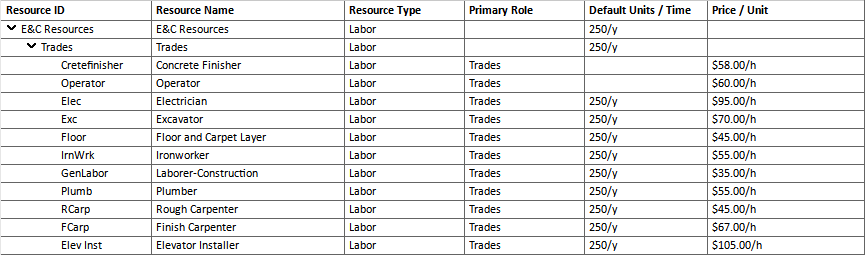
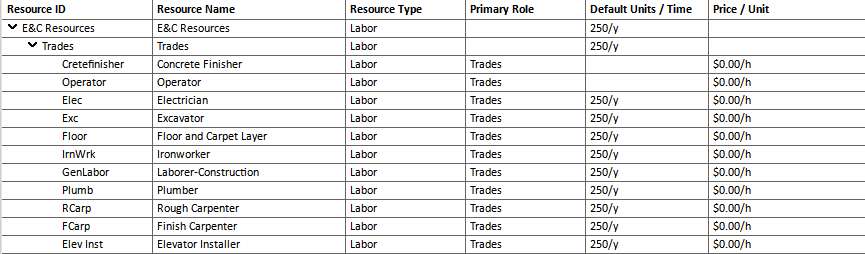
Before “cleaning” prices
After “cleaning” prices

Mask Project Data

Similar as removing certain categories of data, you can also mask project data.

The only difference is that with masking, you can add custom codes, labels or text for the specific categories.
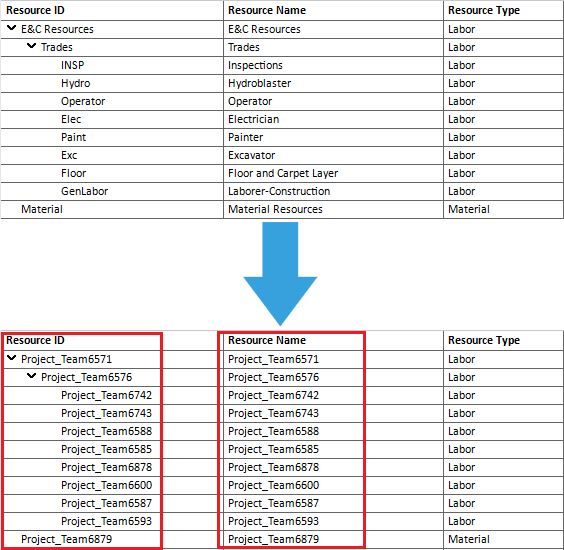
Add Prefix/Suffix

Inserting prefix or suffix to different categories in the project plan, can give additional information to the person who reads the information and acts according them.

To add Prefix/Suffix, you need to select the template that will contain Prefix/Suffix, select the appropriate category, and add the terms that will be words’ prefix or suffix.

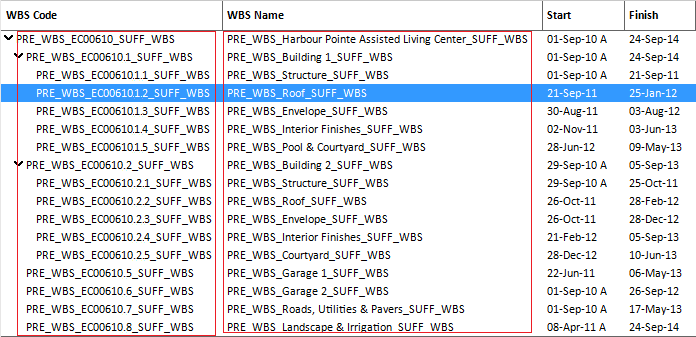
Then, you go to “Clean” ribbon and click on the “Batch” button. The end result when adding prefix/suffix are given in the image below.
Converting Data

The software features an option to convert Global and EPS activity codes to Project Activity codes and EPS to Global Activity Codes. The activity codes are important to schedulers and planning engineers when creating different types of work performance reports.

So here are the type of categories that can be converted with ScheduleCleaner:

  • Convert Global/EPS to Project Activity Codes.
  • Convert EPS to Global Activity Codes

Moreover, you can convert Global calendars that are used in the project plan into project and shared resource calendar. In this way, you will avoid errors when importing the XER file into P6 database.

Save time with process automation

Who doesn’t want automation? Automation saves time and gives a sense of comfort and security.

Here, it’s not actually a full automation because you still need to click on a button in order to perform an action or combination of actions. But this is quite useful when you have a set of actions that need to done on a daily basis such as sending a daily progress report to top management or uploading recent progress into a database.

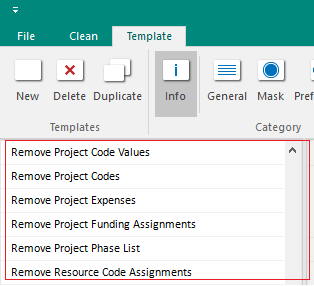
Automation is ScheduleCleaner is viable through creating Templates, save them and apply to imported XER files.
Batch Clean

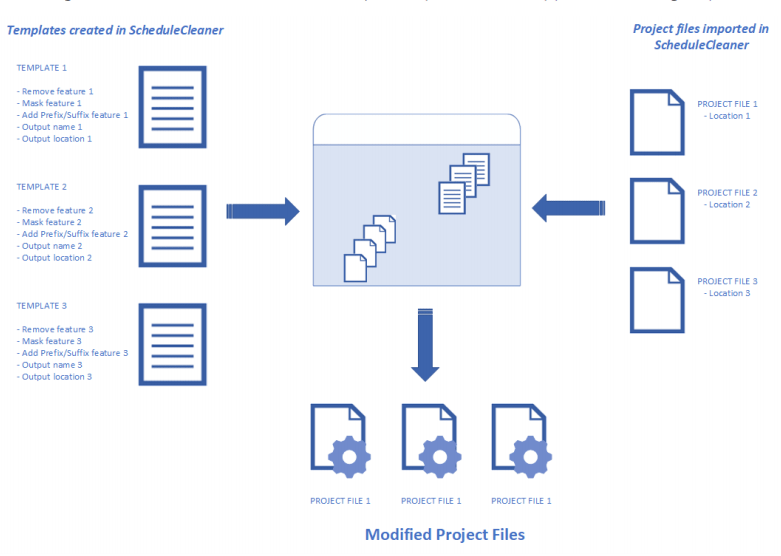
“Batch Clean” is a feature that works with templates. User must create at least one template and assign it to a file in order to use the batch file cleaning.

“Quick Clean” on the other side is more suitable when user wants to modify very small number of project files, while “Batch Clean” is useful when large number of data files, usually located in different folders, need to be modified.
Final Words

ScheduleCleaner enables you to quickly remove or anonymize confidential data in XER data files exported from Primavera P6, while keeping the schedule integrity.

It replaces the many work when “cleaning” XER file prior to sharing the file or import to a production database.

As the manual process of removing or anonymizing project data is time-consuming and unreliable, performing Batch Clean in combination with Templates can speed up the process.

Organizations can significantly improve their productivity, communication and security by integrating ScheduleCleaner in their working environment.
How to Export data from PowerQuery to BigQuery

Today was playing with a report in PowerBI and I got this idea of exporting data to BigQuery from PowerQuery, let me tell you something, it is very easy and it works rather well, PowerQuery is an amazing technology ( and it is free).

in PowerBI,you can export from R or Python visuals but there are a limitation of 150K rows, but if you use PowerQuery, there is no limitation ( I tried with a table of 23 Millions records and it works)

here is the code using Python, but you can use R

import pandas as pd
import os
from google.cloud import bigquery
dataset['SETTLEMENTDATE']=pd.to_datetime(dataset['SETTLEMENTDATE'])
dataset['INITIALMW']=pd.to_numeric(dataset['INITIALMW'])
os.environ["GOOGLE_APPLICATION_CREDENTIALS"] = "C:/BigQuery/test-990c2f64d86d.json"
client = bigquery.Client()
dataset_ref = client.dataset('work')
table_ref = dataset_ref.table('test')
job_config = bigquery.LoadJobConfig()
job_config.write_disposition = bigquery.WriteDisposition.WRITE_TRUNCATE
job_config.schema = [
bigquery.SchemaField("SETTLEMENTDATE", "TIMESTAMP"),
bigquery.SchemaField("DUID", "STRING"),
bigquery.SchemaField("INITIALMW", "FLOAT"),
bigquery.SchemaField("UNIT", "STRING")]
job = client.load_table_from_dataframe(dataset, table_ref, job_config=job_config)
job.result() # Waits for table load to complete.

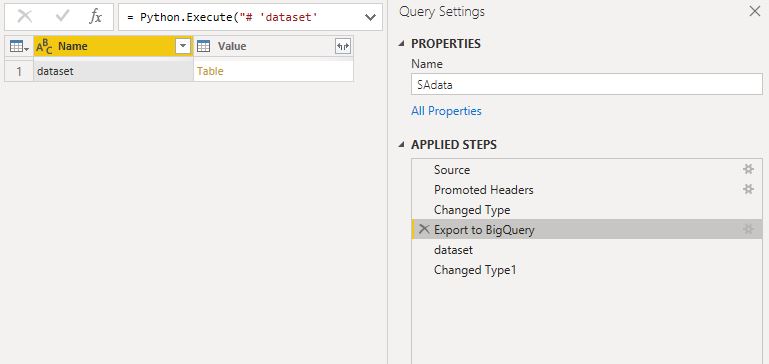
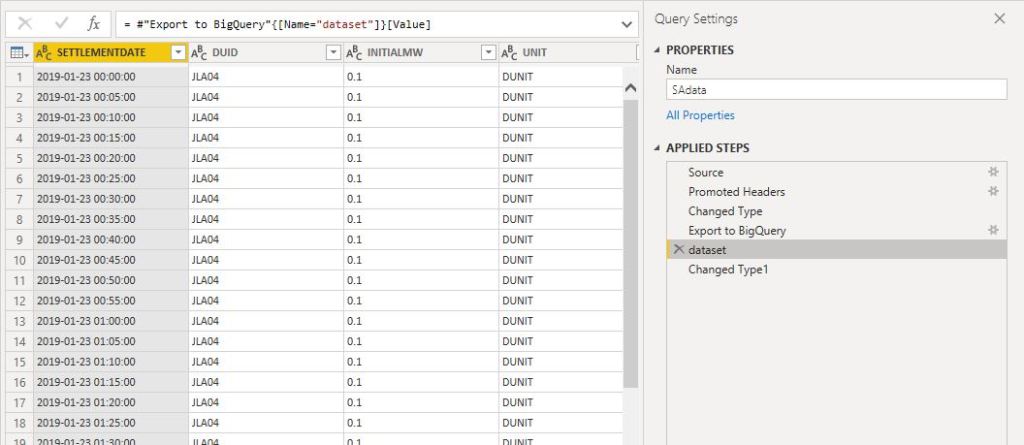
interesting after the step in Python we get a table, simply expand it

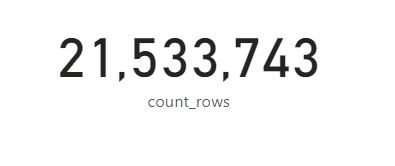
here is the total rows of the table in PowerBI

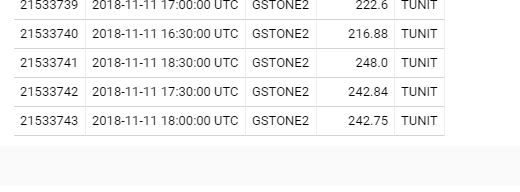
the results in BigQuery

ok, PowerQuery flow can execute many times, it is a black magic knowledge that’s only a handful of people knows, but in this cases, it does not matter, the BigQuery job truncate the tables every time, so there is no risk of data duplication.

probably you may ask why do that if there are a lot of data preparation tools that natively support BigQuery, based on my own experience, most of my data sources are Excel files and PowerQuery is just very powerful and versatile specially if you deal with “dirty” format.

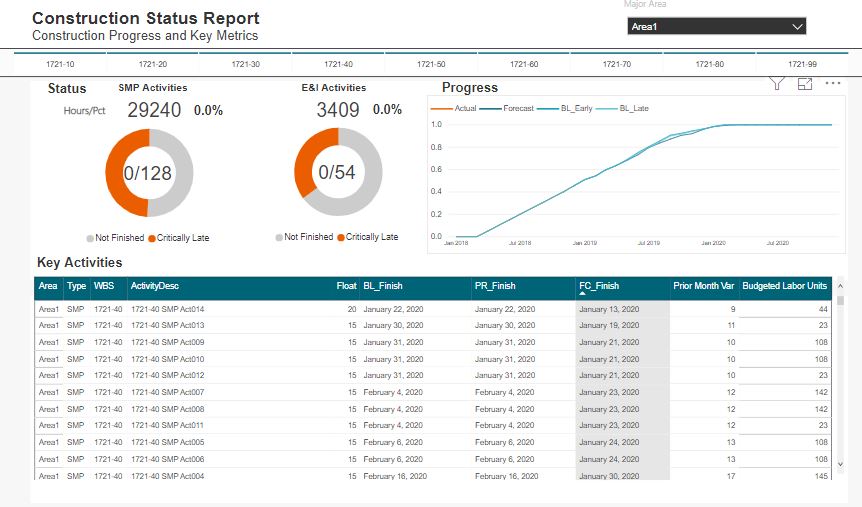
Construction Progress Report – PowerBI – by Darrin Kinney

A quick and easy construction progress and schedule dashboard.

I have previously outlined an approach that can be used for Engineering Progress.

This post is an extension to that which instead of looking at engineering model development, instead looks at construction development. I don’t want to delve too much into the details about exactly how this was built (again see the post above).

Some big differences is that I have used a resource assignment view. in addition to the date metrics This allows for resources histogram and progress curves to be quickly sorted down to an activity level. This approach also follows a prior post Resource Analysis Dashboard .

Construction02

The data

Construction01

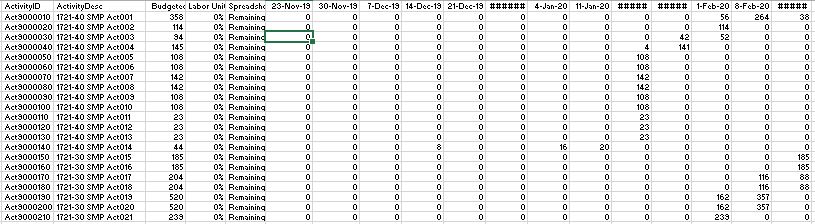
The underlying data is very similar to our engineering progress example. We can use a flat file export direct from P6 with a standard set of columns. As I have mentioned before, you can achieve this in a SQL query as part of a larger data model, although with everything, a delicate balance is needed (balancing database formalism and easy excel solution)

We will also have the resource assignment data

Construction06data.JPG

The WBS Slicer and Area Selection

Construction03_wbs

This design element doesn’t work for project with too many WBS elements. For this example, each major area only has about 10 WBS elements, therefore I could pull this off with no drama. I really prefer this selection as opposed to drop downs where it is often difficult to quickly make  selection.

The Pie and Metrics

Construction04pies

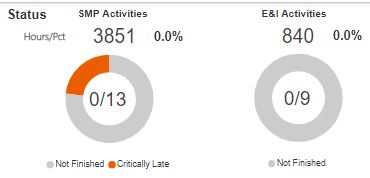
Here we follow much of the look and feel I used with the engineering progress; however instead of just using activity count metrics, I have also inserted hour and percent complete metrics. There is nothing fancy about these.

The Data Table

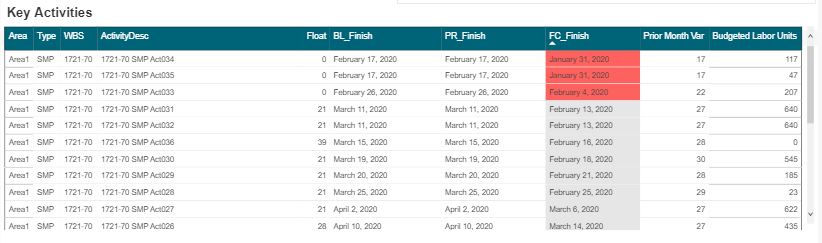
Construction05table.JPG

I’ll sound like a broken record again, when you have a good design with one aspect of a project, you can likely take that and run with it for many other areas. In a following post I will detail this systems engineering aspect to nearly everything we touch.

Obviously the key inclusion into the table is the budget units and %’s. I still prefer these tables views vs the GANTT views. Having clear visibility into the last month dates, the prior month dates,  and variances is the purpose of this view.

The Future

Again, the extension of this are endless. At this stage, we are starting to see how pre filtered views provide more focused dashboard as compared to a one size fits all. Sitting in an EPCM world, most of the detailed activities and schedules are managed by our contractors. Thus, this construction view is more suited to using an export from a contractor Level 4 schedule.

At some point, we will need to begin to discuss an overarching design where a user can navigate to our various dashboard in a logic way.

Happy data wrangling!

Custom SQL in Google Data Studio

Update August 2020 : SQL Parameter are better supported now, please go tho this updated blog

in the last 12 months, Google Data Studio has added many new interesting new features, specially the integration with BigQuery BI engine, and custom SQL Queries.

Obviously, I am a huge PowerBI fan, and I think it is the best thing that happen to analytics since Excel, but if you want to share a secure report without requiring a license for every user, Data Studio is becoming a valid option.

I have already blogged about building a near real time dashboard using Bigquery and Data Studio , but in this quick blog, I will try to show case that using SQL one can create a more complex business logic reports.

I am using a typical dataset we have in our industry, a lot of facts tables, with different granularity, the facts tables don’t all update at the same time, planned values changes only when there is a program revision, actual changes every day.

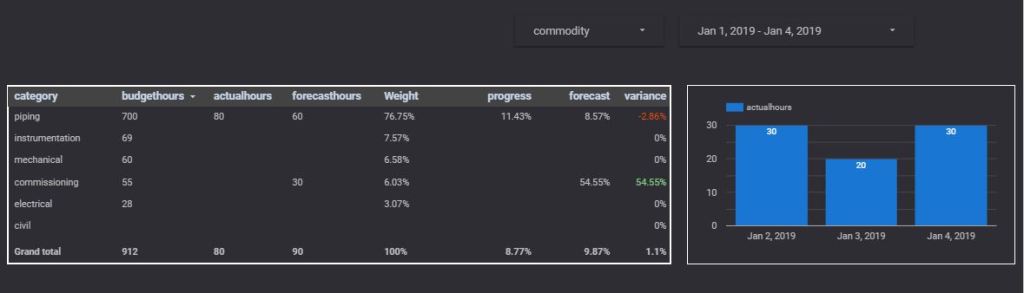
Instead of writing the steps here, please view the report that include the how to and the results.

The approach is pretty simple, all modern BI software works more or less the same way( at least PowerBI & Qlik, Tableau is coming soon), you load data to different tables then you model the data by creating relationships between the tables, then you create measures, when you click on a filter for example, or when you add dimension to a chart, the software generate a SQL query to the data source based on the existing relationship defined in the data model, it is really amazing , even without knowing any SQL coding you can do very complicated analysis.

Data Studio is no different to other tools, the Data Modeling is called Blending, it link all the tables together using left join, which is a big limitation as if some values exist in one table and not in others, you will miss data.

The idea is let’s bypass the modeling layer and write some SQL code, and to make it dynamic let’s use parameters, it is not an ideal solution for an average Business users ( we don’t particularly like code) but it is a workaround, till Data Studio improve it’s offering.