This blog is a POC of something that I always wanted to have in a BI tool, and I tried Tableau, PowerBI and Data Studio, without success ( not interested in adding an invisible grid as a hack), The idea is extremely simple yet very powerful, retrieve data when you click on a map, you may think it should simple, it seems BI tool are good at retrieving data based on filter, but it is very hard to push a parameter from a map back to a source data.
Traditionally, if you want to have this kind of interactivity, you need to write code, to be honest the idea of writing javascript and learning how to deploy a web server was not very interesting for me, but luckily we have a new Option in Streamlit
Streamlit is a code first, web app platform using only Python, web page are generated behind the scene, and there are a lot of component where you need to write a minimum of code, and deployment is absolutely trivial using Streamlit Cloud, and because it is open source, you can deploy using alternative approach like Cloud Run, or Azure
I came across this component Streamlit-Folium recently, and it is magnificent work, when you click on a map, it does provide variable back on the last location clicked zoom, bounds etc, all for free, no code required !!!!
All I have done is copied the code from the source and built a SQL Query that take the last clicked item filter all the “cafe” in a radius of 500 m, the SQL Code is copied from this previous Blog
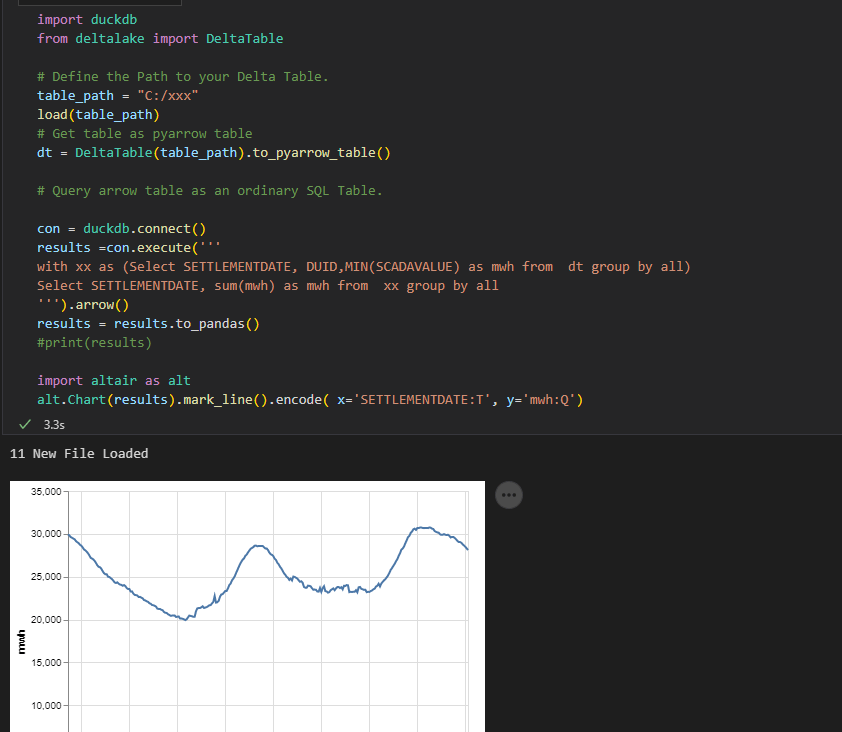
The Source Data is nearly half a Million, as you can imagine plotting a massive dataset just to see a small portion is a waste of computer resources.
here is the final results
Here an example of a SQL Query generated.

State management
I added the code here, again it was too easy to write as I nearly copied everything from the component sample code, the tricky part was how to update the value of a variable which was already declared, Streamlit has a brilliant solution using State Management, the solution is very simple
Assign a default value when the Streamlit run for the first time
if 'key' not in st.session_state:
    st.session_state.key = '( 153.024198,-27.467276)'
    st.session_state.key1 = [-27.467276, 153.024198]
    st.session_state.key2 = 16
point_clicked = st.session_state.key
location_ini  = st.session_state.key1
zoom_Start    = st.session_state.key2
Update the values when a user click on the map, the next run in the same session will use those new values
 st.session_state.key = point_clicked
       st.session_state.key1 = location_ini
       st.session_state.key2 = map_data['zoom']
Currently I don’t know how to stop Streamlit from redrawing the map, as I am only interested in updating the markers.
Database
it works with Any Database as long as it has a minimum support for GIS functions, Currently I used bigQuery BI Engine as I am familiar with it and to speak freely :), it is very cheap for this kind of workload, small Data and potentially a lot of concurrency 🙂
I tried PowerBI Datamart but it seems Python access is blocked , DuckDB don’t support GIS functions yet, I am sure you can reproduce the results using only SQL, but I did not bother.
ST_DWithin(ST_GeogPoint(lng,lat),params.center,params.maxdist_m)
Take Away
I think there is a third way between no code and only Code, Streamlit managed to create a new category, maybe simple code 🙂 having said that BI Vendor should up their games, Location Parameter should not be that hard to implement.