First Look at Tableau Hyper

TL;DR

Tableau Hyper manage to finish TPCH-SF110 using the free colab notebook, second is DuckDB using TPCH-SF20

Introduction

Saw a linkedin post where someone used my previous test for TPCH-SF10 and added Tableau Hyper Engine to the mix, the number were too good, that’s something that make me suspicious, I do like average results, extremes may just means a glitch or just a random good run, I had to see it for myself, and what a wonderful discovery, yes Hyper is extremely fast.

What is Hyper

Hyper is a DB originally developed in a german university and bought by Tableau in 2016 to replace their calculation engine, it is a full feature relational Database that support SQL, and not a specialized DB like PowerBI Vertipaq or Qlik Engine.

To be honest, I knew about Hyper before, The API was released in 2020 but I was very annoyed by a weird functionality where you need to double quote tables name and columns name, I was not too excited by the idea of apply this to a 900 LOC of SQL, luckily Romain was very kind and shared the modified SQ.

Edit : turn out double quote is not needed, probably the documentation was confusing, or I got the wrong impression.

To be clear Hyper Engine Package for Python is totally standalone and does not require Tableau, just PIP install tableauhyperapi , it is free to use but with proprietary license.

The Free Colab Test

I like using the free colab notebook to test Execution Engine (DuckDB,Data fusion, Polars etc) how an Engine behave in a constrained environment will give you a lot of useful intuition, and if it does not work well with limited resources, you will end up paying more in hardware cost because of software inefficiency, Design decisions matter.

TPCH-SF10

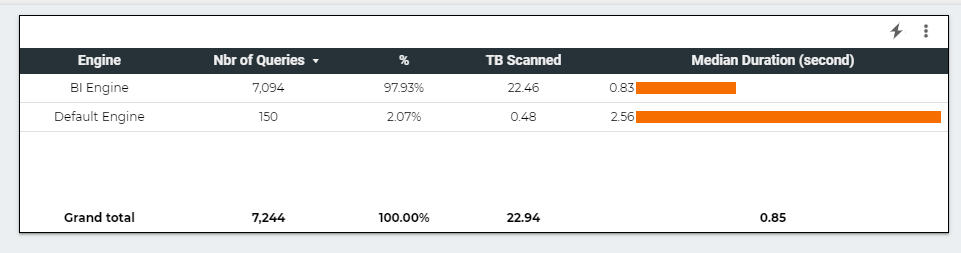
I started with the easy test, SF10, that’s 60 Million rows, Hyper performed nealy 2X faster than DuckDB, you can explained that Hyper had more time to mature compared to DuckDB, which is I think is only 3 years Old.

Notebook Attached

TPCH-SF30

It may sounds weird, but I really wanted to see an Engine finish the SF30 (180 Million rows)using the free colab notebook, it became like a personal obsession, DuckDB and Data fusion could not finish it as they got Out of memory error, and Hyper just run, it was not even trying hard.

Notebook Attached

TPCH-SF110

For no rational reason, I thought, let’s push the maximum and see what happen, the main table is 660 Million rows, in a free colab, and yes it was very slow, but did not crash and completed the test, that’s awesome !!

Notebook Attached

In-Memory vs SSD Disk

First let’s have a look at the file size, I had to delete the Parquet files to after loading just to save on the disk space.

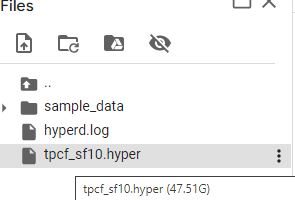
That’s 47 GB, the Free Colab VM has only 13 GB of RAM, an Engine like PowerBI Vertipaq would not work, as it needs first to load the whole file into RAM, before running any Queries, Hyper works differently, it stream the data straight from the disk, and will just read what’s required by the Query using only the column needs and the rows needed, basically it is extremely efficient at prunning data from the disk.

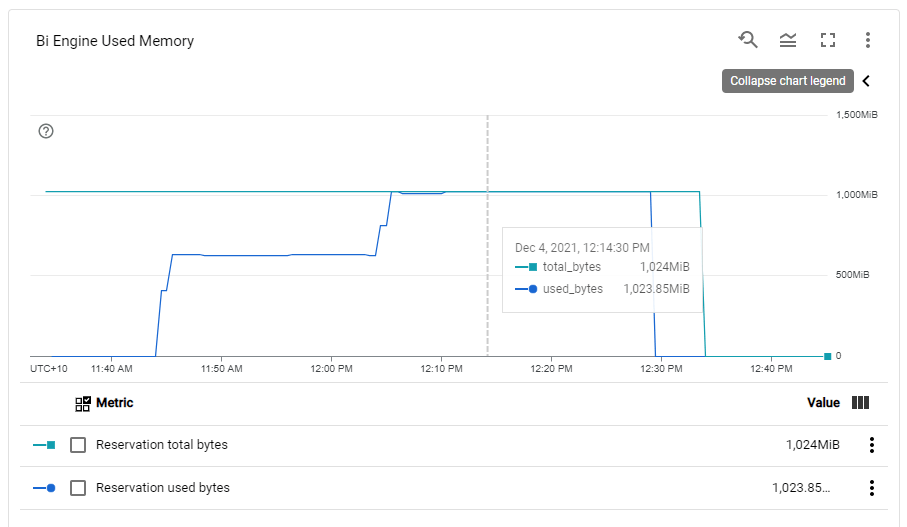
Now let’s see the second graph

I was watching the RAM usage and it is absolutely beautiful, most of the time it is less than 2 GB, in some Queries you can see the memory usage increase then Hyper decide to spill to disk, I was very worried about Query 21 ( The DB killer) and Hyper just smash it, like it is nothing, it was so efficient, you can nearly feel the engine, everything make sense, it was a joyful moment.

Some Observation

This is just my personal opinion having played with a couple of SQL Engine.

  • You don’t need a specialist DB to handle Analytical Workload, a well designed columnar DB like Hyper and others is the perfect example.
  • I love DuckDB, but there is still a lot of work to do, which is a good news, as we can still squeeze more juice from our laptops.
  • I always believed PowerBI vertipaq to be the golden standard of analytical DB, I am not sure anymore, loading everything to RAM regardless of the Queries received seems a bit archaic these days, streaming from disk with only what’s required seems a better use of the hardware, and it scale better.
  • I believe having a fast non trivial logical semantic layer that just generate SQL Queries to a DB maybe the right architecture for this era.

Tableau vs PowerBI behavior in Direct Query Mode , Result Cache

I was intrigued why Tableau and PowerBI have a different behavior when operating in a Direct Query Mode ( Tableau call it Live Mode), I always assumed it is just a driver difference, but it seems it is a little bit more complicated than That.

It is a long weekend, and Tableau released the next version as a beta (which is free), so it is a perfect opportunity to do some testing, Hopefully it will be a series, but let’s start with the fundamental difference, Query Results Cache

Again, this is not about import mode, also known as extract in Tableau, which generally speaking works the same way (PowerBI can have mixed mode, which is not supported in Tableau as far as I know)

The Data Model

The Model is very simple Star Schema, 1 Fact ( 5 years of electricity Data) and two dimensions, Calendar Table and Power Generation Plan attribute

I built this simple report, Total Mwh by substation

Tableau generate an Inner Join, same behavior as PowerBI

SELECT `DUID_DIM`.`StationName` AS `StationName__DUID_DIM_`,
  SUM(`UNITARCHIVE`.`Mwh`) AS `sum_Mwh_ok`
FROM `test-187010.ReportingDataset`.`UNITARCHIVE` `UNITARCHIVE`
  INNER JOIN `test-187010.ReportingDataset`.`DUID_DIM` `DUID_DIM` ON (`UNITARCHIVE`.`DUID` = `DUID_DIM`.`DUID`)
GROUP BY 1

Filtering Data

  • Tableau

I noticed filtering data is basically instantaneous, it is hard to believe it is using Direct Query Mode, you can see it here.

Tableau cached the results of the first Query, when you filter a substation, the data is already there, it does not need to send another SQL Query

  • PowerBI

Built the same report in PowerBI, every selection will fire a new SQL Query, yes it is still fast ( under a 2 second), but it is not instantaneous.

Here is an example in BigQuery Console

Take away

That was a simple example, but imagine 100 of users with a lot of Visuals, I suspect it will create a massive Workload on the source system, I think Tableau behavior, as a lot of other BI tools (Superset, Looker etc) make a lot of sense, and maybe it will be useful too for PowerBI.

BigQuery BI Engine behavior under Heavy Load

Note : if you are using flat price, nothing to see here 🙂

TL; DR : This blog is about a particular use case, assume a customer is using on demand pricing for BigQuery ( 5 $/ TB scanned) and bought some BI Engine reservation (1 $/1 GB compressed/Day), Currently under heavy load, BI Engine fallback to BigQuery, I think it is a problematic behavior and the customer should have the option.

  • Add the Queries to a Queue, slower but an order of magnitude cheaper
  • At least have an option to define the behavior.

The Use Case

Let’s say you have a relatively small table and you expect around 20 concurrent users Querying it, using a Live connection from Tableau or Data Studio.

First let’s create 1 GB reservation. ( 36.44 $/Month)

Simulate Query Load

In a previous blog, I got complains that my benchmark is not reproducible, this time, I am using a different Approach, although it is the same base Table ( 74 Million records with new data every 5 minutes) , I am using a SQL Script that run 100 time, every time it generate 5 sequential Queries, and to avoid any cache the date filter is random, something like this

SELECT
    StationName,
    DAY as date,
    sum( Mwh ) AS Mwh
  FROM
    `test-187010.ReportingDataset.Nem_View`
  where DAY >= date_add(DATE "2016-12-25",INTERVAL cast(floor(rand()*100)+1 as INT64) DAY)
  GROUP BY
    1,
    2
  ORDER BY
    date ASC 
    Limit 1000

The data is public you can test it yourself, notice it is saved in Tokyo Region, BI Engine should be in the same Region.

The test Load is simple, run the first script and then slowly increasing the number of script running in parallel, the idea is to simulate an increase in concurrency

BI Engine consume more memory when the load increase, Very Nice 🙂

This chart show the number of Queries per second , The Red Line is GB Billed, The red Line is something that worry me a lot.

The whole value proposition of BI engine is the cost, yes it is fast and all but as far as I am concerned, it make Interactive Live BI workload very cost effective, on demanding Pricing is useful for ETL workload, not serving Queries.

Note : you can’t use BI Engine for transformation, saving Query results to a permanent table is not supported.

Here is The Workload Breakdown.

let’s admit the obvious here, BI Engine scanned 22 TB of data in less than an Hour for the cost of 5 cents, it handled the load gracefully, till we start getting 17 concurrent Queries ( your mileage will vary based on the query complexity, volume of data etc etc )

but when BI Engine got overloaded with Queries, it fall back to BigQuery on demanding pricing which in no time consumed the daily Quota ( 500 GB) for a cost of 2.5 $. ( always set up a quota per day)

The Math is very simple, 22 TB for 5 cents versus 0.5 TB for 2.5 $

What‘s the solution

I really would like that BigQuery behavior change, if BI engine is overload, just added the Queries to a Queue to slow down things, or at least make this behavior optional, let the customer decide, if we need more concurrency we can by more memory, but don’t make the decision on our behalf.

PowerBI Vertipaq, which is in the same tech category, handle it differently, if you reach a limit, the Engine will simply throttle the Queries, I think BI Engine should behave the same 🙂

Takeway

For the Previous workload, and to support high level concurrency, and keep a Low cost, the Reserved memory Should be 2 GB, The Good news, the Product Team is working on Auto Scaling, No ETA though.

A vote on this feature request will be appreciated.

Calculate route distance, Tableau vs PowerBI

My previous  blog turn out to be very popular but unfortunately it is still not good enough, the Visual Interaction was just a hack by combining two Maps together with a big compromise the Zoom does not work and that’s very annoying ( Icon map is amazing, but still has to operate inside PowerBI framework)

The Second issue PowerBI is very chatty and insteading of sending 1 SQL Query by selection, it sends two SQL Queries, so selecting two points start and finish will generate 4 SQL Queries, usually I don’t care much, but in this case, it is relatively heavy calculation, and 1 extra Query can change the experience from this is a nice demo to I can do that at Work.

This behavior is hard to fix because it is basically how PowerBI was designed in the first place, the assumption was; you create a visual and the values change based on external filter selection or cross filtering from other visual, but there are a class of User interaction where the visual itself is the filter , a typical scenario is updating a visual title based on rows selected.

Instead of theoretical talks let’s rebuild the same visual in Tableau using parameter actions

Define a Parameter

Define SQL Query

WITH
      initial_parameter AS (
      SELECT
        *
      FROM
        UNNEST(split(<Parameters.TagsList> , ', ')) AS element ),
      mynetwork AS (
      SELECT
        ARRAY_AGG(geometry) roads   FROM   `test-187010.gis_free.brisbane_Road_Network_cluster` ),
      calculation AS(
      SELECT
        `libjs4us.routing.geojson_path_finder`(roads, st_geogfromtext(a.element), st_geogfromtext(b.element)) AS tt
      FROM
        mynetwork,    initial_parameter a,    initial_parameter b
      WHERE
        a.element>b.element
      LIMIT
        100),
        result as (
    SELECT
       1 as dummy,tt.weight    AS len,tt.path AS GEO
    FROM  calculation),
    points_extract as (
    SELECT ST_PointN(geo, idx) mypoint,len, dummy,idx
  FROM result,
  unnest(GENERATE_ARRAY(1,ST_NUMPOINTS(geo))) idx  )
  select len,  st_y(mypoint) as lat, st_x(mypoint) as lng, cast (idx as string) idx ,1 as type from points_extract
  union all
  select null as len,st_y(center_location) as lat, st_x(center_location) as lng, st_astext(center_location) as idx, 2 as type  from test-187010.gis_free.Brisbane_Bus_Stop

Define Parameter Action

in Tableau you can define exactly what happen when you select point either it will filter or update a parameter in this case we want Tableau to add the value selected to the previous selection , as for calculating distance you need Start and finish point, PowerBI by default will do that using icon map, so far so good both Product have the same behavior

Auto Update Behavior

Unlike PowerBI, Tableau auto update the Map if the data change, and because I am using only 1 visual, the zoom works and the experience is more pleasant, Tableau send only 1 SQL Query by selection.

See here another example, when you click on a suburb, the Map Auto update and change colors relative to the suburb selected, very simple yet very powerful

And please I have zero interest in this useless debate who is a better BI tool, I just want PowerBI to implement a similar behavior or giving us an alternative, Maybe make a Visual accept multiple datasets.

As a user all I can do is to show my displeasure in public and hope other users will vote