I was reading this blog post and thought of a new use case, using OpenstreetMap Data and generate polygons based on the user Selection
First to reduce cost, we will select only all a subset of OpenstreetMap Data, you can use this post as a reference
my base table is OPENSTREETMAPAUSTRALIAPOINTS , which contains 614,111 rows
The idea is to provide some tag selection ( School, cafe etc) and let BigQuery generate a new polygons on the fly, the key function in this SQL script is ST_CLUSTERDBSCAN
WITH
  z AS (
  SELECT
    *
  FROM
    `test-187010.GIS.OPENSTREETMAPAUSTRALIAPOINTS`
  WHERE
    value IN UNNEST(@tags_selection)),
  points AS (
  SELECT
    st_geogpoint(x,
      y) AS geo_point,
    value AS type
  FROM
    z ),
  points_clustered AS (
  SELECT
    geo_point,
    type,
    st_clusterdbscan(geo_point,
      200,
      @ct) OVER() AS cluster_num
  FROM
    points),
  selection AS (
  SELECT
    cluster_num AS spot,
    COUNT(DISTINCT(type))
  FROM
    points_clustered
  WHERE
    cluster_num IS NOT NULL
  GROUP BY
    1
  HAVING
    COUNT(DISTINCT(type))>=@ct
  ORDER BY
    cluster_num)
SELECT
  spot AS Cluster,
  st_convexhull(st_union_agg(geo_point)) as geo_point,
  "Cluster" as type
FROM
  selection
LEFT JOIN
  points_clustered
ON
  selection.spot=points_clustered.cluster_num
  group by 1
union all
SELECT
  spot AS Cluster,
  geo_point ,
type
FROM
  selection
LEFT JOIN
  points_clustered
ON
  selection.spot=points_clustered.cluster_num
Technically you can hardcode the values for Tags, but the whole point is to have a dynamic selection
I am using Data Studio and because the Query is not accelerated by BI Engine , and in order to reduce the cost, I made only 6 Tags available for user selection and hard code the distance between two points to 200 m.
Here is an example when selecting the tags (restaurant, school and fuel), I get 136 cluster
here when I zoom on 1 location, the result are pretty accurate
I think it is a good use case for parameters, GIS calculation are extremely heavy and sometimes all you need from a BI tool is to send Parameter values to a Database and get back the result.
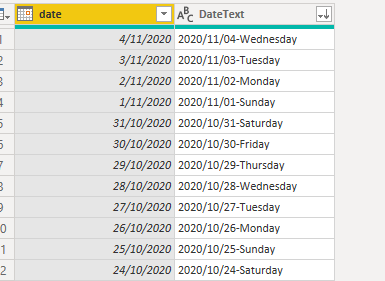
I had a perfectly Working PowerBI report the last 7 Months , The data is refreshed daily, but we need to see the weekly Quantity basically on a rolling basis of the last 7 days.
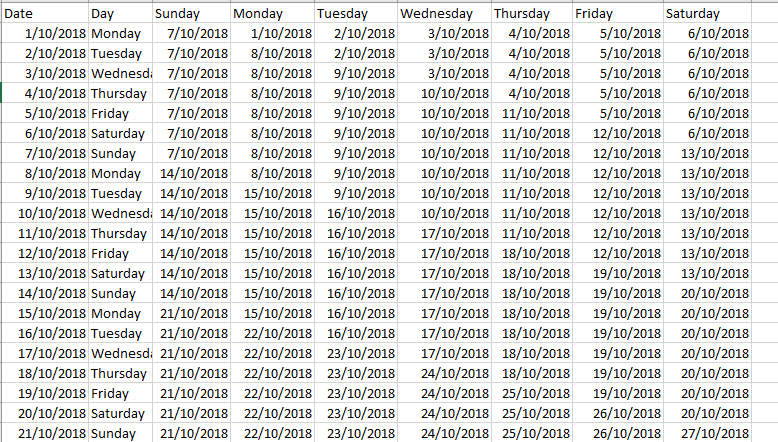
When the data refresh, a calculated column generate a new weekly grouping based on the latest update from a Fact Table “Quantity Installed”, see example here
Everything Worked well, till someone asked if he can filter previous days, let’s say the report is Updated Monday, but he want to see the Data only till the previous Thursday , which is the official Cut off for the Client reporting.
Obviously it is easy just filter the data, but visually it is annoying as the weekend date is still Monday, calculated column change only when your refresh a report , Then they are fixed.
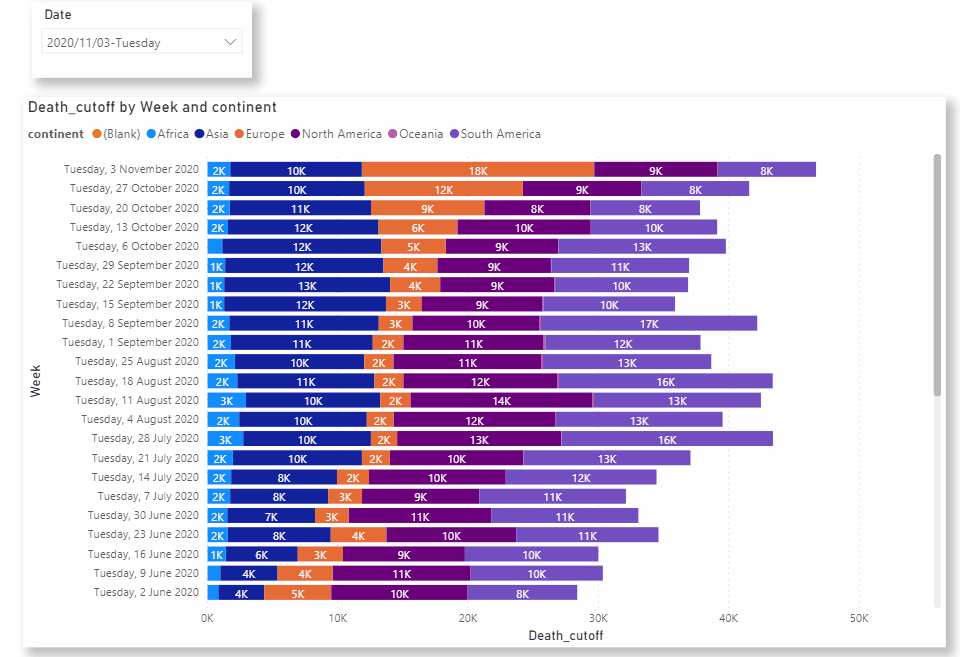
To show an example, this report show the total fatalities due to COVID19 per Week, The Cut off is 03/11/2020 which is a Tuesday, the weekly calendar is based on Tuesday as the end of the week
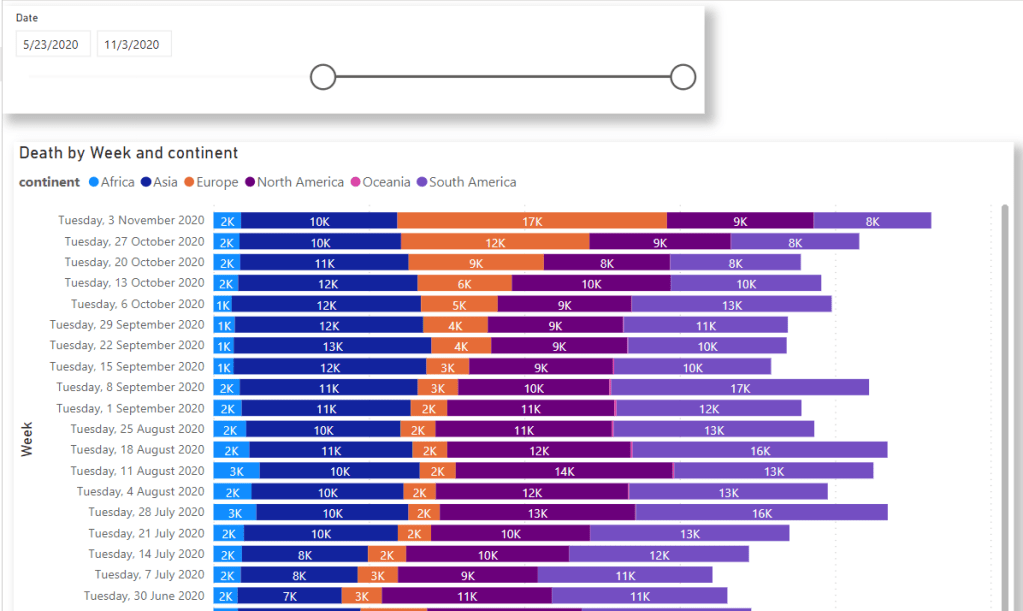
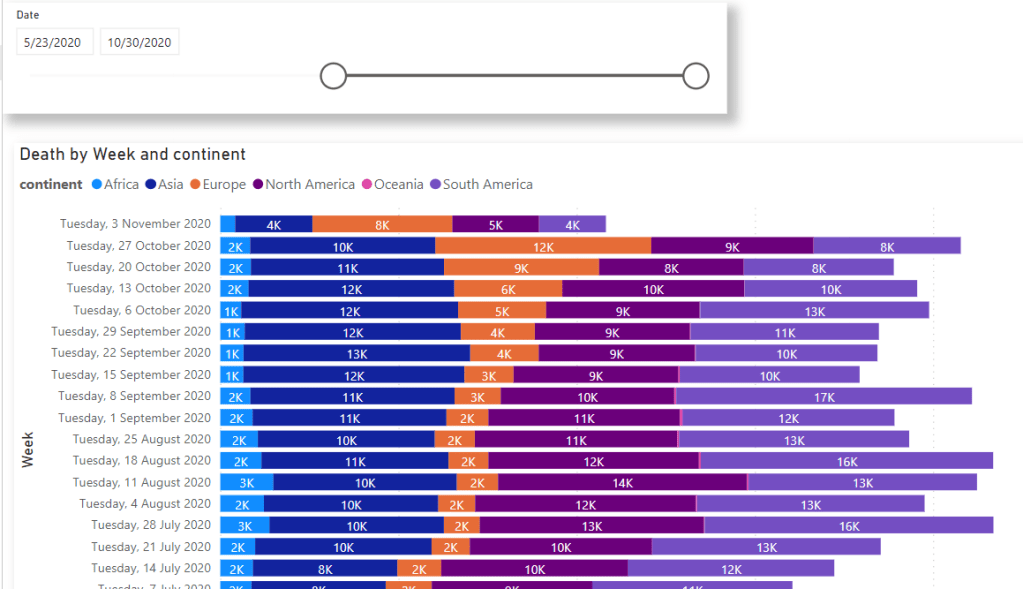
Now if you filter the data to the Previous Friday, the Weekend do not change, hence you get the impression that the total number for the Current week are going down which is not correct.
So, I asked in PowerBI forum how to do that, and Brian Maher solution is as columns do not change, we need to change the DAX,see link to the original solution
“The measure below checks to see if our date on the X-axis is the same day of the week as your slicer. If not it returns BLANK( ), if it is the same day of week, it sums the qty for the previous 7 days”
It is basically using a well know technique in DAX, show all the dimension value then anything with BLANK() result will be filtered out.
The DAX works perfectly, and solved the user request but , In my real case I had a lot of measures, changing all of them and risking introducing regression for a perfectly Working Data Model just for this small request was not worth it.
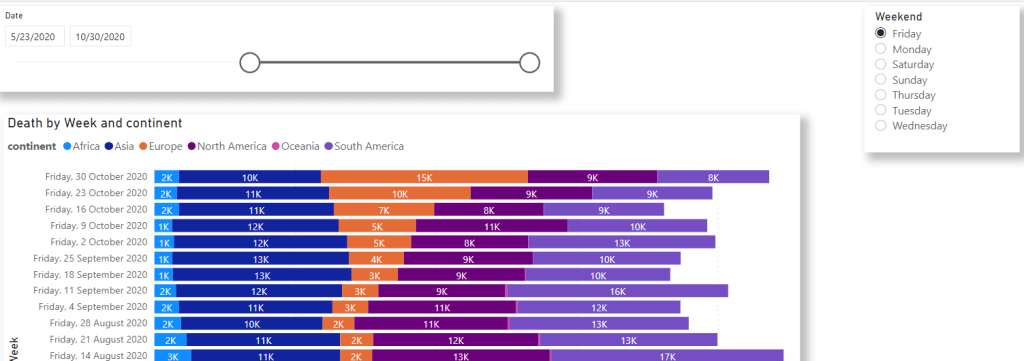
All I wanted is somehow make the column Weekend Dynamic at runtime, which was not possible till …… October 2020, we do have a new option, we can finally change the dimension dynamically and keep the DAX simple !!!!
if you have not heard about the New Parameter, maybe a good start is here.
My first attempt was to get the Day of the week in PowerQuery, but unfortunately Query Folding stopped Working and to be honest there is no clear way to know what’s supported or not as it is data Source specific, here I am using BigQuery.
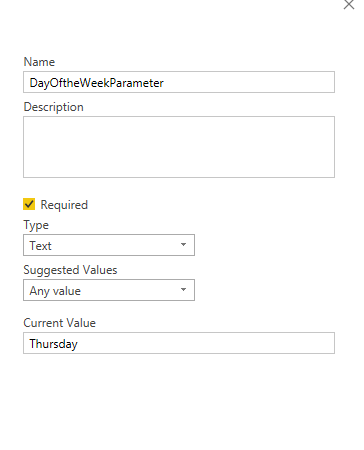
Instead I create a simple calendar table with a column Day and 7 columns with all the possible week end ( Saturday, Sunday etc)
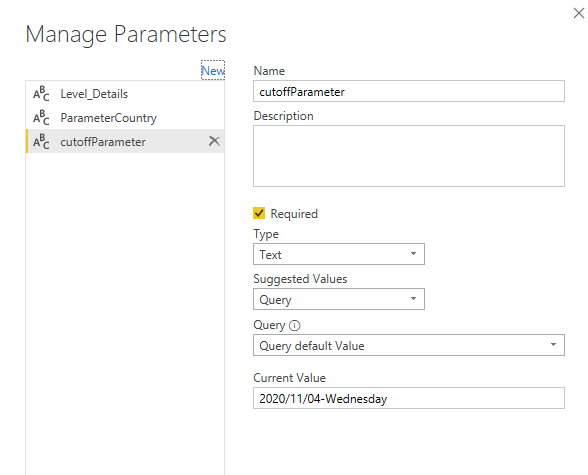
and then Create a new Parameter, with a default Day Thursday
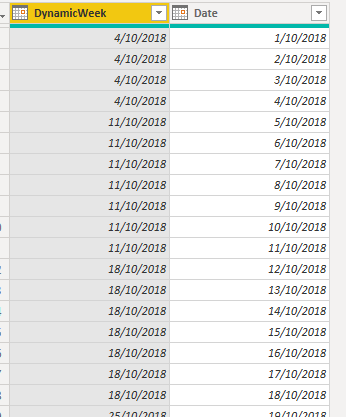
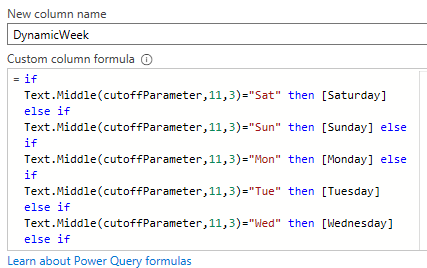
Then Created a new Column “DynamicWeek” using this formula
I think we can agree the formula is trivial , a simple if then else
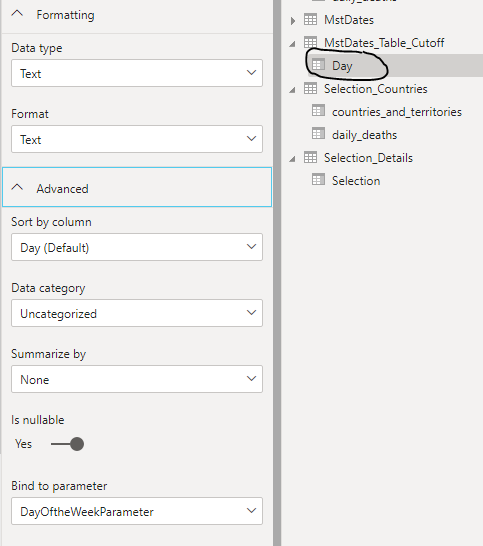
In order to make the parameter Dynamic, we create a new disconnected Table (not connected to any other Tables in the Model)
Then we Bind the Value of the Column Day to the Parameter
When the User changed the value of the disconnected Table using a Slicer
The Value get passed to the Parameter which Change the Value of the Column “Dynamic Parameter”
And here is the result
Update
a couple of hours after I published this blog, I got an idea that actually did Work.
Query folding does not work with the function Day of the Week, but Text.Middle did fold indeed, so all I had to do is create a new Disconnected Table like this
the same approach add a calculated column in the calendar Table
Just to be fancy, in the parameter, I used a Query that return always the latest date as a default value
and View of the Data Model
Created a new Measure that use the Disconnected Table as a filter Cut off, so the date get filtered
Death_cutoff = Var Sum_=sum(covid19new[daily_deaths])
return if (min(MstDates[Date])>SELECTEDVALUE(MstDates_Table_Cutoff[date]),BLANK(),Sum_)
I imagine you can search the date text and see if it is the end of the Month and generate Monthly calendar for example, a lot of flexibility.
notice here, because the Date Table is DirectQuery ( the fact and the parameter selection table are import) at least when using BigQuery the response time for the first select is around 3 seconds, but when you do the same selection, it become instantaneous as PowerBI cache the query result.
Now the Exciting part is which we don’t have yet, but apparently is coming next year at least for SnowflakeDB and Redshift, we will be able to write Custom SQL Query with Parameters in DirectQuery Mode, and then basically we will have finally “Dynamic Calculated Column“, ok if we have them in Import Mode, it is even better but let’s not get too Excited 🙂
DAX is extremely versatile , combine that with Dynamic column and we have a very powerful new tool, the future is exciting.
I created this dynamic bar chart which change the granularity based on the date selected, so if you the date selected > year, it will group the data per year then you can drill down to Month, the same if it is Month, you can drill down to week etc. see Example here.
it was just for fun, but someone asked me how it works, I thought it is worth a Quick Blog.
As of 27 October 2020, the date parameter are only available if you connect to BigQuery.
ok, basically you need just create a custom Query that calculate the duration between the start date Parameter and end date parameter which are passed by the Calendar Control
This example is using Average Australian wholesale Electricity Market, Obviously it works with any dataset that contain date.
WITH
   xx AS (
   SELECT
     *EXCEPT(YEAR),
     CAST(DATE_TRUNC(DATE(SETTLEMENTDATE), YEAR) AS timestamp) AS YEAR,
     CAST(DATE_TRUNC(DATE(SETTLEMENTDATE), MONTH) AS timestamp) AS MONTH,
     CAST(DATE_TRUNC(DATE(SETTLEMENTDATE), WEEK) AS timestamp) AS WEEK,
     CAST(DATE(SETTLEMENTDATE) AS timestamp) AS date,
     DATE_DIFF(PARSE_DATE('%Y%m%d',
         @DS_END_DATE),PARSE_DATE('%Y%m%d',
         @DS_START_DATE),DAY) + 1 AS nbrdays
   FROM
     xxxxxxx.PRICEARCHIVE
   WHERE
     DATE(SETTLEMENTDATE) >= PARSE_DATE('%Y%m%d',
       @DS_START_DATE)
     AND DATE(SETTLEMENTDATE) <= PARSE_DATE('%Y%m%d',
       @DS_END_DATE)
     AND UNIT="DUNIT")
 SELECT
   REGIONID,
   RRP,
   nbrdays,
   CASE
     WHEN nbrdays <= 1 THEN SETTLEMENTDATE
     WHEN nbrdays <= 7 THEN date
     WHEN nbrdays <= 31 THEN WEEK
     WHEN nbrdays <= 365 THEN MONTH
   ELSE
   YEAR
 END
   AS newdate,
   CASE
     WHEN nbrdays <= 1 THEN SETTLEMENTDATE
     WHEN nbrdays <= 7 THEN SETTLEMENTDATE
     WHEN nbrdays <= 31 THEN date
     WHEN nbrdays <= 365 THEN WEEK
   ELSE
   MONTH
 END
   AS newdate2
 FROM
   xx
Edit: 16 may 2022, the hack is no more required, PowerBI released fields parameter that support this functionality out of the box.
Edit : 20 Feb 2022 , SQL Server is finally supported, I test it with an Azure SQL and it worked, it is supported when using the Enhanced Engine in Dataflow, make sure you use the Power Platform connector.
At Last, PowerBI added support for parameters that can be changed by the end user, I guess from a Business perspective, it is mostly useful when you deal with Big Data load, and you want to control exactly the Query generated at the data source level, but in this short Blog, I will show how some use cases where hard or clunky using DAX became extremely easy to do using Parameters.
pbix file here : notice it is connecting to my DB instance, so it will not work but you can see the Data Model.
I think it is wise to read the documentation here first
Chris Webb has a great use case using Azure Data explorer here
Update : I added a new use case here, changing weekend Date Dynamically
We want to change a dimension based on a user selection from a slicer, currently Only DirectQuery is supported and to be honest, the documentation does not tell which data source works, we know SQL server is not one of them, Thanks to Alex for his clarification, Luckily BigQuery Works ( that was a very nice surprise to be honest)
I am using the Covid19 data set as an example (as it is free and don’t incur any charge till sept 2021), we want to switch dynamically between countries and continent
1- Load the main Table as import mode
2- Create a parameter ” Level_Details”
3- Import dimension Table with the values countries and Continent in Direct Mode:
I created a view in BigQuery , PowerQuery stopped folding when I tried to remove duplicated, although it is free data source, it is important to use directQuery only with dimension Tables to reduce cost and Data volume
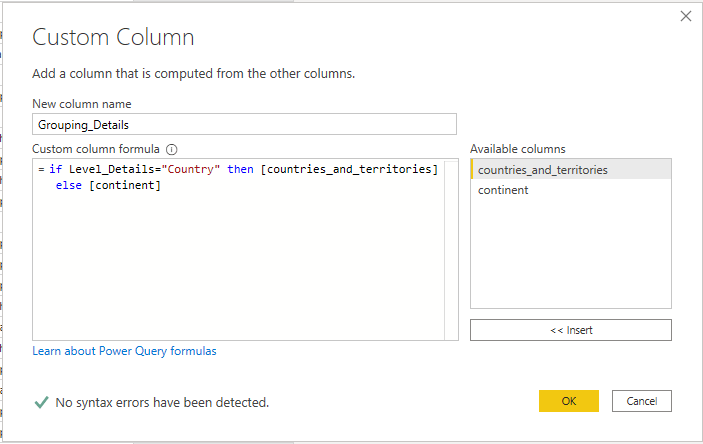
4- Include the parameter logic in Dimension Table
I created a new Column “Grouping_Details” based on the Parameter Value, it will Take either Countries or Continent
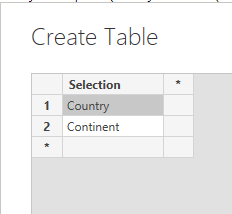
5- create a new Table that contains all the possible values for the Parameter
by the way, you can use any table, either imported, or generated using DAX, this is a very clever implementation by the PowerBI team compared to Other BI Tool.
6- Bind the value of the column “Selection” to the Parameter
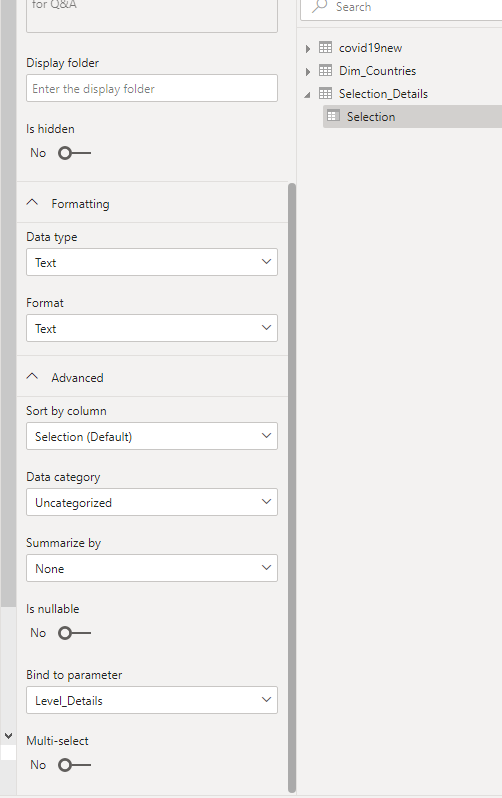
here is a View of the Data Model
it is very Important that “Selection_Details” stay as a disconnected Table, otherwise it will create new filter selection in the Queries which we don’t want, it will work but we want to control exactly the Query generated by PowerBI
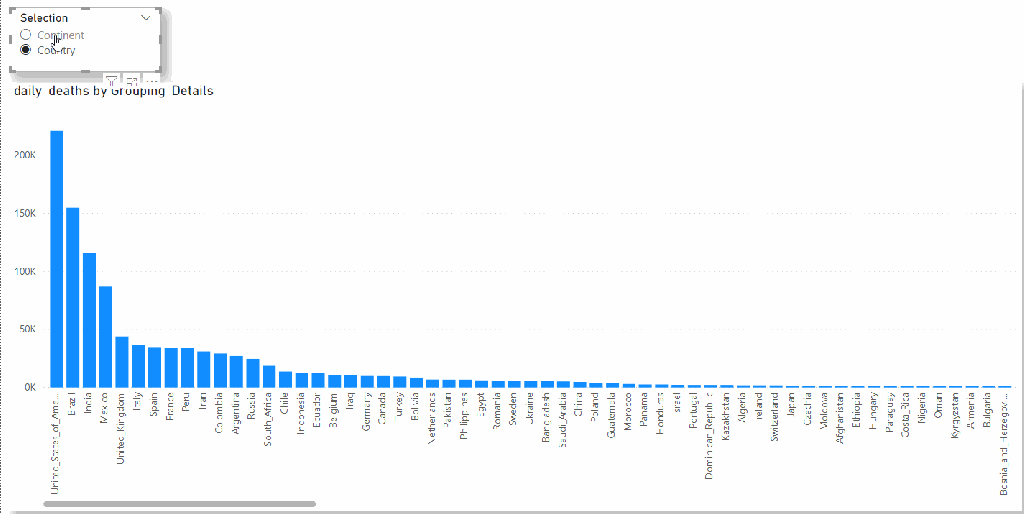
And the Report
The feature is in Preview and I am sure, they will introduce more Data Sources and functionalities, by adding support to BigQuery, Microsoft sent a clear message, PowerBI is the best Data Analytics tool and they will support any third Party Data Warehouse, even if it is a direct Competitor.
Personally,I am very excited by the thought that we are very close to Finally have Parameter Action In PowerBI , and that will introduce a new class of Visual Analytics Interaction that was not even Possible, Please need some Votes here
Btw, if you use BigQuery with PowerBI, I appreciate some votes here, we need the support of Custom SQL Query with Parameter