“Modern” BI tools are missing something like PowerBI Composable SQL Generator

If you are on twitter or LinkedIn, Probably you heard already about the emergence of the “Modern” Data Stack and the triumph of the Cloud Data warehouse , this is all good, I use BigQuery BI Engine and I am amazed at what can be done with a little Bit of SQL.

Before I used to have an obsession with semantic model, I always thought you can’t have a decent analytical workflow without a proper multi fact semantic Model or what’s called now “Metric Store” , but I started changing my mind, flat wide table with multi grains are definitely ugly but they work , and storage is cheap, the point is ; there is a workaround it is not a showstopper, I think the issue is Further downstream.

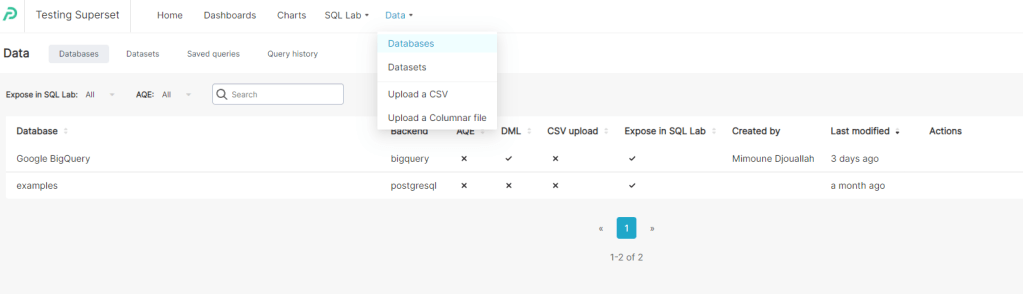
To explain my point I will use PowerBI , and compare it to Apache Superset as an example, but the same can be said about other “Modern” tools too.

Analysis of Simple Table

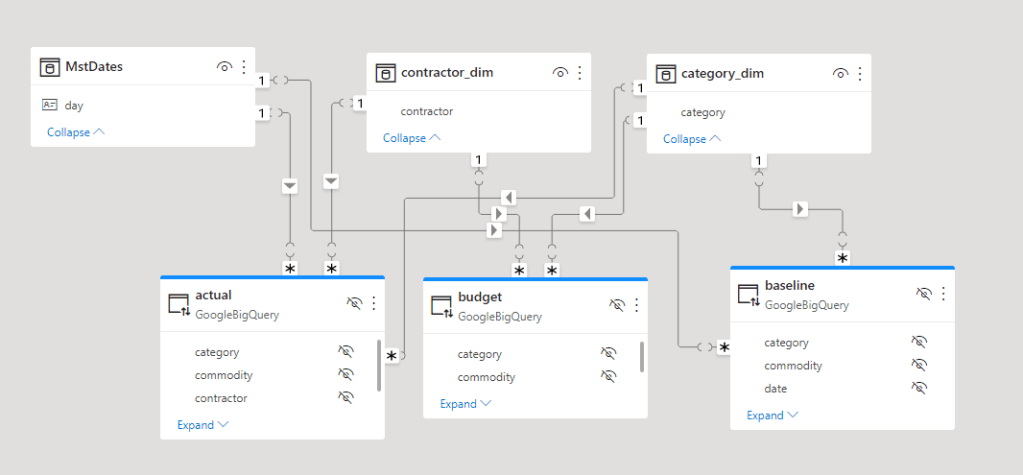
we will try to analyse only one table using Direct Query mode, the Table is loaded in an external Database, so no ETL , no OLAP, no data movement.

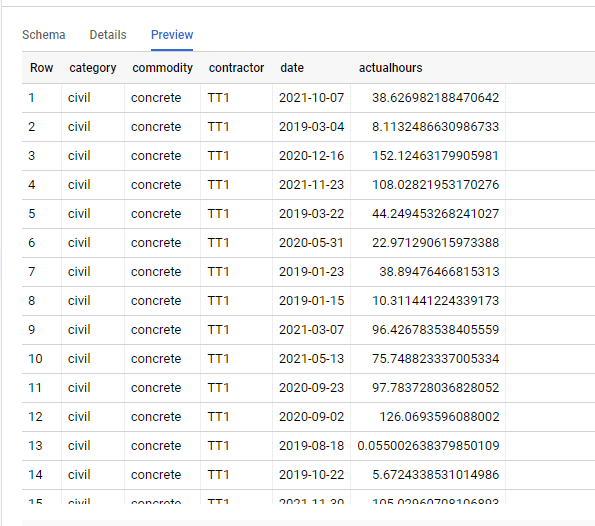
Then I created this simple Report

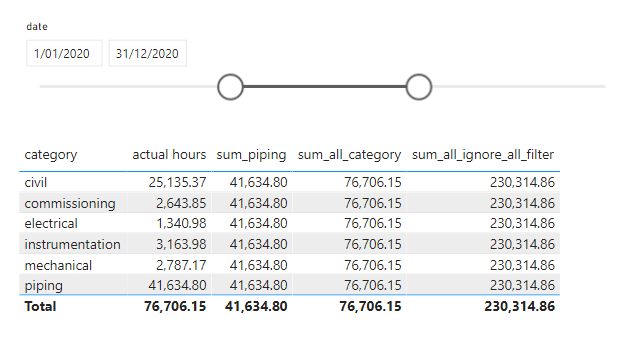
The main metric is Actual Hours, which is basically sum (Actual Hours) grouped by category, to my surprise, it was trivial to reproduce the first three metrics easily using Apache Superset

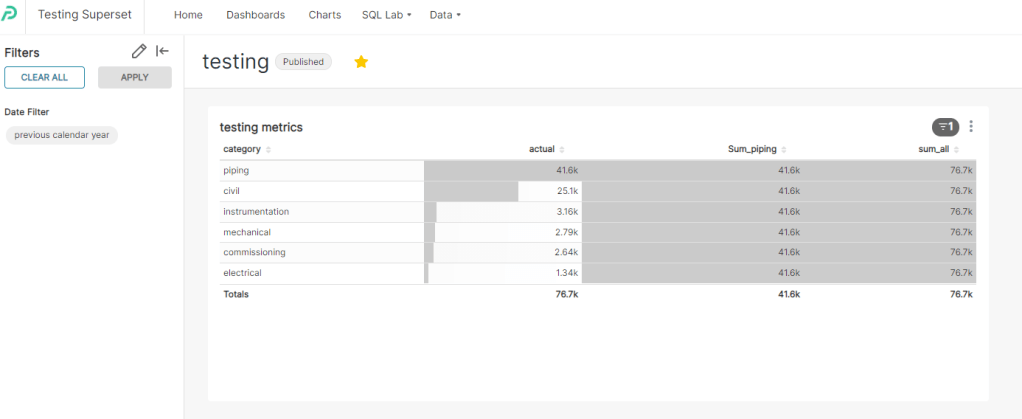
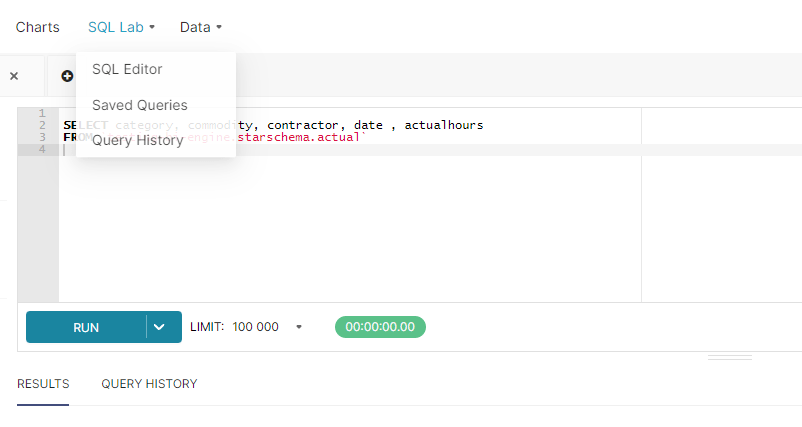
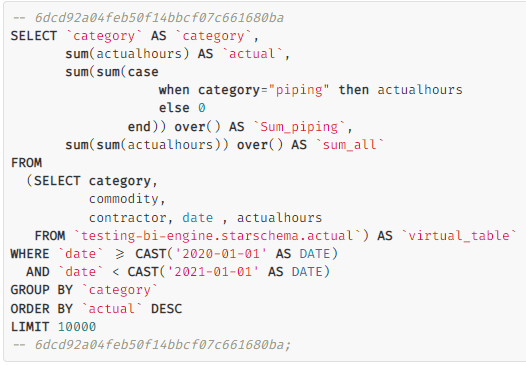
The SQL was not too complex

SQL Aggregate can not simply ignore filters

The Problem started with the Metric “sum_all_ignore_all_filter”, which basically sum the total hours and ignore any filters or grouping, In PowerBI, we use this syntax to get this behavior

sum_all_ignore_all_filter = CALCULATE(sum(actual[actualhours]),REMOVEFILTERS())

now let’s see the Query generated by Superset

As far as I know there is no way in SQL to add an aggregation and tell SQL to ignore the where clause , I presume you can create another Query and do a join, but I don’t think Superset permit this in the Metric definition, another solution is to use Parameters to pass the filter values, but then you will lose cross filter functionality.

Now you may wonder how PowerBI solved this Problem, how it is possible by just writing a generic Metric, it will always works regardless of filters or which dimension is used in group by ?

I know it is pretentious statement, but in my View this is the Ethos of the Product, this the killer feature of PowerBI

The idea is very simple, PowerBI DAX Engine will just send multiple SQL statement and assemble the results , the implementation is very complex involving two engines ( formula and Storage Engine), complex Query plan, and even a patent which I think it is worth reading , but obviously this is all hidden from the user.

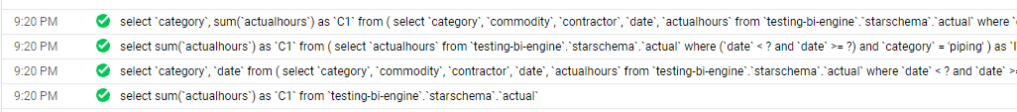
here is a look at how the PowerBI process the report

And the Actual SQL Queries generated

Take Away

Obviously this is only my own understanding from an analyst point of View, but as far as I can see , all I can read is SQL is better than proprietary DSL, but no one explain how to handle very complex calculation that ignore filters and level of details using SQL and keeping the flexibility of Metrics, where they are just supposed to work.

The Previous example was just simple use case with one table, now imagine a complex model with multiple tables and Non additive Metrics.

I am not suggesting PowerBI is the only software that can do that, all what I am saying “Modern” consumption layer tools need to have more sophisticated SQL Generators.

First look at Apache Superset from a PowerBI user perspective

Apache Superset is a very well known open source BI tool, I knew about it for the last couple of years, but was not thrilled by the idea of running a docker image on my laptop, recently though a new company Preset created by original author of the software start offering a cloud hosted service, basically they maintain the service and the consumer just use the software.

The pricing is very competitive, a free starter Plan with up to 5 users, then a pro plan for 20 $/Month/user ( the same as PowerBI PPU) and an Enterprise plan with custom pricing, kudos for the vendor for providing a free limited plan for users to learn and test.

The selling Point of Preset is very simple , it is open source software, so there is zero risk of vendor lock-in, if you are not happy with their service, you can always move your assets to another Provider or hosted yourself on-premise or in any cloud provider, this arguments is very attractive and make sense for a lot of customers , and companies like Red Hat have a good success using this business Model.

User interface

The user interface is simple and predictable which is a good thing, if you have used PowerBI or Data Studio you will feel at home.

Generally speaking there are two type of BI tools

  • Integrated : The BI tools provide, ETL, Storage, Modeling and the viz layer , as an example : PowerBI, Tableau, Qlik , Data Studio
  • Light : The BI tool scope is only Modeling and the viz layer, they need an External Database to host the data and run the SQL Query, Example Looker, Bipp etc ( I reference only the tool I personally used)

I guess the big assumption here, is that you have already a mature Data infrastructure which can be Queried from the same Data Base , Superset like Looker can not Query two DB in the same Dataset, The sweet spot for Superset is when all your data is hosted in a Cloud Data warehouse

Connecting to the Database

As usual I used BigQuery as my Data Source, the connection was pretty trivial to setup, although I could not figure out how to activate CSV upload

Building a Dataset

Dataset is the Data model it is the same concept as PowerBI with dimensions and Metrics (Measure), but it does not support relationships , you have to manually build a Query that join multiple tables or leverage a View in the Database , The metrics and dimension use SQL as calculation language.

One confusing aspect of the User interface; if you want to build a Dataset based on one table, you just click Data, Dataset then add Dataset, simple, but if you want to build it based on a SQL Query, you need to click on SQL Lab, then SQL Editor , you write the Query then save it as a dataset.

Example : Dataset based on A SQL Query and Parameter

I have a simple multi Fact semantic model in PowerBI, and usually used it as test case, 3 Facts with different grains and 3 dimension

I add this SQL Query to generate the Dataset, Parameter is used to pass date as a filter, yes I am biased, I used PowerBI for so long, that writing SQL Query to return Dataset seems strange.

{% set param_Date = filter_values('day')[0]  %}
SELECT category, commodity,  actualhours ,  budgethours ,  forecast
FROM (
  SELECT category, commodity , SUM(actualhours) AS actualhours
  FROM `testing-bi-engine.starschema.actual`
   WHERE date <= date(TIMESTAMP_MILLIS({{cache_key_wrapper(param_Date)}}))
  GROUP BY category, commodity
) t2
FULL OUTER JOIN (
  SELECT category, commodity , SUM(budgethours) AS budgethours
  FROM `testing-bi-engine.starschema.budget`
  GROUP BY category, commodity
) t3 USING(category, commodity)
FULL OUTER JOIN (
  SELECT category, commodity , SUM(forecast) AS forecast
  FROM `testing-bi-engine.starschema.baseline`
  WHERE date <= date(TIMESTAMP_MILLIS({{cache_key_wrapper(param_Date)}}))
  GROUP BY category, commodity
) t4 USING(category, commodity)

The metrics

The Columns

I am using BigQuery BI engine, one fact is 43 Million rows and another is 1 Million, and although Preset Cloud is hosted in AWS even with network transfer the experience is very smooth, as of this writing Publish to web is not supported yet, so all I can show is this GIF

Chart library

Apache Superset has a very decent visual library, the first I checked is Pivot table and it is not bad at all , my understanding cross filtering will be supported only on E Charts Viz

Take Away

Superset is a mature open source data consumption layer with an enterprise support provided by Preset Cloud, if you have a mature data infrastructure and you know SQL very well, then it is worth a shot, I suspect it will be very popular with tech savvy companies and startups.

Edit : added a new post about Superset SQL Metrics