This blog is a POC of something that I always wanted to have in a BI tool, and I tried Tableau, PowerBI and Data Studio, without success ( not interested in adding an invisible grid as a hack), The idea is extremely simple yet very powerful, retrieve data when you click on a map, you may think it should simple, it seems BI tool are good at retrieving data based on filter, but it is very hard to push a parameter from a map back to a source data.
Traditionally, if you want to have this kind of interactivity, you need to write code, to be honest the idea of writing javascript and learning how to deploy a web server was not very interesting for me, but luckily we have a new Option in Streamlit
Streamlit is a code first, web app platform using only Python, web page are generated behind the scene, and there are a lot of component where you need to write a minimum of code, and deployment is absolutely trivial using Streamlit Cloud, and because it is open source, you can deploy using alternative approach like Cloud Run, or Azure
I came across this component Streamlit-Folium recently, and it is magnificent work, when you click on a map, it does provide variable back on the last location clicked zoom, bounds etc, all for free, no code required !!!!
All I have done is copied the code from the source and built a SQL Query that take the last clicked item filter all the “cafe” in a radius of 500 m, the SQL Code is copied from this previous Blog
The Source Data is nearly half a Million, as you can imagine plotting a massive dataset just to see a small portion is a waste of computer resources.
here is the final results
Here an example of a SQL Query generated.
State management
I added the code here, again it was too easy to write as I nearly copied everything from the component sample code, the tricky part was how to update the value of a variable which was already declared, Streamlit has a brilliant solution using State Management, the solution is very simple
Assign a default value when the Streamlit run for the first time
if 'key' not in st.session_state:
    st.session_state.key = '( 153.024198,-27.467276)'
    st.session_state.key1 = [-27.467276, 153.024198]
    st.session_state.key2 = 16
point_clicked = st.session_state.key
location_ini  = st.session_state.key1
zoom_Start    = st.session_state.key2
Update the values when a user click on the map, the next run in the same session will use those new values
Currently I don’t know how to stop Streamlit from redrawing the map, as I am only interested in updating the markers.
Database
it works with Any Database as long as it has a minimum support for GIS functions, Currently I used bigQuery BI Engine as I am familiar with it and to speak freely :), it is very cheap for this kind of workload, small Data and potentially a lot of concurrency 🙂
I tried PowerBI Datamart but it seems Python access is blocked , DuckDB don’t support GIS functions yet, I am sure you can reproduce the results using only SQL, but I did not bother.
I think there is a third way between no code and only Code, Streamlit managed to create a new category, maybe simple code 🙂 having said that BI Vendor should up their games, Location Parameter should not be that hard to implement.
Was chatting with David Eldersveld and he suggested that he wants to run a competition using the famous New York Taxi Dataset with Datamart, long story short, I did endup publishing my attempt before he had the time to start the competition, my sincere apology.
The report is using my personal PPU instance, the data is located here , personally I wanted to exclusively use tools available in PowerBI out of the box, no Synapse nor Azure stuff or BigQuery, Just pure self service tools.
Initially I didn’t really believed that PowerQuery can download such a big volume of data, my first set back , PowerQuery can not read parquet files available in public url, but as usual Chris Webb has an excellent blog explaining the reason, and gave a workaround.
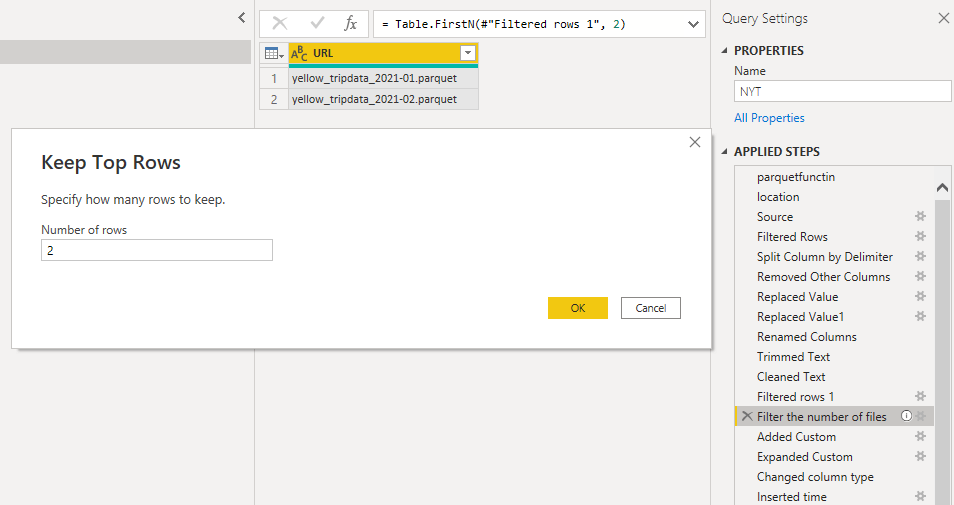
I added the code here, it does work with any PowerQuery in Dataflow, Datamart and PowerBI desktop, unfortunately Excel is not supported yet, when prompted for authentication use anonymous
The only section of the code that you should pay attention to is selecting the number of files to download by default it is 2, but you can increase it
Only when I was writing this blog, I noticed the files for 2022 are using a slightly different URL, will update the code later. Code Updated.
To reduce the database size, I had to split Datetime to date and time, low cardinality is good for performance too.
Loading into Datamart
I don’t know how much it took datamart to load the data, currently Query refresh history is broken, but I think it is more than 6 hours, I maybe wrong, but Datamart take a bit of time to generate the tables with Clustered Columnstore Index
Initially I loaded only 2 then 30 files just to see how Datamart behave and finally I went for 100 files, and it did work again to my surprise.
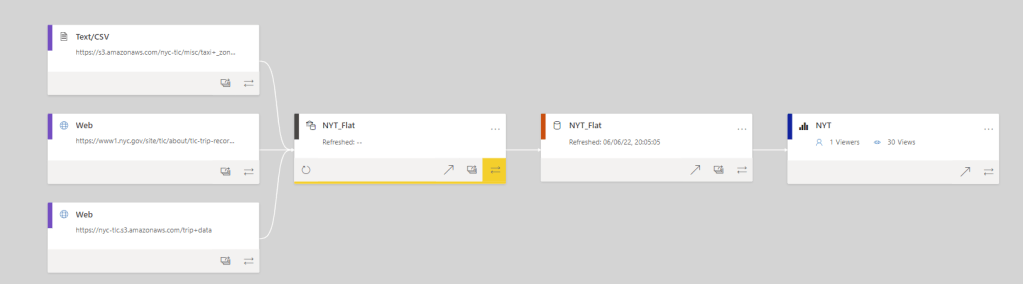
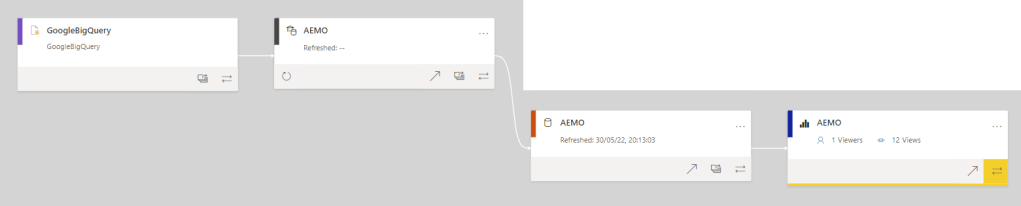
and the Lineage View of the report
Performance
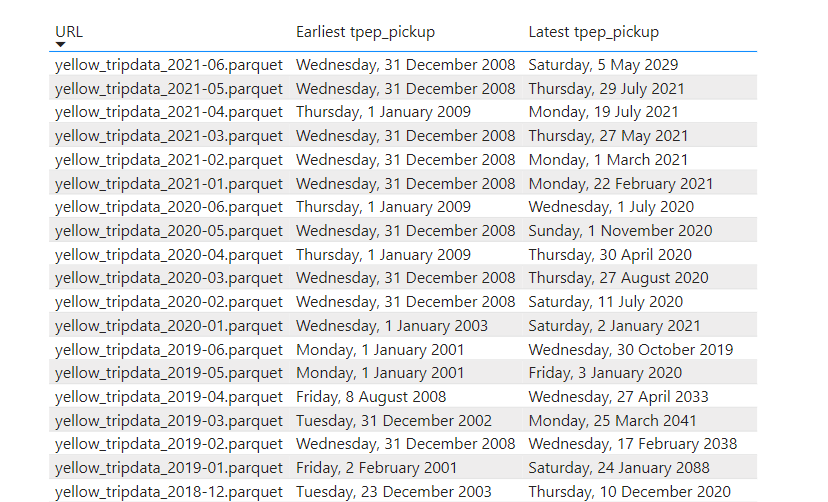
The Performance is not bad at all considering, the data was loaded as it is and it not sorted, although the parquet files are organized by month, unfortunately there are some outlier in every file see for example, so you get overlapping segments.
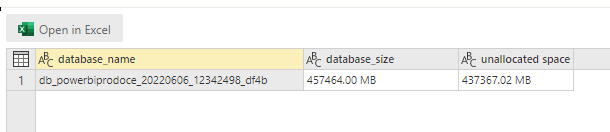
You can check the database size on disk by running this Query
EXEC sp_spaceused
Optimisation
Pretty much the only optimisation you can do in Datamart is to pre sort the data before loading it, but when you have 1 billion rows saved in parquet files, sorting is a very expensive operation, but there are options I think.
Create another Datamart and load it from the “raw” Datamart and define incremental refresh which will create partitions, yes partitions should improve the performance.
Hybrid table in PowerBI Dataset where only the recent data is cached in Vertipaq and the history kept in Datamart as a Direct Query Mode.
Final thoughts
The Publish to web report is here, a very big missing piece is the option to append data to an existing Datamart, this will make adding new data without a full refresh extremely trivial, I know about incremental refresh, and I am sure a hack like this may work, but we want the real deal, Dataflow people hurry up 🙂
I notice something interesting because the price of PPU is fixed, I felt I can experiment without the fear of getting a massive bill, maybe reserved pricing is not a bad thing after all.
My first reaction when I saw datamart was, that it will be a big validation for PowerQuery, and it is, as Alex said, PowerQuery everything !!!
My previous blog about Datamart was based on my daily work, but with the official release of the preview, Microsoft made datamart available in Premium per user License, it happen I have my personal tenant, and what an opportunity to take an advantage of the free 2 month free trial.
Full Online experience
I have some data already available in BigQuery, one thing I notice, I did not thought about dataset at all when I built the report, I had Datamart open in one tab and the report in another.
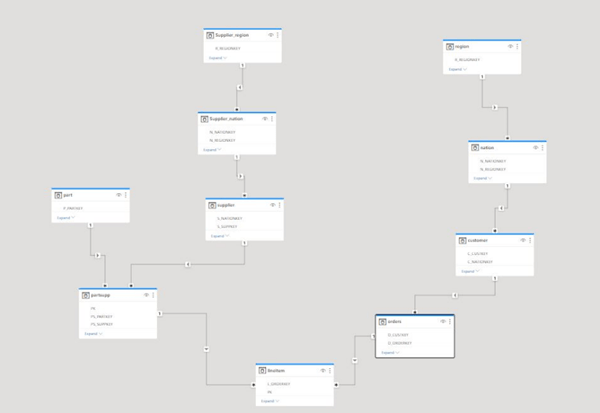
here is an overview of all components used (PowerBI lineage View is a killer feature)
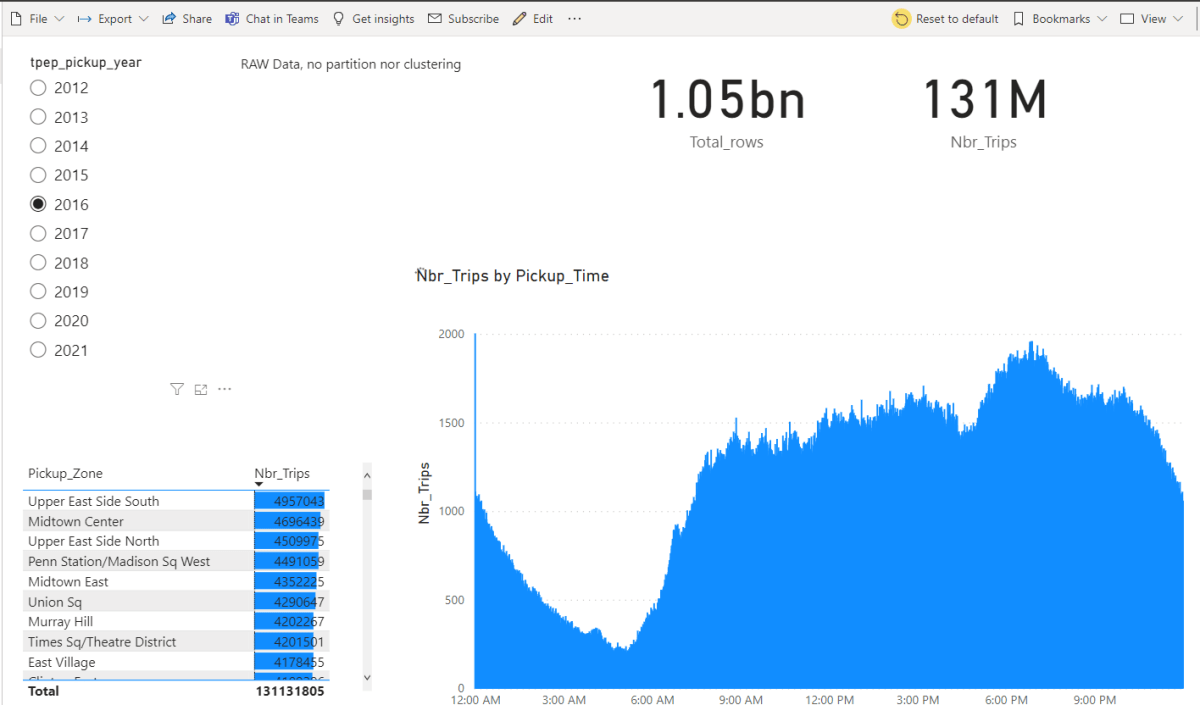
And the final report
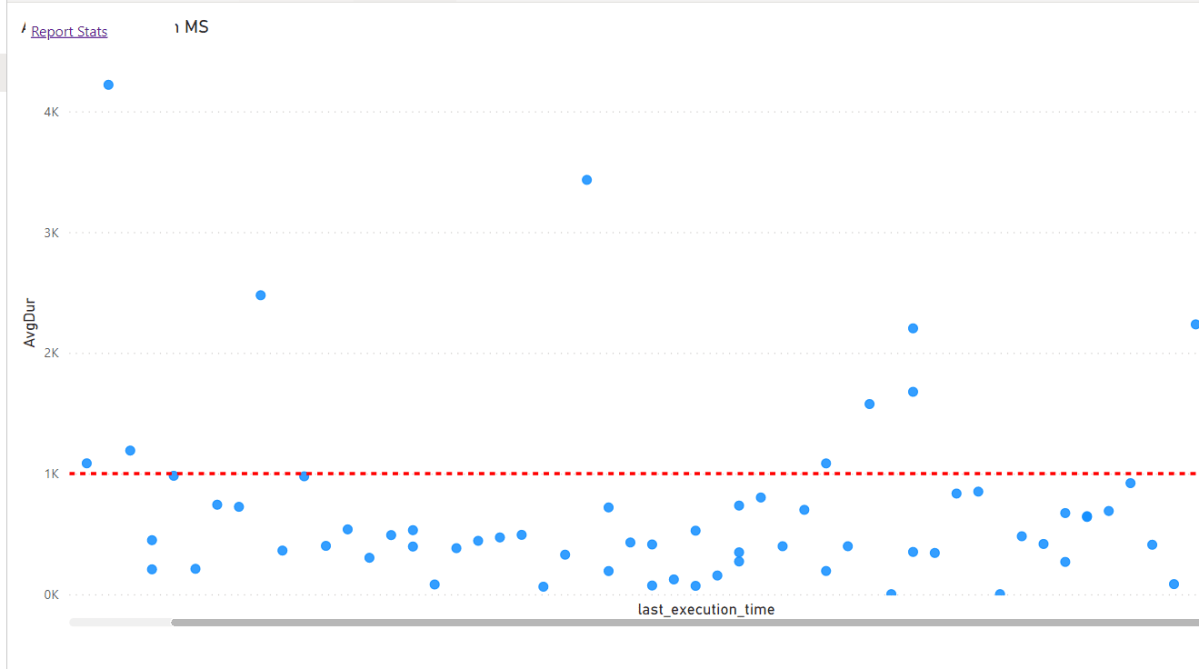
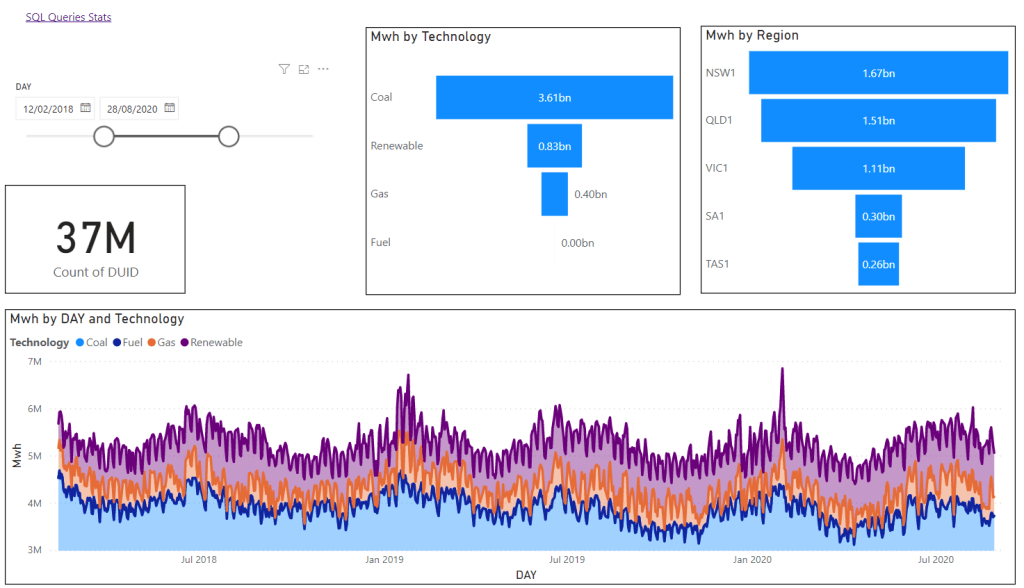
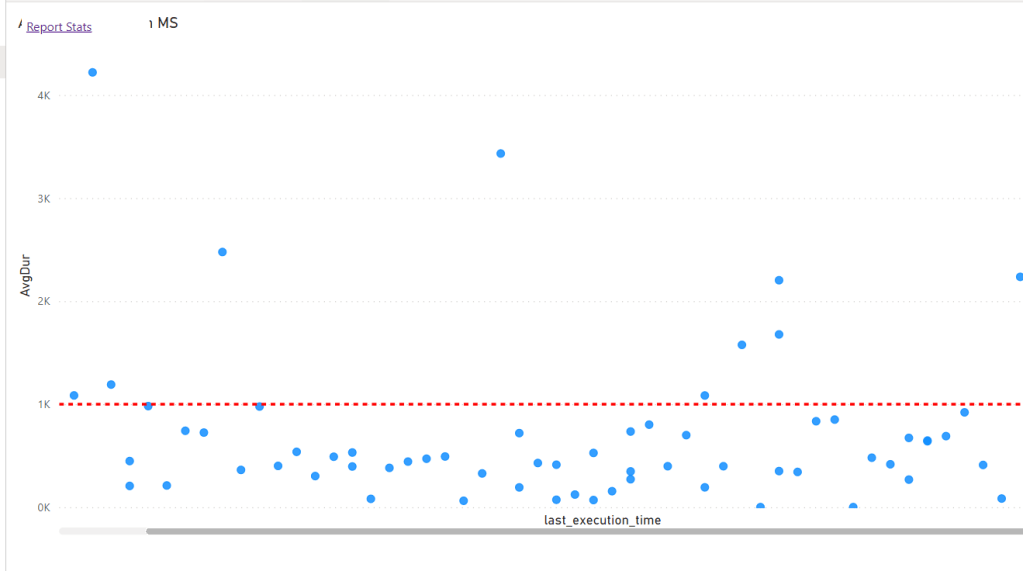
I Built a report too to capture the SQL Queries generated by the first report
most of the Queries render under 1 second, that’s not bad at all for a Fact table with 80 millions records !!!
No vertipaq was involved in the previous report, The auto generated dataset is using Direct Query mode, the user click on a visual, DAX Engine translate the DAX Query and generate SQL which is served by Datamart SQL DB !!!!
Vertipaq is Cool, why use something else ?
Vertipaq has a fundamental flaw, it is simply too fast, the original designers sacrificed a lot of features just to get maximum speed, which is a brilliant decision when you work with a smaller dataset and data that does not change very often ( which is 99.99 % of my daily workload), but it does not support, out of memory operation, if the size of your data compressed is bigger than the RAM, out of luck,and stuff life columns elimination are not supported, in Vertipaq everything is loaded in memory either used or not, again the right choice for extreme speed.
is Vertipaq dead ?
No, again for a simple reason, it is the best engine for the most common workload available in the market, Marco famously said it, PowerBI is successful because most models fit in memory
So why it is a big deal
Microsoft is simply being proactive , a lot of customers especially in the tech sector have higher expectations, they want everything, Good enough latency (it does not need to be in ms), freshness and lower cost, and Vertipaq is not the right answers for all situations, and the first implementation of that Vision is Datamart a fully decoupled architecture where the semantic layer is fully separated from the Execution Engine, yes PowerBI already supported Direct Query, but this is an offering where it is the default mode.
You don’t need a lot of imagination to guess that nothing stop Microsoft from using another SQL Engine, maybe a massive MPP or something like that.
So, what is PowerBI ? I think it is just the DAX Engine, you can pick your Compute Engine, and probably a lot of users will still stick to vertipaq, but we will have the choice, very low latency with smaller data size or good enough latency with a bigger data size.
Power BI product team kindly provided us a private Preview of Datamart a couple of Months ago, the product has many components and may mean different thing to different people( with different technical background ), but at the core, it is a SQL Server DB with columnar compression, and a SQL Endpoint, the Data is loaded using Power BI dataflow, and a brand new Web Experience for Data Modelling and measures authoring, no desktop is required.
Before we start talking about details, let’s get some key feature first.
It is premium only and to my surprise, it is available to PPU too ( 20 $/Month/User is an insane value proposition).
Security is managed by Power BI using Azure active directory, you don’t need any obscure SQL Security knowledge.
Sharing a database is a two click Operation. ( even with external users )
Datamart is very fast, sometimes I had to double check I am not in import mode.
It is a single node server, Data currently is limited to 100 GB per Database.
Currently Only Power BI dataflow can load data ( incremental is supported too), and no support for creating views yet.
Multiple users can use Datamart UI at the same time.
You don’t need to know anything about compression, partition etc, table distribution, data skew, shuffle etc, Datamart handles it automatically, it does create Clustered Columnstore index, statistics, partitions etc.
The product team promises that full DDL/DML is coming soon.
The First success we had was to make some data from Power BI dataflow available using the SQL Endpoint, it was just trivial, Just one Click on the server setting, and voila, a connection string that any tool with SQL Server support can use , Obviously Power BI, SSMS, Excel, Tabular reports, but Tableau, R, Python you name it.
I am a “Traditional” Power BI developer, what does it mean to me ?
Nothing has changed, it is not Power BI version 2,it is not replacing the Vertipaq, you can just keep using Power BI desktop as usual, in my opinion it is just Power BI product team trying to reimagine a better data experience and solving some pain points.
Make Power BI Dataflow a more “Enterprise” solution, there is a SQL Endpoint point, Data engineer will take PowerQuery more seriously now 🙂
An online Modelling Experience, no need to install a VM for Mac users.
A new experience for users with SQL skills, yes you can just write SQL and get results without out Modelling, you don’t need to Know anything about DAX.
Addressing a market that was poorly served before, an easy to use SQL Experience for Business users that don’t necessarily know SQL, and don’t want to model anything.
Bonus point, no Azure access requirement, it is just Power BI experience as we know it and love it.
So how it Works ?
You load the data using Power BI dataflow, it is instantly available in a SQL database, if you know SQL, you can just write Queries, and download an Excel spreadsheet that contains a connection to Datamart SQL Server with a SQL Query , the data will be always up to date, it is not a simply a copy of the results.
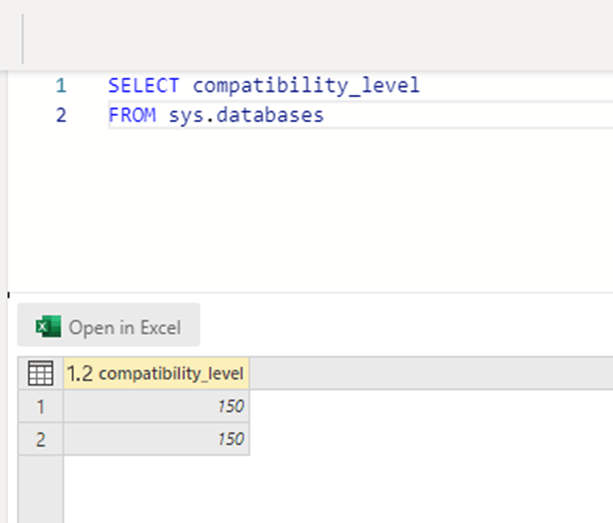
One nice thing about using SQL Server as an Execution Engine, the documentation available on the internet is amazing, let’s say I want to know how much memory the server is using, I just copy it and it works.
Let’s check which SQL server edition, Datamart uses ( 150 means, SQL Server 2019)
here you can see the table structure created by Datamart, 1 partition and multiple segments ( the table has 60 Million rows, each segments is around 700K rows), I think with incremental refresh it create multiple partitions ( I have not test it yet)
Visual SQL
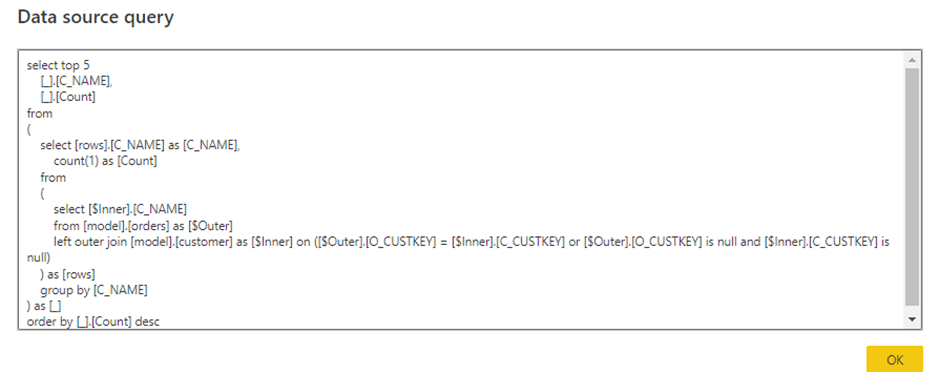
If you don’t want to write SQL, fine just use a Visual Experience to get the results, here I am getting the top customers by number of orders without writing any SQL code, bonus point the SQL is written behind the scene, it is like a Visual dbt 🙂
And the SQL generated
Ok, you don’t want ad hoc stuff fine, you can Model your data by defining relationship and row level security if necessary
To be clear, Tables, relationship and row level security are a pure “SQL artefact” and can be used by any front-end tool as long as it can connect to SQL Server and has proper access using Azure Active directory, and no Measures can not be defined as a SQL 🙂
Obviously, you can connect using SSMS. (notice the relationship columns)
It is Still Power BI
I presume, if you paid for Power BI service, probably you want still to use Power BI as a Visualisation tool 🙂
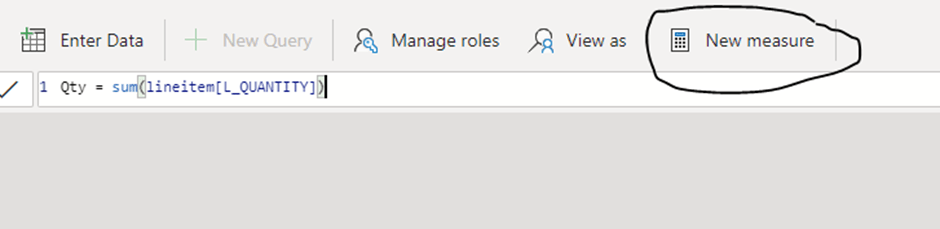
you can define Measures in DAX ( calculated column and tables are not supported, everything must be loaded using PowerQuery)
And here is the Trick Datamart Auto generate a read only Dataset, it is only a logical semantic Model, no data is duplicated, it uses a Direct Query Connection to the SQL Server Datamart.
Auto Generated dataset
I will be honest I did not like it initially, I wanted more control, I want to configure which table to include into the dataset and which one to exclude, Direct Query performance is amazing, but still I want to define some tables as dual Mode, or simply import, and I am not going to be apologetic about it, I like calculated column and calculated table, I used them a lot, and I don’t care if they need some extra size, some pattern are trivial using DAX and very hard ( at least for me) using SQL and PowerQuery.
One day, I changed my Mind , Charles Webb (the PM for Datamart) was very clear in his explanation about the different personas, it is free, and you don’t have to use it in all cases, people with SQL Background and less experience with Power BI will find it amazing, they don’t have to deal with Power BI desktop or extra fancy modelling, people with Power BI experience may prefer to have more control and will extend the Dataset, other advance Developers may want to use Tabular Editor and it is fine.
Flexible Open Architecture
You can have a Datamart that manage everything, or you can keep Dataflow, Datamart, Dataset separated, it is really a nice architecture and provide a lot of flexibility, I think it depends, if you have a Datamart that contains a lot of tables that update based on different schedule it make sense to have dataflow do the ETL first then load the results later using Datamart. ( I think later Dataflow will provide even a more elegant solution)
Anyway, it is flexible and can be tightly coupled if you want to, or you can pick and choose which component to use, and I am sure users will use it in some unexpected way ( I may have loaded some DAX calculated table and expose it to the SQL Endpoint)
One aspect I really like for philosophical reason, even if all the downstream users will end up using Only Power BI reports or Excel, having a SQL Endpoints is extremely important, it is an Enterprise grade solution that can talk to other tools when needed and not a self-service silo.
PBIX Download is annoying
The auto generated dataset cannot be downloaded for a good technical reason, but if you create a report based on it, the report will be download with a pbix that contains a DQ mode to SQL Server, IMHO a better approach is, if you build a thin report from the auto generated dataset, and you download the pbix, it should use only a live connection ( which is the same behaviour if you build a report using the Desktop), but if you download the pbix from Datamart then it should show a Direct Query Mode to SQL Server, it is not a problem per se, but rather unexpected behaviour.
Final thoughts
I think it is an amazing solution that will keep evolving, Microsoft Data team manage to create an exceptional user experience to build a full data stack that anyone can use regardless of his technical background, I remember when I first used PowerPivot in 2015, I knew that it will change the industry (and it did), and I am sure Datamart will do the same.
Initially I wrote a long commentary on how Datamart fit in the “Modern Data Stack”, and how it compares to Other vendors offering, then something occurred to me, Microsoft is just building a useful product that solve hard problems for a very large segment of the market and anything else does not matter, call it “Post Modern Data Stack” if you want.