Using Direct Query mode with Fabric DWH

TL;DR : Direct Query with Fabric SQL is considered a background operation, which means the usage is smoothed over a 24 hours period, this blog is definitely not a recommendation nor a good practise or anything in that nature, but I was just curious, what if this make Direct Query an attractive proposition in some scenarios ?

Use Case, Small Data with frequent refreshes

We assume it is a small company ( 10 users),we will test using a Fabric F2 SKU and PowerBI Pro license as a front end. ( free PowerBI readers start from F64)

Monthly cost = Fabric 156 $ + PowerBI Pro 10 x 10 = 256 US $/Month

In this case, the business requirement is to have the freshness of 5 minutes, the user needs to the see the latest data, which make import not an option as it is limited to 8 times per day
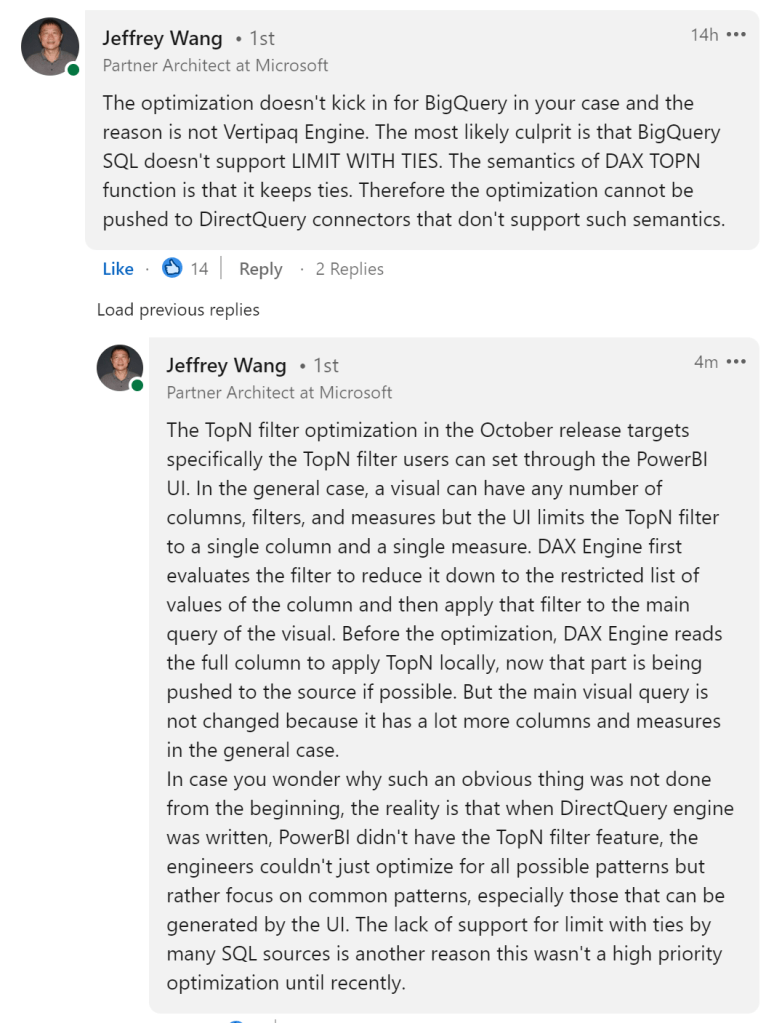
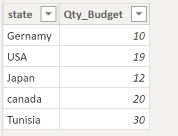
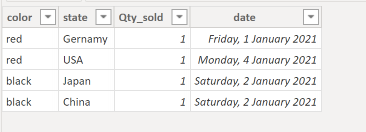
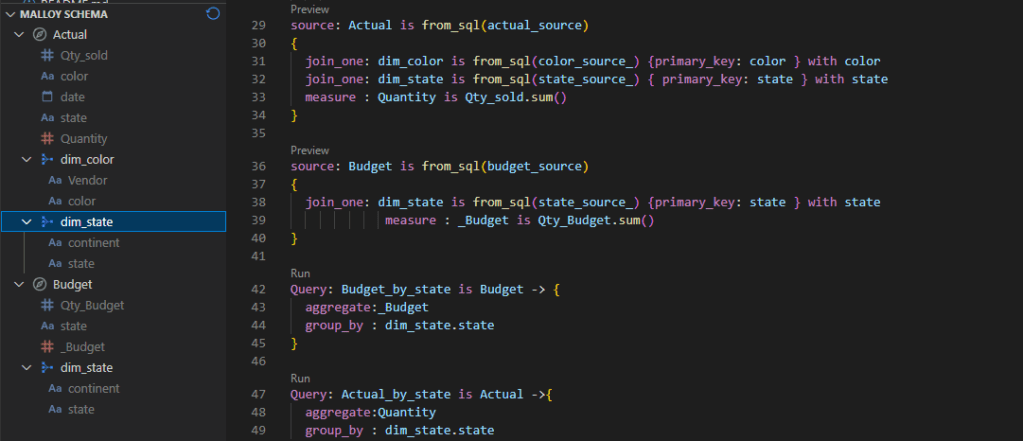
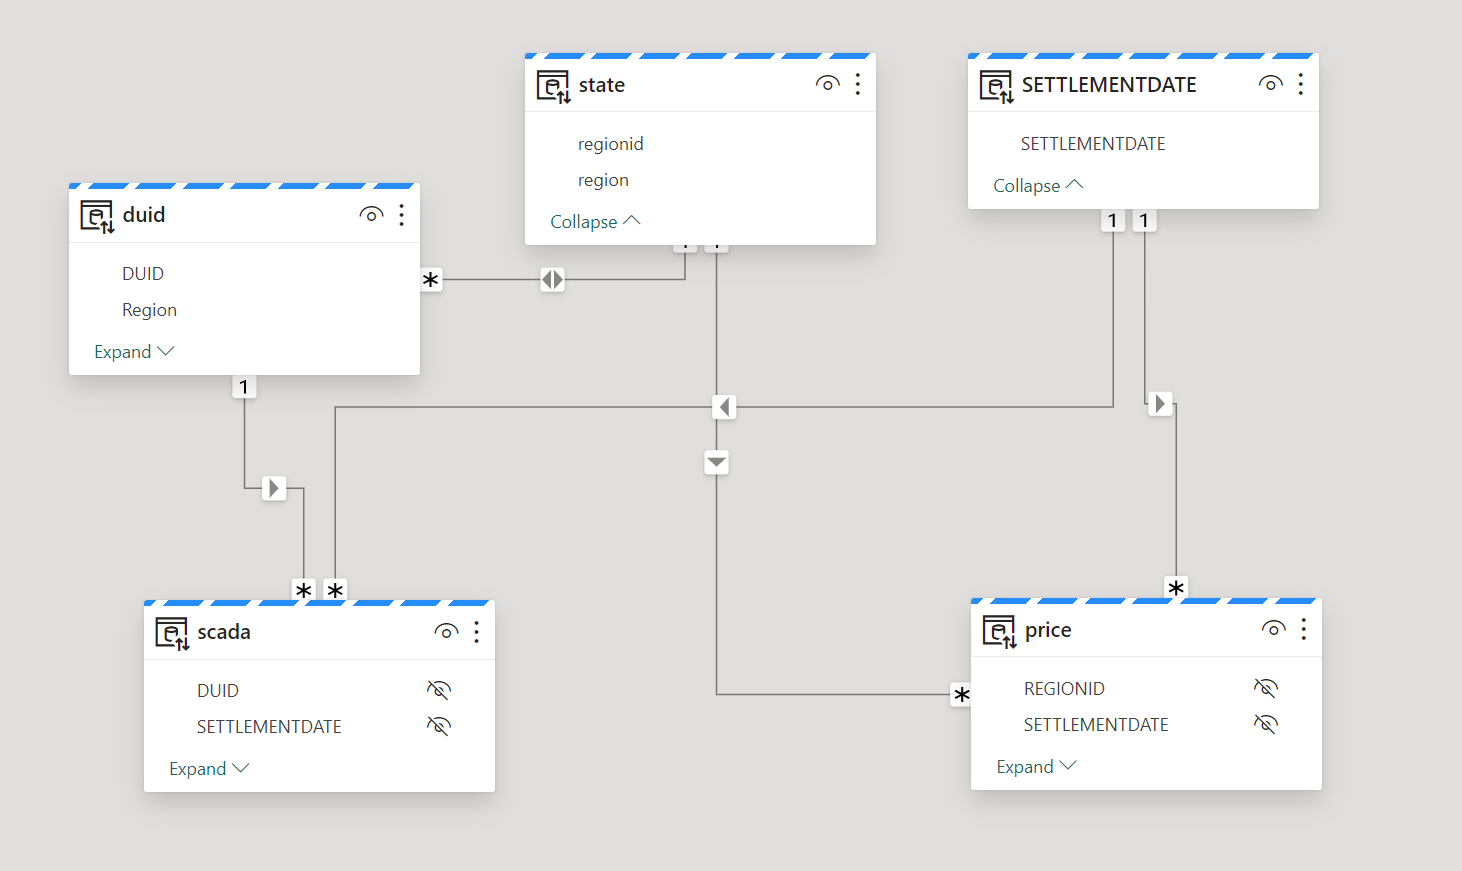
The Data Model

The data model is relatively small, 5 Tables, 3 dimensions and two fact tables, the biggest one is 9 Million rows, the facts are ingested with new data every 5 minutes, Table State and Settlement Date are fixed, and DUID changes very slowly, maybe once every couple of months.

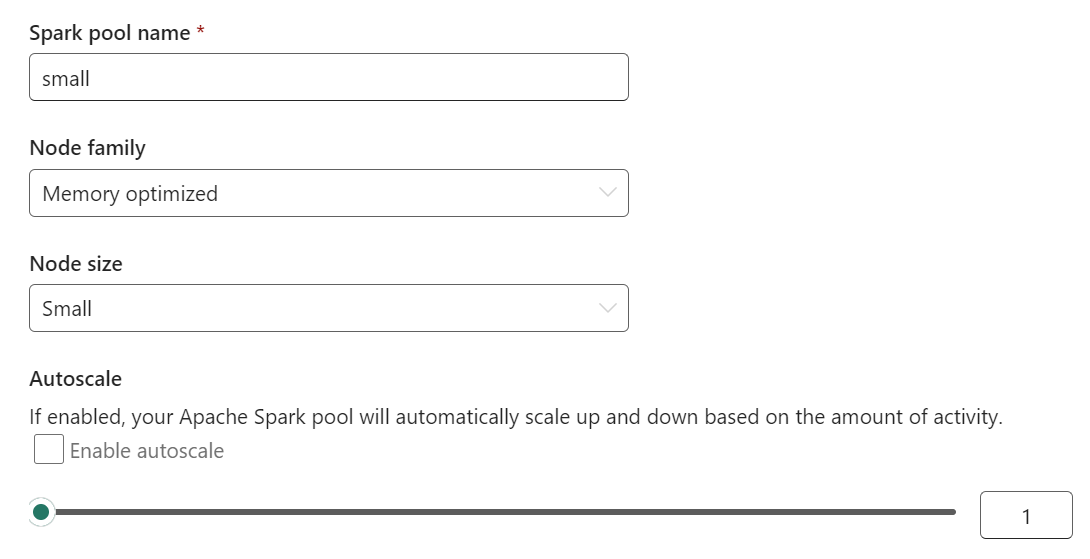
Fabric Notebook as an ingestion tool

To reduce compute usage, we used Spark notebook with the smallest compute, 4 cores and 32 GB of RAM

How to simulate concurrency 

This one is tricky, 10 users does not mean, they will all open the same report at the same time and continuously clicking refresh, I know there are tools to test load PowerBI but you needs to install Powershell and stuff, I just simulated by using a dynamic slicer and running multiple copies of the report concurrently.
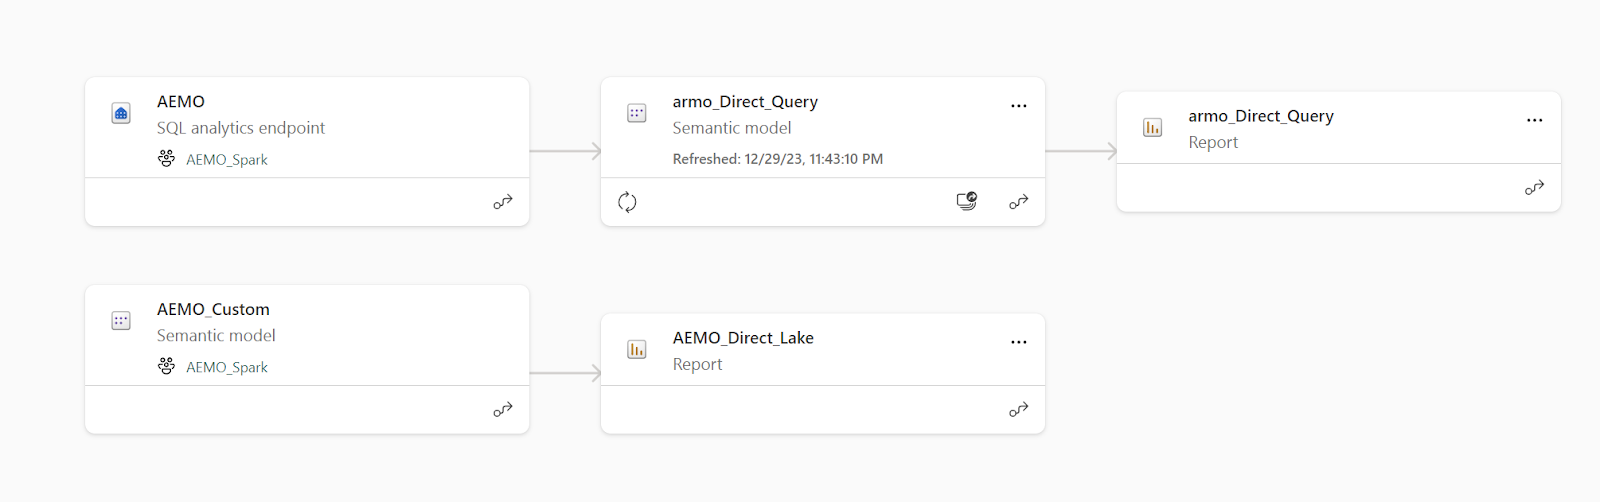
Two Workspaces

we will  try to keep it as simple as possible, no medallion architecture here, just two workspaces

Backend Workspace    : using an F2 capacity

Front End Workspace  : old school pro license workspace

Direct Lake Mode vs Direct Query vs Import in Fabric

As an oversimplification and specially for People not familiar with microsoft BI stack, PowerBI Engine is called analysis Service and it does basically two thing

Formula Engine : Translate DAX using the semantic model to SQL

Storage Engine : get the data from storage using SQL

Direct Query mode :  The data is served by a DB like Synapse or BigQuery, SQL Server etc

Direct Lake mode    : The Data is served by Vertipaq, the data format is open source

Import  mode           : The Data is served by Vertipaq, the data format is proprietary 

Note that Import and Direct Lake difference is in the storageformat, but the In-Memory format is the same ( that’s a very clever design decision)

Vertipaq will always be the Fastest Engine 

 Vertipaq is designed for one  thing, pure speed, so I don’t have any expectation that other Engines can compete with it, we are talking milliseconds even with joins and multiple tables,  I am more interested in resource usage though 

Resource Usage Profile

Direct Lake (interactive tasks are smoothed over a short period of time)

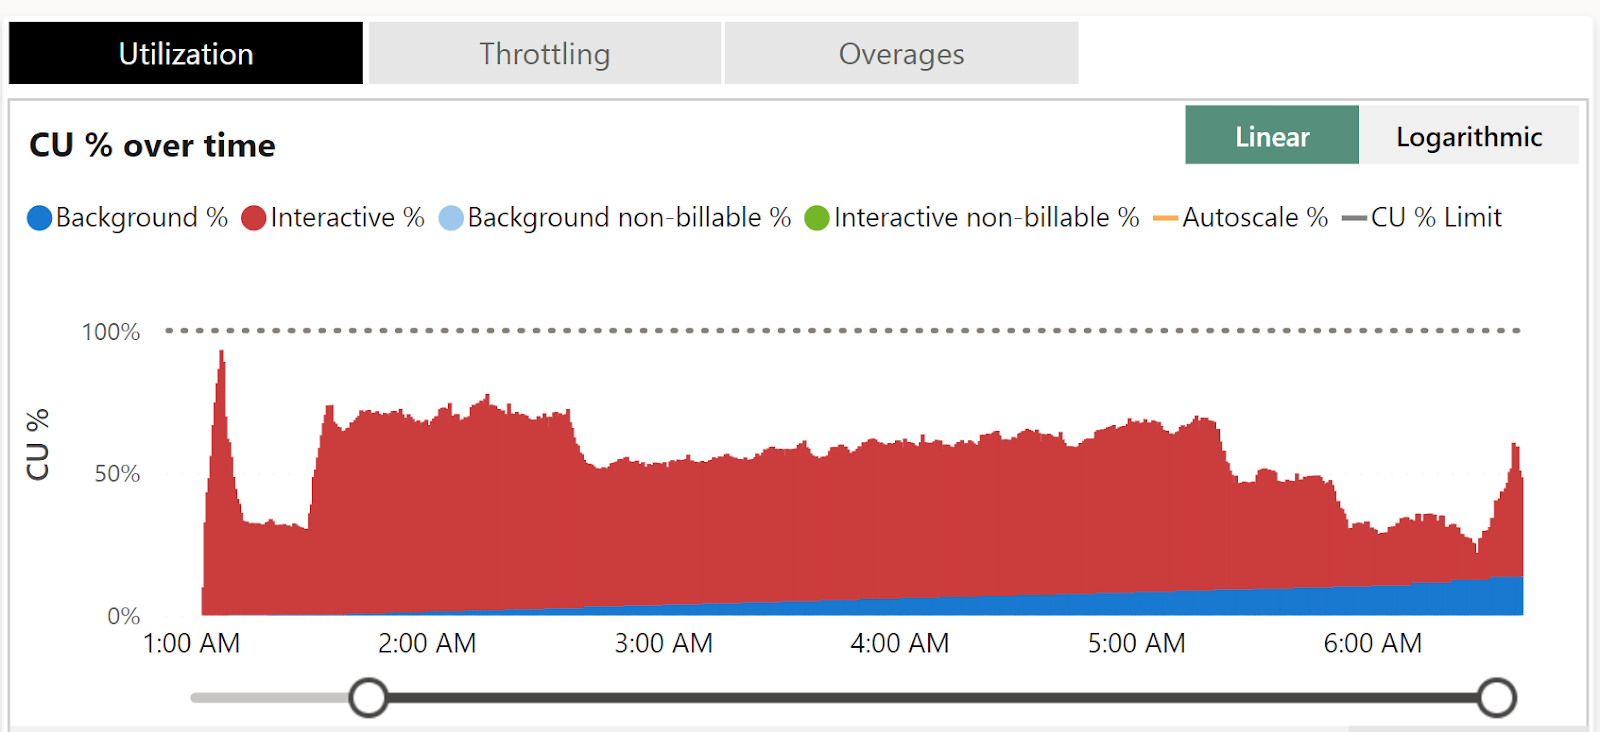
Direct Query with Fabric SQL (Background are smoothed over 24 hours)

To be fair both modes worked as expected, Direct Lake is definitely faster which is expected but what got my attention is the DWH did well and drained the capacity with only a rate of  2 CU/s,  there is no bursting, it is the baseline performance here, that’s extremely encouraging as one of the biggest complaint about cloud DWH is they don’t scale down very well.

Keep in mind in both cases, the total capacity you can consume in 24 hours is still limited by

 24 X 2 CU =  172,800 CU(s).

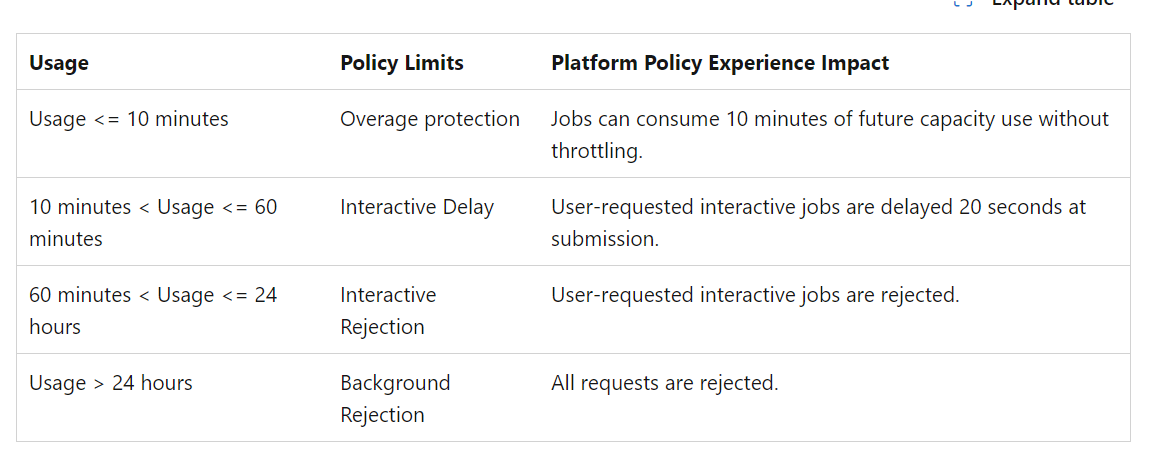
Having a look at this documentation as it is important to understand how to properly size your capacity

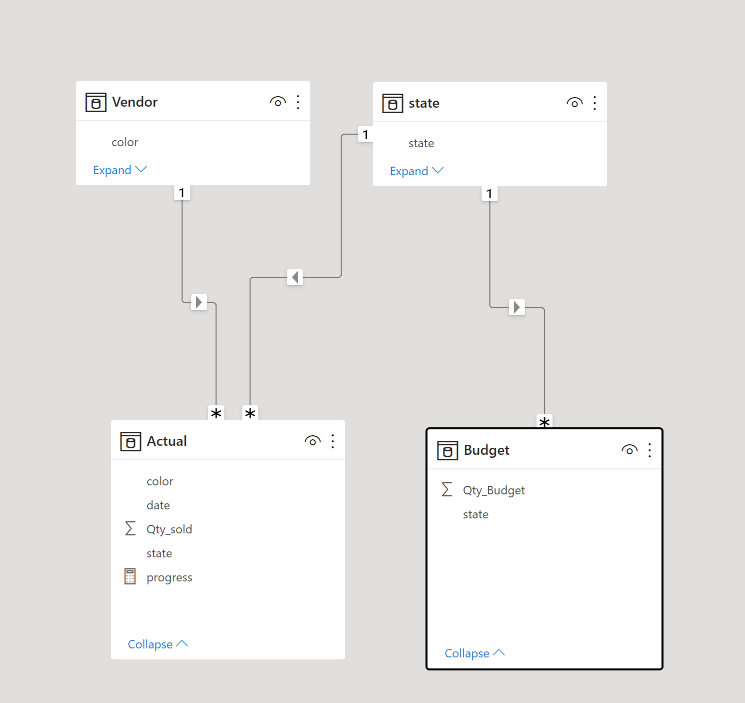
PowerBI is still very chatty

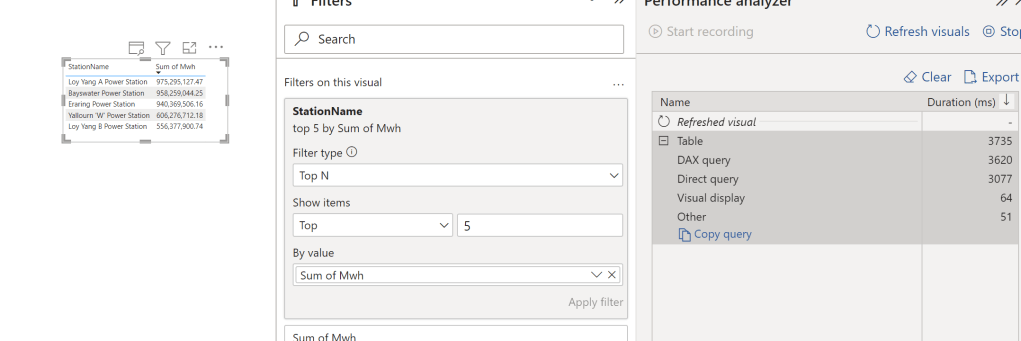
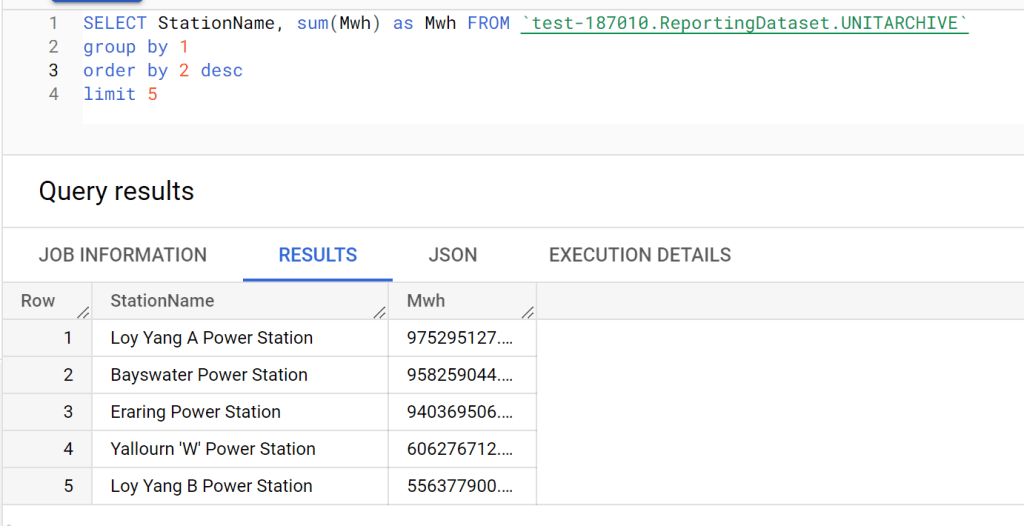
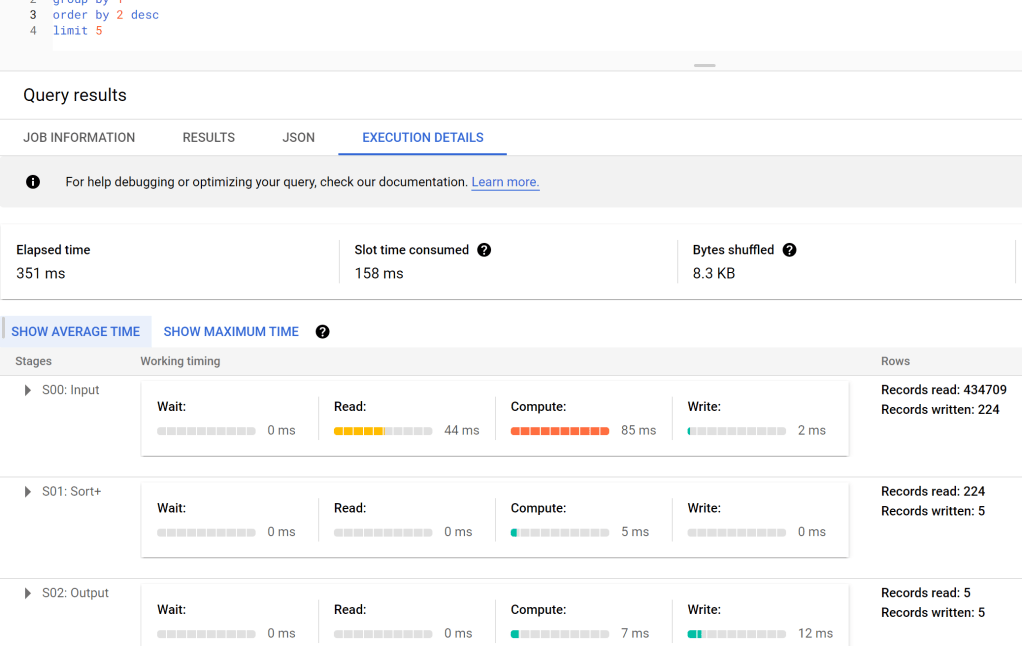
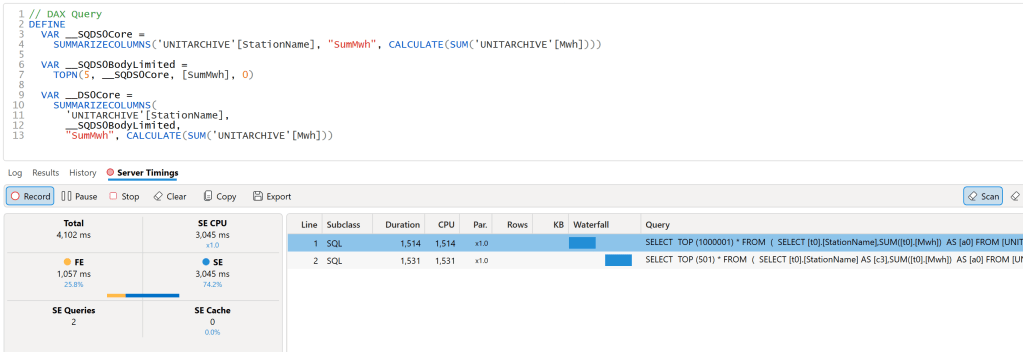
PowerBI does generate a lot of SQL Queries in Direct Query mode, most of it took between 500 ms to 1 second. that’s not bad for a SQL Engine that cost 0.36 $/Hour

Ok what does this all mean ?

I reserve the right to change my view after further testing, but my hypothesis is, given that the DWH has a very good performance but more importantly very efficient engine at lower scale and with the fact it is considered a background operation, Direct Query maybe an interesting option if you need more than 8 refresh per day and you are using PowerBI Pro license with a small scale F SKU.

But as always test using your own data.

PowerBI Query plan when using Top N filter

The October release of PowerBI Desktop introduced a very interesting feature, Top N filtered is pushed down for Direct Query Sources, I thought I may give it a try and blog about it, for some reason it did not work, which is great for the purpose of this blog as if you came from a SQL Background you will be surprised how PowerBI DAX Engine Works.

let’s try with one table in BigQuery as an example, and ask this Question, what’s the top 5 Substation by Electricity produced, in PowerBI, it is a trivial exercise, just use the Top N filter

First Observation, 3.7 Second seems rather Slow, BigQuery or any Columnar Database should return the results way faster, specially that we are grouping by low cardinality columns ( around 250 distinct values)

Let’s try SQL Query in BigQuery Console

And let’s check the duration, 351 ms, the table has 91 Million records, that’s not bad at all, but we need to account for the data transfer latency to my laptop, still that does not explain the difference in duration !!!

DAX Engine Query Plan

let’s have a look at the Query Plan generated by DAX Engine using the excellent free tool, DAX Studio

That’s very strange, 2 SQL Query and 1 Second spent by the Formula Engine, and the two SQL Queries are not even in parallel

Looking at the SQL Queries, I think this is the logic of the Query Plan

  • Send a SQL Query to get the list of all the substation and the sum of of MWH.
  • Order the result using the Formula Engine and select 5 substation.
  • Send another SQL Query with a filter of those 5 substation

Probably you are wondering why this convoluted Query Plan, Surely DAX Engine can just send 1 SQL Query to get the results, why the two trips to the source system, which make the whole experience slow.

Vertipaq Don’t support Sort Operator

Vertipaq which is the internal storage engine of PowerBI does not support the sort operator, hence the previous Query do make sense if your Storage engine don’t support sort.

But My Source do support Sorting ?

That’s the new feature, DAX Engine will generate a different plan when the source system do support sorting.

Great, again , Why Vertipaq don’t support sort Operator ?

No idea, probably only a couple of engineers from Microsoft Know the answer.

Edit : 23 October 2022

Jeffrey Wang ( One of the Original Authors of DAX Engine) was very kind and provided this explanation why the optimization did not kick in for BigQuery

Multi fact support in DAX and Malloy

This is a quick blog showing how the two languages behave when dealing with multiple fact tables.

let’s start with a simple Model, Two Tables Budget and Actual storing items sold by country and color

Budget

Actual

For example we want to ask, how many items were sold by continent, we don’t have this information, we need a dimension table that map state to continent.

DAX

And the Data Model will look like this.

To get the results, we write this DAX Query in DAX Studio ( Btw, the new version 3 is very slick !!!)

DAX will generate two SQL Query to get the results from the two tables and merge the results, using the internal “Formula” Engine

Malloy

in Malloy we do the same by writing code, you can download the Data Model here

In DAX we use summarize columns to aggregate measures from different tables, as far as I can tell, Malloy don’t support this model yet, The tables Budget and Actual are independent, basically you need to manually join the two Queries generated from the two tables.

Query: Budget_by_state is Budget -> {
  aggregate:_Budget
  group_by : dim_state.state
}

Query: Actual_by_state is Actual ->{
  aggregate:Quantity
  group_by : dim_state.state
}
query: merge_results is from_sql(state_source_) {
   join_one: q2 is from(->Budget_by_state ) with state
   join_one: q3 is from(->Actual_by_state) with state
} ->{
  
  group_by : continent
  aggregate: QTY_Budget is sum(q2._Budget),QTY_Sold is sum(q3.Quantity)
}

And we get the same results, Malloy always generate one SQL Query, as there is no way to merge the results internally, as a matter of fact the only “calculation” engine is the SQL Database, which is in this particular case DuckDB.

Obviously you can always create new source by using state as a base table, but I don’t think it is a sustainable solution, as the whole point is to have One model that answers a lot of different Questions.

Take Away

Native support to multiple tables is obviously not unique to DAX, thoughtspot TML support it out of the Box, I hope Malloy developers consider this common scenario for future development.

Expanded Table Behavior in DAX and Malloy

Expanded tables are a core concept in DAX, Malloy has something similar although with a default behavior:).

To see the difference let’s build the same Model in DAX and Malloy and see where it is the same and where it differ.

The Model is based on TPC-H Dataset, it is a simple model as it contains only 1 Base Table ” Lineitem”

The Same Model using Malloy

you can download the Malloy here : it is just a text file

Count the Number of customers

Malloy : results 999 982

Query: custoners_bought_something is {  
    aggregate: cnt is count( distinct customer.C_CUSTKEY)
                 }

DAX : 1 500 000

I know the table contains 1.5 M, so why Malloy is giving me wrong results, it turn out , it is by design, Malloy consider only the customers that bought something in lineitem, you can see it from the SQL Generated

DAX by default ignore the “graph” if the measure target only 1 table, to get the number of customers who bought an item, you need something like this

Take away

Maybe I am biased but I think DAX behavior make more sense, if I target only a table then the graph should be ignored, I think the relationship should be used only when I use fields from different tables.