Edit 18 May 2022: Microsoft released Datamart which has excellent performance for this type of Workload.
Another blog on my favorite topic, interactive Live BI Workload with low latency and high concurrency, but this time, hopefully with numbers to compare.
I tested only the Databases that I am familiar with, BigQuery, Snowflake, Databricks , SingleStore , PowerBI Datamart and DuckDB
TPC-H
The most widely used Benchmark to test BI workload is TPC-DS and TPC-H produced by the independent Organization TPC, unfortunately most of the available benchmark are for big dataset starting from 1 TB, as I said before I more interested in smaller Workload for a simple reason, after nearly 5 years of doing Business intelligence for different companies, most of the data model are really small, ( my biggest was 70 Million rows with 4 small dimension tables).
Benchmarking is a very complex process, and I am not claiming that my results are correct, all I wanted to know as a user is an order of magnitude and a benchmark can give you a high level impression of a database performance.
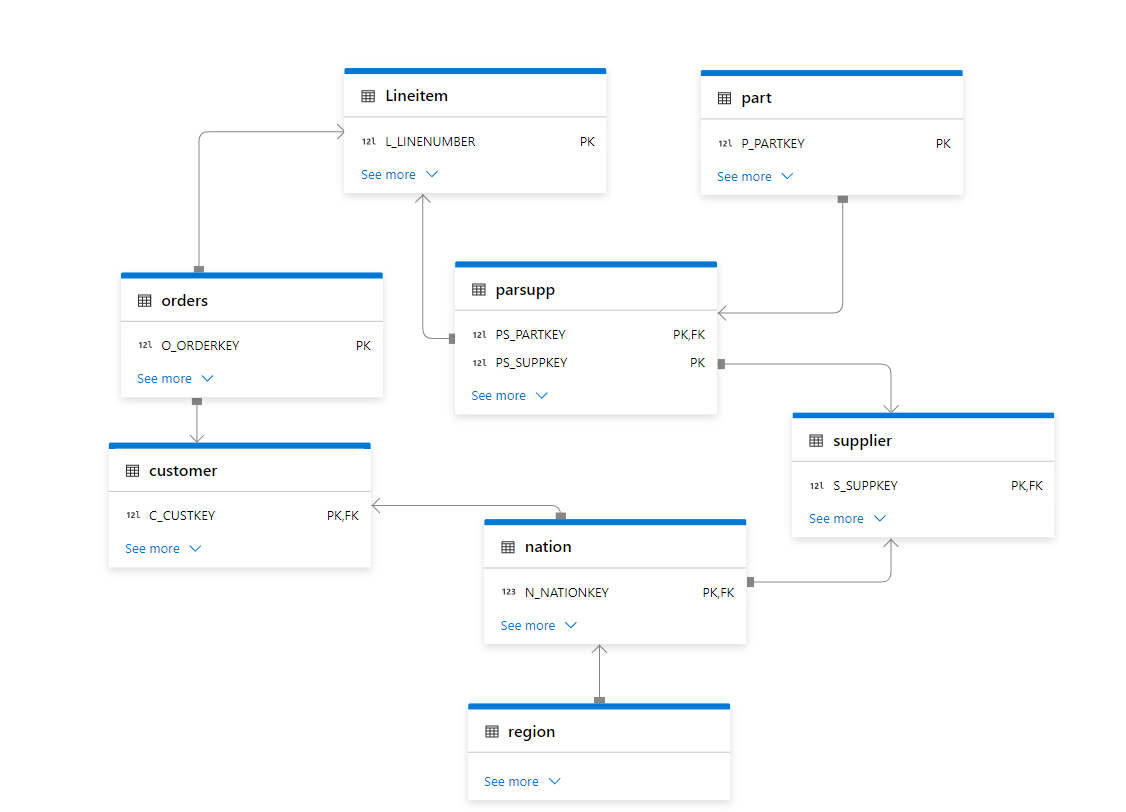
Schema
I Like TPC-H as it has a simpler schema 8 tables and only 22 Queries compared to TPC-DS which require 99 Queries.
Some Considerations
- Result Cache is not counted.
- The results are using warm cache and at least one cold run, I run the 22 Queries multiple times.
- Databricks by default provide a sample Database TPC-SF05, the main Table Lineitem is 30 Millions rows,
I don’t know enough to import the data and apply the proper sorting etc , so I preferred to use the smaller dataset. I did create a local copy by using create table as select( Loaded SF10 Data) - Snowflake and SingleStore have SF10 and other scale by default.
- BigQuery, I imported the data from Snowflake , I sorted the tables for better performance, it is a bit odd that BigQuery don’t provide such an important public dataset by default
- Microsoft Datamart no sorting or partitioned was applied , the data was imported from Biguery.
No Results Cache
Most DWH support results cache, basically if you run the same Query and the base tables did not change the Engine will return the same results very quickly, obviously in any benchmark, you need to filter out those queries.
- In Snowflake you can use this statement to turn the results cache off
ALTER SESSION SET USE_CACHED_RESULT = FALSE;
- In Databrick
SET use_cached_result = false
- BigQuery, just add an option in the UI

- SingleStore and Datamart, does not have a result cache per se, the engine just keep a copy of the Query Plan, but it scan The Data every time.
Warm Cache
Snowflake, SingleStore and Databricks leverage the local SSD cache, when you run a Query the first time, it scan the data from the cloud storage which is a slow operation, then when you run it again the Query will try to use the data already copied in the local disk which is substantially faster, specially with Snowflake if you want to keep the local warm cache it make sense to keep your Cluster running a bit longer.
BigQuery is a different beast there is no VM, the data is read straight from the Google Cloud Storage, yes google Cloud Network is famous for being very fast, but I guess it can not compete with a local SSD Disk, anyway that’s why we have BI Engine which basically cache the data in RAM, but not all Queries are supported, actually only 6 are fully accelerated as of this writing. ( see Limitations )
Query History
Getting Query results is very straightforward using information_Schema, except for databricks, it seems it is only supported using an API, I just copied one warm run and paste it to excel and load it from there.
Engine Used
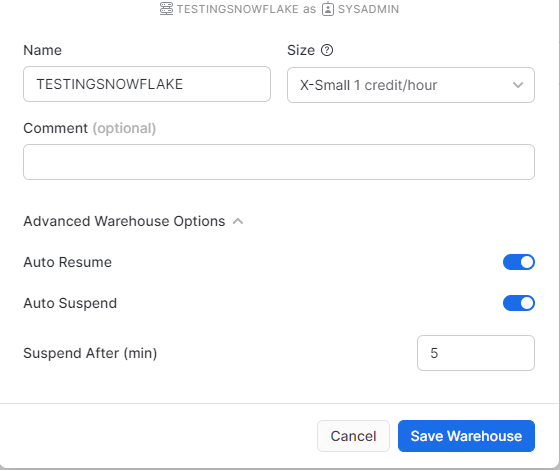
- Snowflake : X-Small (Lowest tier)
- Databricks : 2X-Small (Lowest tier)
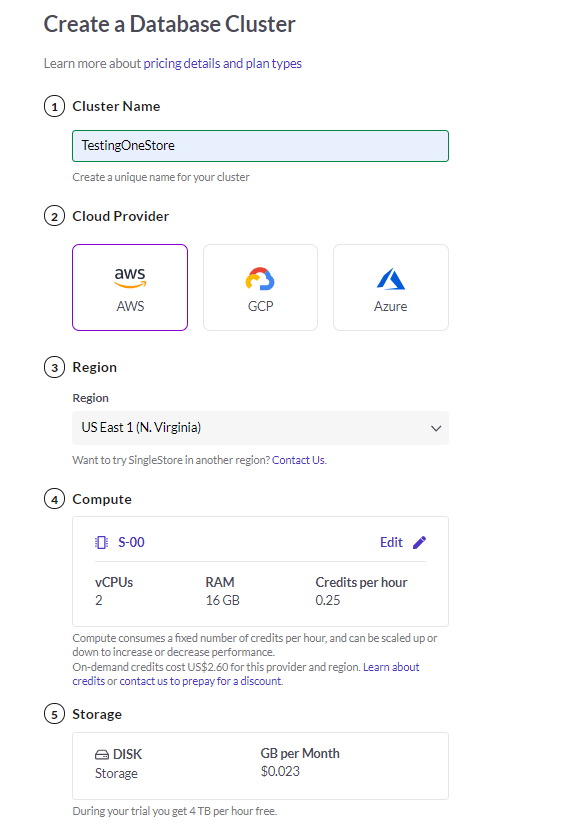
- Single Store : S-0
- BigQuery : on Demand + 1 GB Reservation of BI Engine
- Datamart : included with PowerBI Premium, official spec not disclosed.
- DuckDB : my laptop, 16GB RAM 🙂
Results
The 22 Queries are saved in this repo, I am using PowerBI to combine all the results
let’s start with
Snowflake VS BigQuery

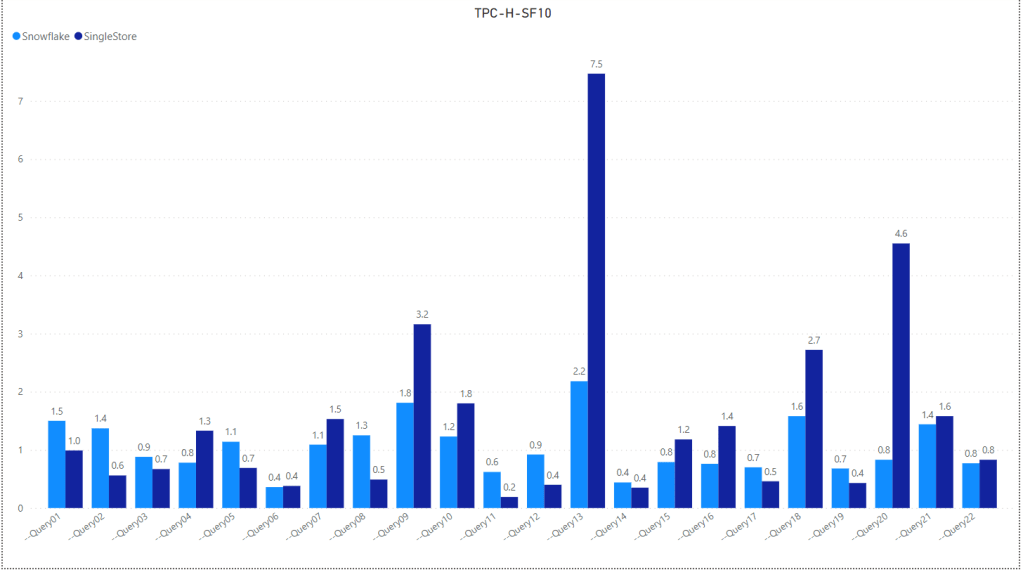
Snowflake Vs SingleStore
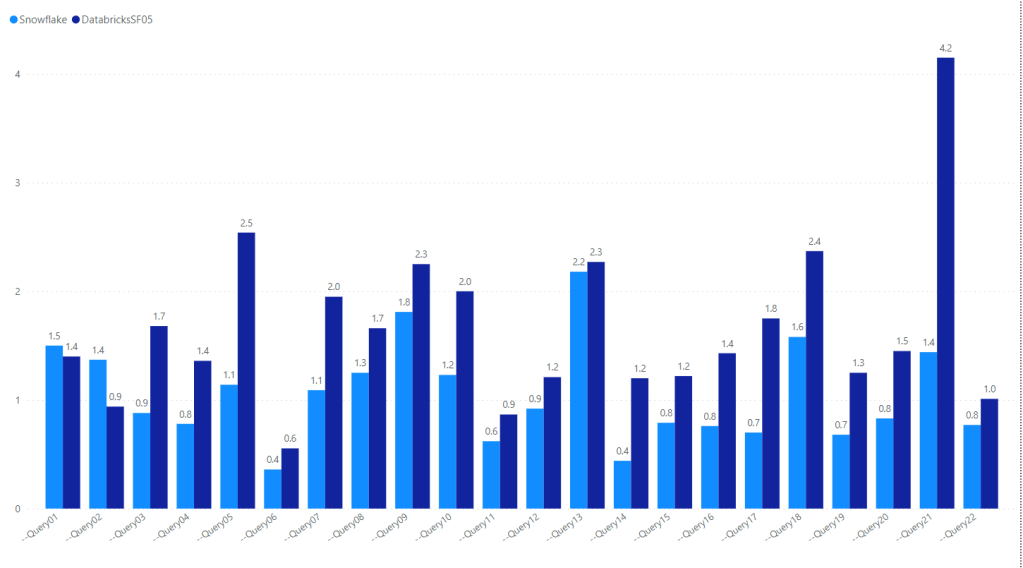
Snowflakes VS Databricks
Notice Databricks is using the smaller Dataset SF05, 30 million rows and still Snowflake show better performance
Overall
Edit : due to feedback, I am adding the sum of all Queries, You can download the results here
Edit : 26-Jan-2022, I Updated the results for Databricks SF10, I Uploaded the same data used for BigQuery, then created Delta Table and applied optimize Z Order

Take away
- Snowflake is very fast and has consistent results for all the 22 Queries, Except Query 13 is a bit odd
- SingleStore is remarkable but Query 13 is not good at all and skew the overall performance.
- BigQuery is fantastic when BI Engine works ( only 11 Queries are supported from the total of 22)
- Databricks performance in TPC-H-SF05 is problematic, I just hope they release a proper TPC-H-SF10 dataset and information schema like other DWH
- Datamart has the best user experience, the only Data Platform where you can load the data without writing any Code,The same as Singlestore; Query 13 has a very Big Cost on the overall performance.
- DuckDB : Query 9 skew the overall performance and probably I need a new laptop 🙂