TL;DR : PowerBI does not support GIS Area calculation, in this blog we use M Parameter to leverage third party Database to do the calculation, Works only In Direct Query Mode.
ink to Public report
With the Update of August 2021, M Parameter support multi value selection, see this Previous blog for a little background, this open some interesting new use cases that was not possible before in PowerBI.
Again, before you get too excited, it works only with Direct Query and Database that support M Parameter ( BigQuery, Snowflake, Azure ADX etc)
One example is calculating the area of a group of arbitrary points
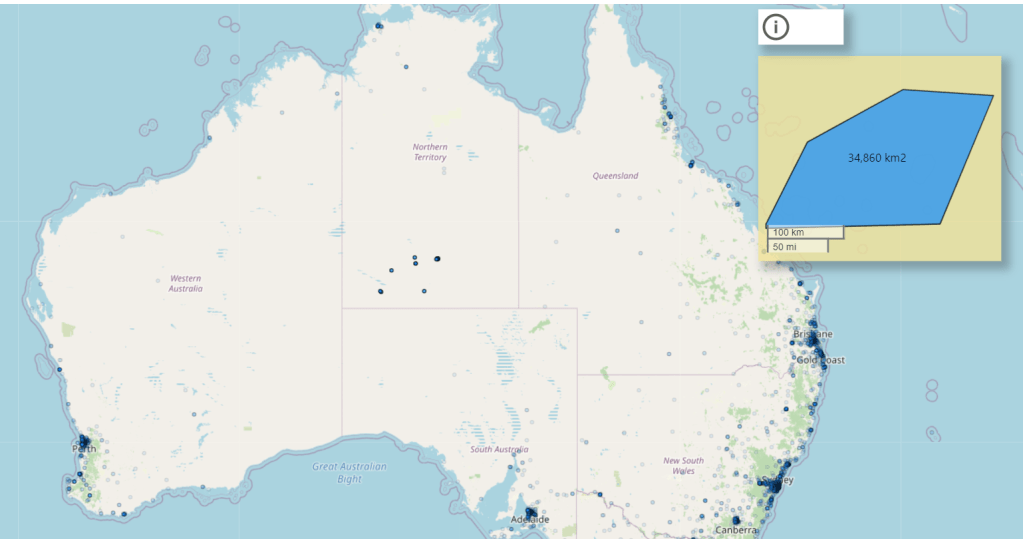
- In Icon Map, I select a group of points (Notice here, Icon map is acting as Parameter Action filter )
- The List of points are used in an M Parameter
- A SQL Query is sent back to the Database that support M Parameter in my case I am using BigQuery
- BigQuery generate a wkt and calculate the area , you can calculate the distance too or any metrics that use geometry
- Plot the results in another Icon Map
The Query is straightforward, and the best part because we are not running a Query against any table in BigQuery , it does not cost anything, you can register here for free and no credit card is required
Here is the M Query
let
TagsList =
    if
    //check to see if the parameter is a list
      Type.Is(
        Value.Type(tag_selection),
        List.Type
      ) then
        //if it is a list
        let
          //add single quotes around each value in the list
          AddSingleQuotes = List.Transform(
              tag_selection,
              each "'" & _ & "'"
            ),
          //then turn it into a comma-delimited list
          DelimitedList = "[" & Text.Combine(
              AddSingleQuotes,
              ","
            ) &"]"

        in
          DelimitedList
    else
      //if the parameter isn't a list
      //just add single quotes around the parameter value
      "['" & tag_selection & "']",

Source = Value.NativeQuery(GoogleBigQuery.Database([BillingProject="xxxxxx"]){[Name="xxxxx"]}[Data], "WITH
  xxx AS (
  SELECT
    *
  FROM
    UNNEST( "& TagsList &" ) AS element),
  yyy AS (
  SELECT
    ST_CONVEXHULL( ST_UNION_AGG(ST_GEOGFROMTEXT(element))) AS geo
  FROM
    xxx)
SELECT
  ST_ASTEXT(geo) AS WKT,
  st_area(geo) AS area
FROM
  yyy", null, [EnableFolding=true])
in
    Source
Future Improvement
One thing I would really like is the possibility to show the result in the same Map, unfortunately to the best of my knowledge a Table in DAX can not filter itself, see this example
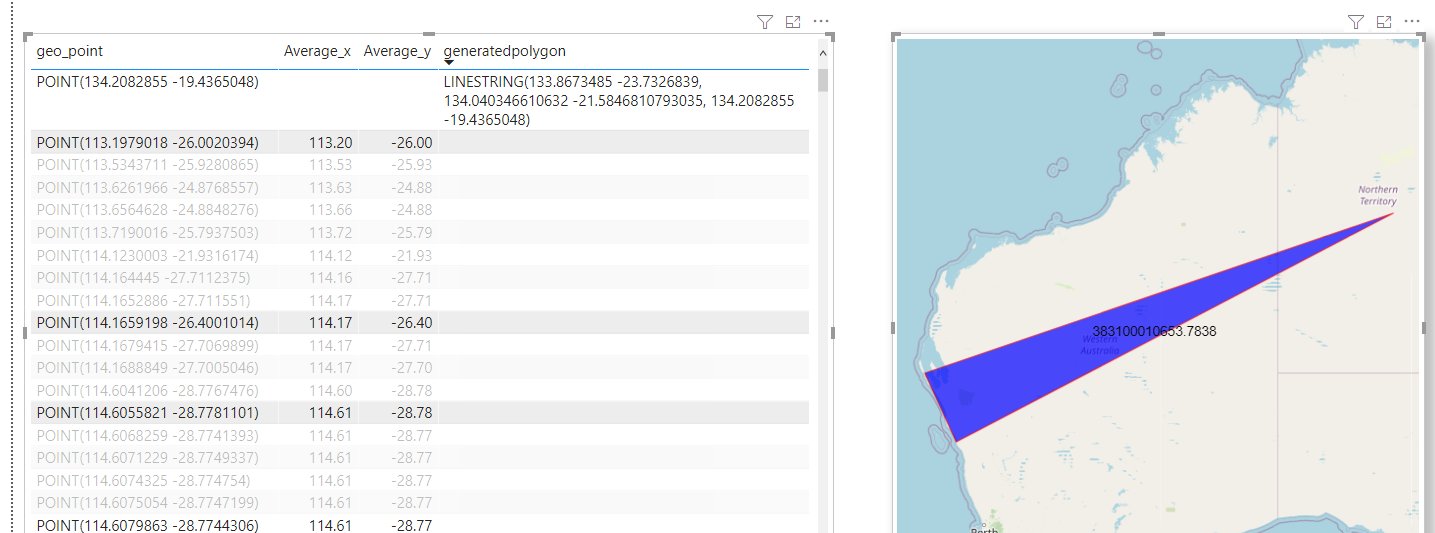
in Icon map it is possible to display wkt and points at the same time , but as you can see from the screenshot wkt geometry in the table does not change based on internal filter selection, the other viz works fine.
M Parameters has a very interesting application, and I am excited to try other tricks 🙂
Edit : I appreciate some votes here for the option to pass filter selection to the same Visual