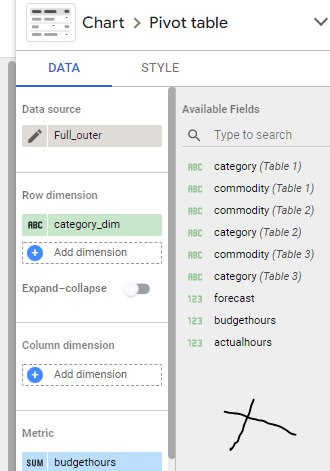
Assume you have multiple Data Source and you can’t build a conformed dimension ( IT people like to used it to sound smart, it simply means common field 🙂 and you want to merge the results using a common field, notice every table contains different values of the same field, and before you get excited, filtering does not work except for Dates
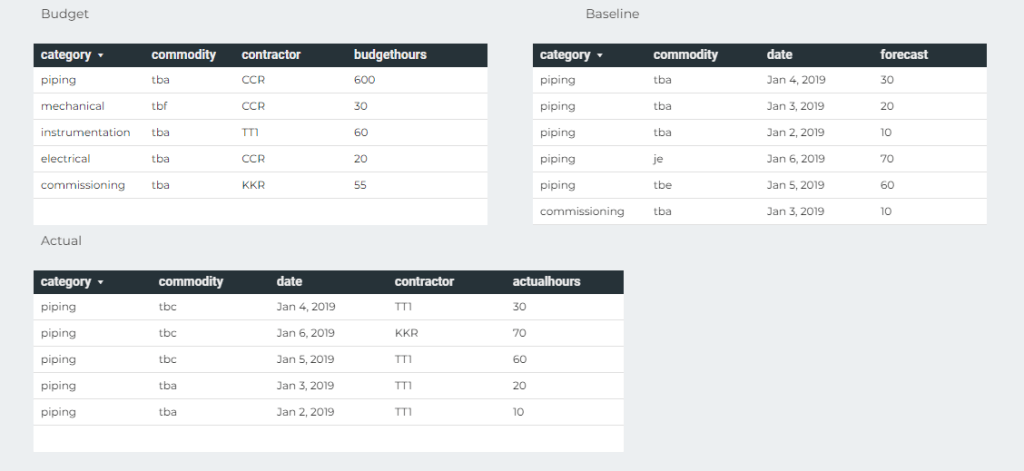
we have three Tables, Budget, Actual and Baseline, the common field is Category and commodity
And you want this Final Results
Notice that the category Civil exist only in forecast, and instrumentation, mechanical, electrical exist only in the Table Budget, how to show the results in the same Visual
Full Outer Join for the win
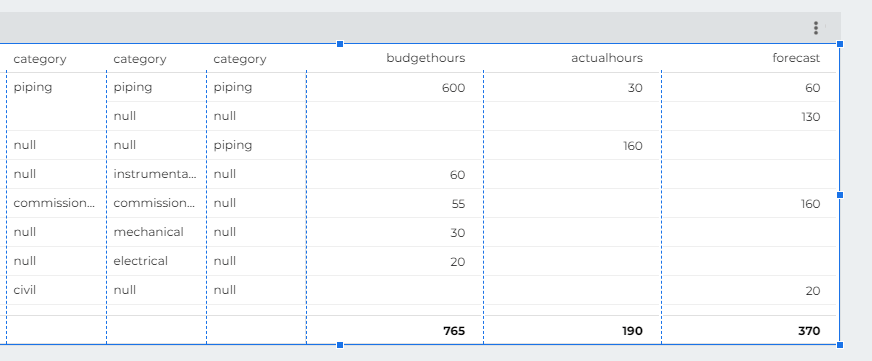
the trick is to join the tables using full joins so not values get dropped
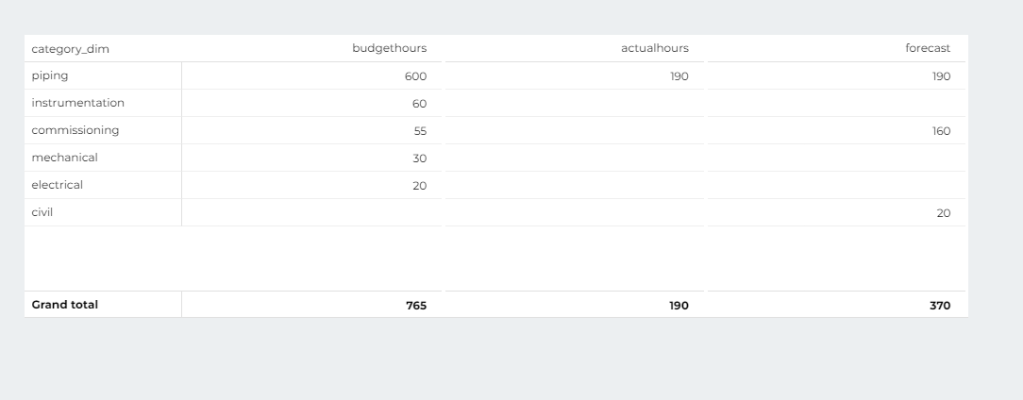
which give you this results
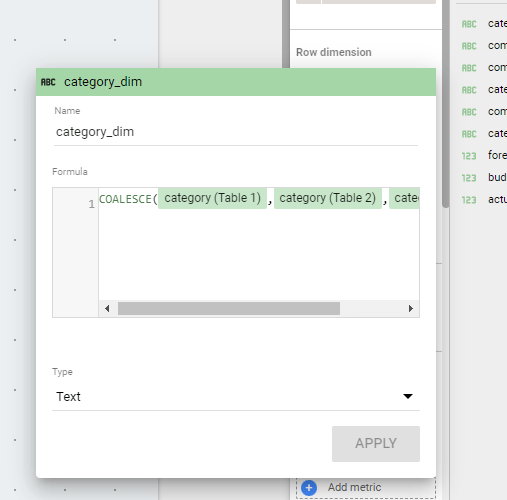
Obviously, you want only 1 column Category not three, too easy just add a column in the table calculation using the function coalesce
unfortunately as of this writing you can’t add a dimension in the results of a blending, it has to be in the Visual, which means, you can’t use that common dimension in filters, which make this approach not very useful to be honest.
I added a link to the report, which contains other approach for the same problem, if you are still reading, it is really unfortunate, Blending is very powerful but it needs constant improvements from the product team
Note : if you are using flat price, nothing to see here 🙂
TL; DR : This blog is about a particular use case, assume a customer is using on demand pricing for BigQuery ( 5 $/ TB scanned) and bought some BI Engine reservation (1 $/1 GB compressed/Day), Currently under heavy load, BI Engine fallback to BigQuery, I think it is a problematic behavior and the customer should have the option.
Add the Queries to a Queue, slower but an order of magnitude cheaper
At least have an option to define the behavior.
The Use Case
Let’s say you have a relatively small table and you expect around 20 concurrent users Querying it, using a Live connection from Tableau or Data Studio.
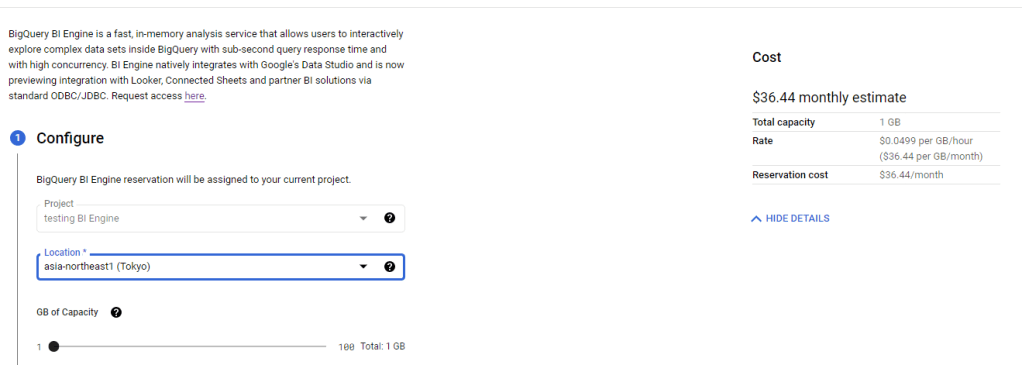
First let’s create 1 GB reservation. ( 36.44 $/Month)
Simulate Query Load
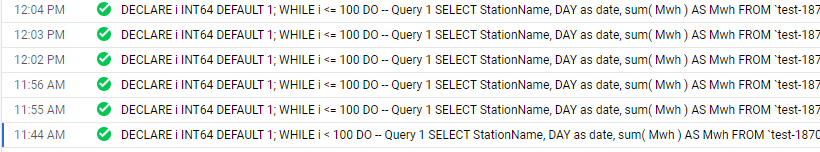
In a previous blog, I got complains that my benchmark is not reproducible, this time, I am using a different Approach, although it is the same base Table ( 74 Million records with new data every 5 minutes) , I am using a SQL Script that run 100 time, every time it generate 5 sequential Queries, and to avoid any cache the date filter is random, something like this
SELECT
    StationName,
    DAY as date,
    sum( Mwh ) AS Mwh
  FROM
    `test-187010.ReportingDataset.Nem_View`
  where DAY >= date_add(DATE "2016-12-25",INTERVAL cast(floor(rand()*100)+1 as INT64) DAY)
  GROUP BY
    1,
    2
  ORDER BY
    date ASC
    Limit 1000
The data is public you can test it yourself, notice it is saved in Tokyo Region, BI Engine should be in the same Region.
The test Load is simple, run the first script and then slowly increasing the number of script running in parallel, the idea is to simulate an increase in concurrency
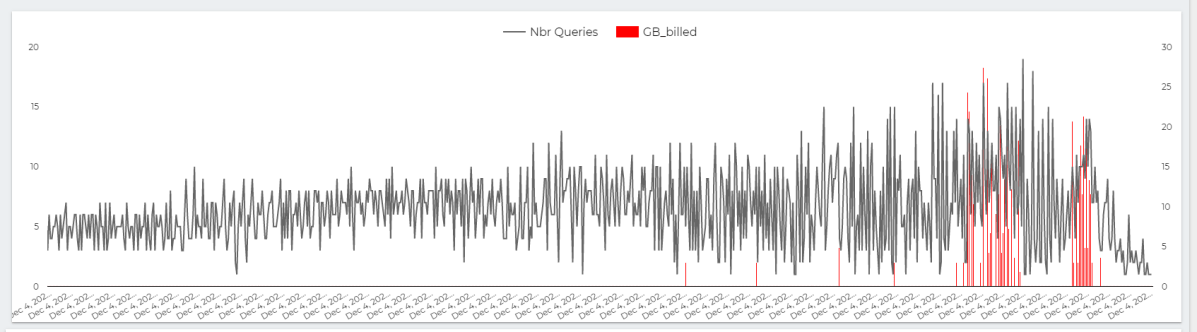
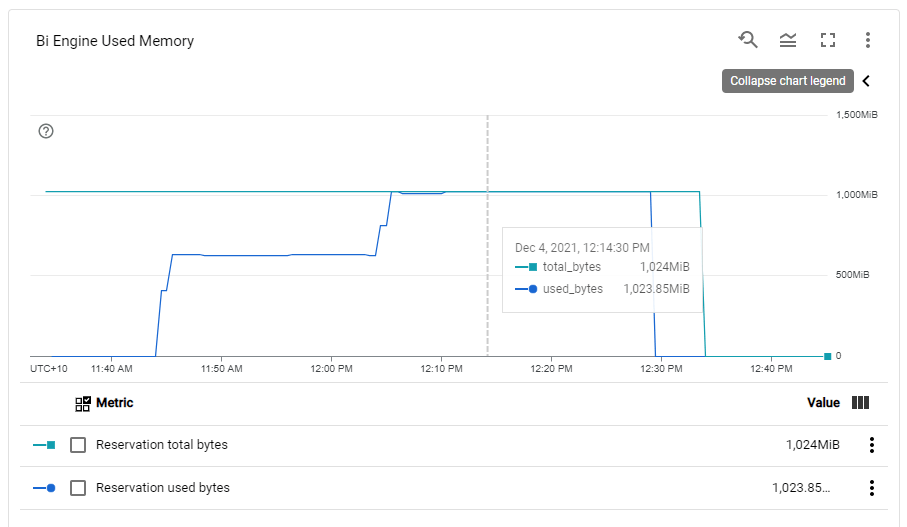
BI Engine consume more memory when the load increase, Very Nice 🙂
This chart show the number of Queries per second , The Red Line is GB Billed, The red Line is something that worry me a lot.
The whole value proposition of BI engine is the cost, yes it is fast and all but as far as I am concerned, it make Interactive Live BI workload very cost effective, on demanding Pricing is useful for ETL workload, not serving Queries.
Note : you can’t use BI Engine for transformation, saving Query results to a permanent table is not supported.
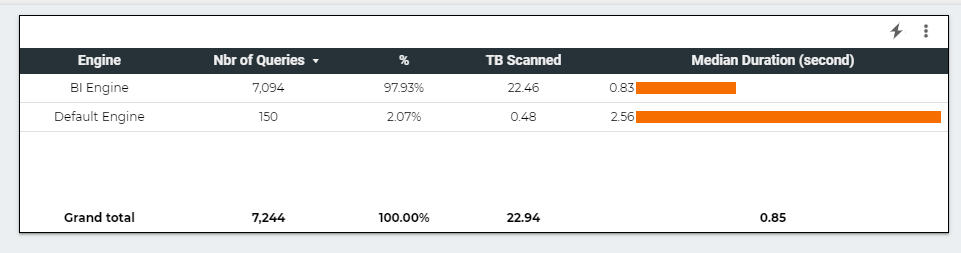
Here is The Workload Breakdown.
let’s admit the obvious here, BI Engine scanned 22 TB of data in less than an Hour for the cost of 5 cents, it handled the load gracefully, till we start getting 17 concurrent Queries ( your mileage will vary based on the query complexity, volume of data etc etc )
but when BI Engine got overloaded with Queries, it fall back to BigQuery on demanding pricing which in no time consumed the daily Quota ( 500 GB) for a cost of 2.5 $. ( always set up a quota per day)
The Math is very simple, 22 TB for 5 cents versus 0.5 TB for 2.5 $
What‘s the solution
I really would like that BigQuery behavior change, if BI engine is overload, just added the Queries to a Queue to slow down things, or at least make this behavior optional, let the customer decide, if we need more concurrency we can by more memory, but don’t make the decision on our behalf.
PowerBI Vertipaq, which is in the same tech category, handle it differently, if you reach a limit, the Engine will simply throttle the Queries, I think BI Engine should behave the same 🙂
Takeway
For the Previous workload, and to support high level concurrency, and keep a Low cost, the Reserved memory Should be 2 GB, The Good news, the Product Team is working on Auto Scaling, No ETA though.
was talking to someone I know on twitter, and got this cryptic reply
I have a vague idea of how to nest two tables, specially Header/Details, it is very easy to conceptualize but I never really understood Json format or how to get multiple levels.
Building a Nested Table
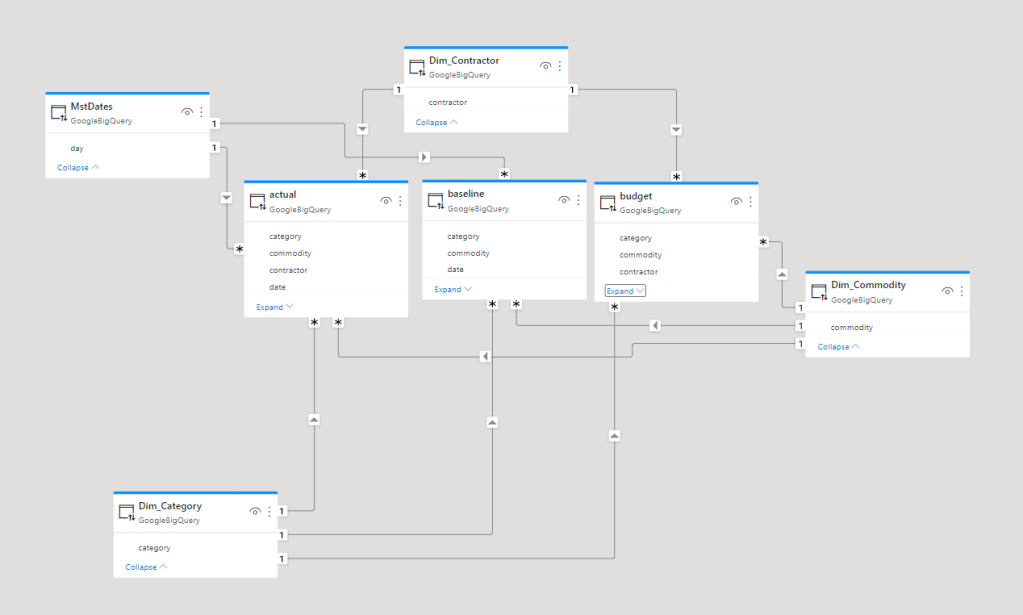
Just for fun I tried to convert this Data Model, a typical Multi fact Star Schema ( apparently it is called galaxy Schema)
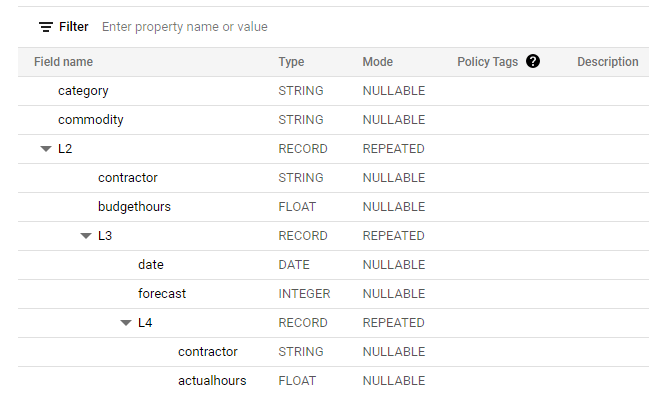
I am not going to share the SQL Query that converted those 3 facts Table to 1 Nested Table ( because it is probably horrible), it took me some time to get a mental image how to stack the common dimensions first, and started nesting the common values at lower level, anyway I end up with this schema
A recent interesting development, Looker out of nowhere introduced a New Open Source Analytics Language called “Malloy” , and it has a first class support for nested Data, see example here
It is just a fun exercise, BigQuery support Star Schema just fine, but according to people who work with Big Data, let’s say 2 billion rows and such, not doing join is extremely Faster and cheaper, and apparently it is easier to transfer Data, after all moving one Table is easier than moving three.
Now even if all what you do is Star Schema, it is fruitful to learn other approaches, turn out Json format is useful aft all 🙂
I was reading this blog post and thought of a new use case, using OpenstreetMap Data and generate polygons based on the user Selection
First to reduce cost, we will select only all a subset of OpenstreetMap Data, you can use this post as a reference
my base table is OPENSTREETMAPAUSTRALIAPOINTS , which contains 614,111 rows
The idea is to provide some tag selection ( School, cafe etc) and let BigQuery generate a new polygons on the fly, the key function in this SQL script is ST_CLUSTERDBSCAN
WITH
  z AS (
  SELECT
    *
  FROM
    `test-187010.GIS.OPENSTREETMAPAUSTRALIAPOINTS`
  WHERE
    value IN UNNEST(@tags_selection)),
  points AS (
  SELECT
    st_geogpoint(x,
      y) AS geo_point,
    value AS type
  FROM
    z ),
  points_clustered AS (
  SELECT
    geo_point,
    type,
    st_clusterdbscan(geo_point,
      200,
      @ct) OVER() AS cluster_num
  FROM
    points),
  selection AS (
  SELECT
    cluster_num AS spot,
    COUNT(DISTINCT(type))
  FROM
    points_clustered
  WHERE
    cluster_num IS NOT NULL
  GROUP BY
    1
  HAVING
    COUNT(DISTINCT(type))>=@ct
  ORDER BY
    cluster_num)
SELECT
  spot AS Cluster,
  st_convexhull(st_union_agg(geo_point)) as geo_point,
  "Cluster" as type
FROM
  selection
LEFT JOIN
  points_clustered
ON
  selection.spot=points_clustered.cluster_num
  group by 1
union all
SELECT
  spot AS Cluster,
  geo_point ,
type
FROM
  selection
LEFT JOIN
  points_clustered
ON
  selection.spot=points_clustered.cluster_num
Technically you can hardcode the values for Tags, but the whole point is to have a dynamic selection
I am using Data Studio and because the Query is not accelerated by BI Engine , and in order to reduce the cost, I made only 6 Tags available for user selection and hard code the distance between two points to 200 m.
Here is an example when selecting the tags (restaurant, school and fuel), I get 136 cluster
here when I zoom on 1 location, the result are pretty accurate
I think it is a good use case for parameters, GIS calculation are extremely heavy and sometimes all you need from a BI tool is to send Parameter values to a Database and get back the result.