This is a quick blog showing how the two languages behave when dealing with multiple fact tables.
let’s start with a simple Model, Two Tables Budget and Actual storing items sold by country and color
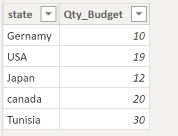
Budget
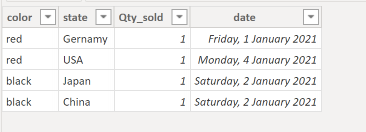
Actual
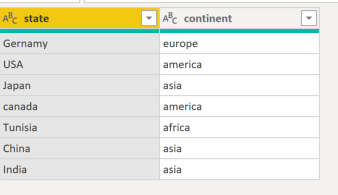
For example we want to ask, how many items were sold by continent, we don’t have this information, we need a dimension table that map state to continent.
DAX
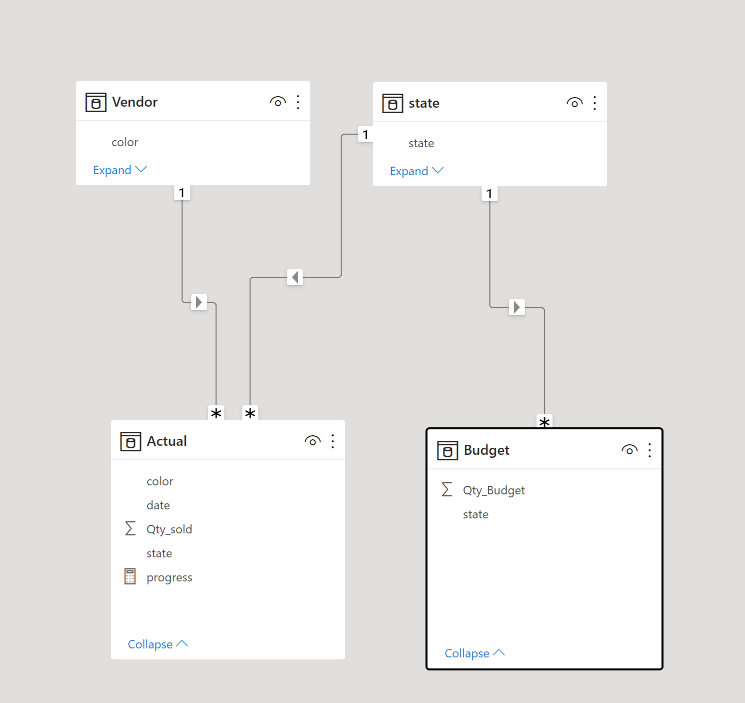
And the Data Model will look like this.
To get the results, we write this DAX Query in DAX Studio ( Btw, the new version 3 is very slick !!!)
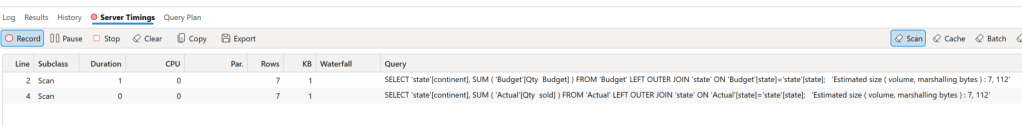
DAX will generate two SQL Query to get the results from the two tables and merge the results, using the internal “Formula” Engine
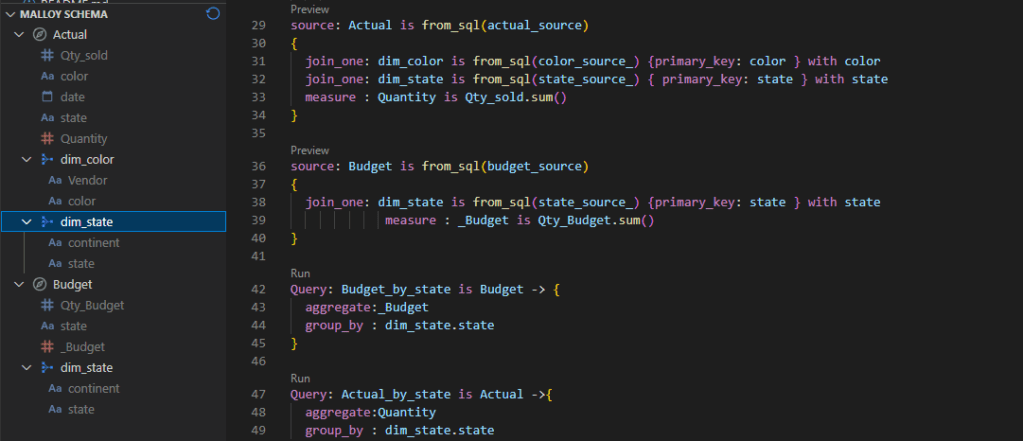
In DAX we use summarize columns to aggregate measures from different tables, as far as I can tell, Malloy don’t support this model yet, The tables Budget and Actual are independent, basically you need to manually join the two Queries generated from the two tables.
Query: Budget_by_state is Budget -> {
aggregate:_Budget
group_by : dim_state.state
}
Query: Actual_by_state is Actual ->{
aggregate:Quantity
group_by : dim_state.state
}
query: merge_results is from_sql(state_source_) {
join_one: q2 is from(->Budget_by_state ) with state
join_one: q3 is from(->Actual_by_state) with state
} ->{
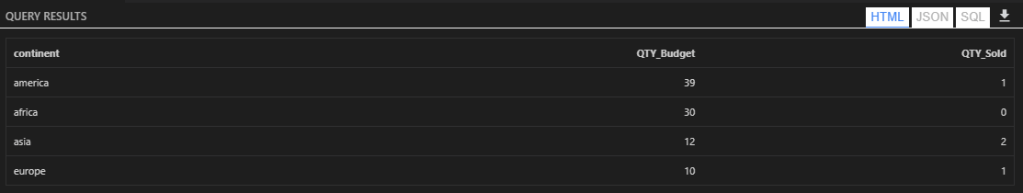
group_by : continent
aggregate: QTY_Budget is sum(q2._Budget),QTY_Sold is sum(q3.Quantity)
}
And we get the same results, Malloy always generate one SQL Query, as there is no way to merge the results internally, as a matter of fact the only “calculation” engine is the SQL Database, which is in this particular case DuckDB.
Obviously you can always create new source by using state as a base table, but I don’t think it is a sustainable solution, as the whole point is to have One model that answers a lot of different Questions.
Take Away
Native support to multiple tables is obviously not unique to DAX, thoughtspot TML support it out of the Box, I hope Malloy developers consider this common scenario for future development.
Edit : this blog generated some strong feedback, This is not a benchmark of Vertipaq, but rather me arguing that it is indeed possible to have a good enough OLAP SQL Engine that read from disk instead of RAM ?
Vertipaq is the columnar Database used In PowerBI, Excel and Analysis service, it is an extremely fast DB and I have being using it since 2015 without really understanding how it works, it is just there giving back results in sub second, the only time I got performance issue was when I wrote terribly bad DAX.
Just for fun and hopefully we may even learn something useful, I run a couple of simple SQL Queries in DuckDB and replicate them in PowerBI desktop and see how the two system behave,Unfortunately Vertipaq don’t expose a fully functional SQL Endpoint, so you can’t simply run a typical SQL benchmark.
Setup
All test were done using my laptop ( a Dell with 16 GB of RAM), the data is TPCH-SF10, 60 million of rows for the base table, I had to add a PK for PowerBI as it does not support join on multiple fields, you can download the raw Data here
For PowerBI, I use DAX Studio with cache turned off.
Loading Data
DuckDB support multiple mode, you can just run Queries directly on parquet files, you can load the data to memory using temp tables or you can import the data using DuckDB storage format, for performance reason I import the data, DuckDB don’t support compression very well yet, and consider the storage format as a work in progress, Index currently are not compressed and take a lot of space, without index, the size is around 3.6 GB
Parquet : 2.9 GB
DuckDB storage file format : 17 GB
Vertipaq : 3.9 GB
Notice here, DuckDB is reading from disk to run Queries, if does filter pushdown and scan only column used in Queries, Vertipaq has to load the whole database into memory before you can run any Queries, as far as I can tell this is the most important difference between the two systems and has a massive implication, both positive and negative.
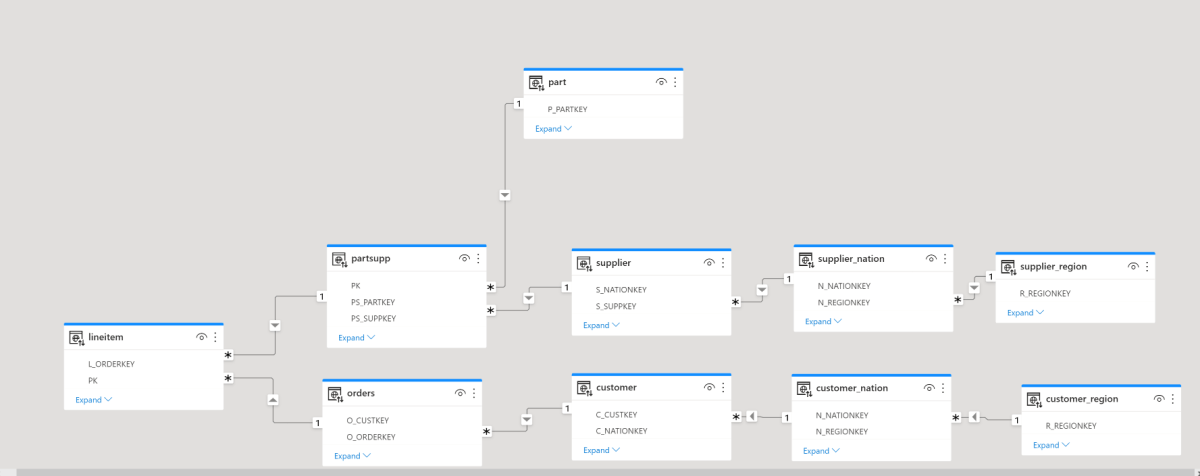
Data Model
I am using the same Data Model as the previous blog, it is a nice bad Model for testing 🙂
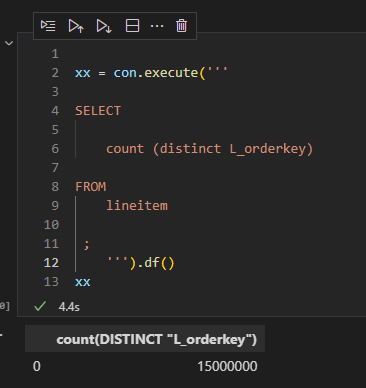
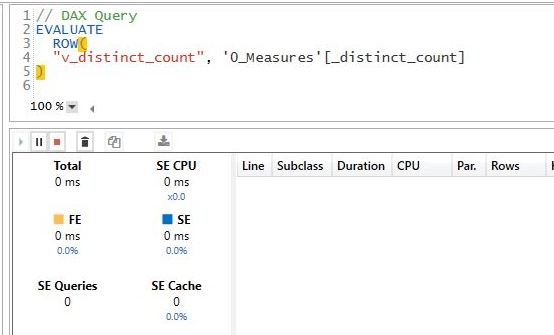
1- Simple Count Distinct
DuckDB : 4.4 S
Vertipaq : 0 S
For vertipaq it is a metadata Query, the distinct count for a whole column is created when you import the data, DuckDB don’t save that particular statistic.
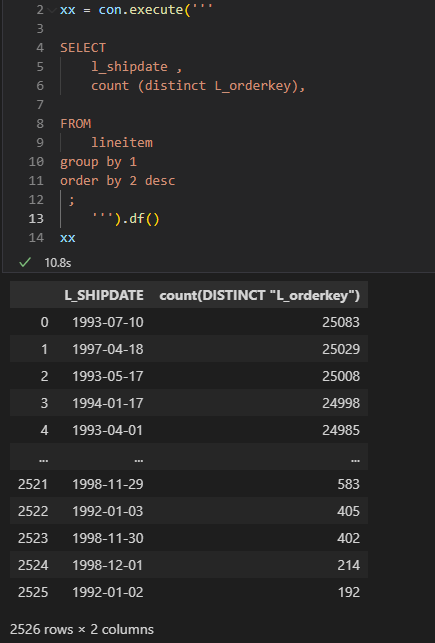
2- Count Distinct group by low Cardinality
low cardinality simply means column with small number of unique values.
DuckDB : 10.8 S
Vertipaq : 7.1 S
3- Count Distinct group by high Cardinality
now count the distinct values but grouping by a column L_comments which contains 33 Million unique values
DuckDB : 49 S
Vertipaq : 29 S
4 – Sum group by low Cardinality
This one is using the Famous Query 1 of TPCH Benchmark
DuckDB : 0.7 S
Vertipaq : 0.3 S
5 – Sum group by high Cardinality
DuckDB : 2.7 S
Vertipaq : 17 S
6 – Aggregate using complex relationship but group by Low cardinality
The performance of Vertipaq keep surprising me, it is using some kind of index on joins, I don’t know really how it works, but the performance is impressive
DuckDB : 4.9 S
Vertipaq : 0.9 S
7 – Aggregate using complex relationship but group by High cardinality
DuckDB : 8.4 S
Vertipaq : 5.1 S
I was surprised by this results, it seems when you group by high cardinality column it will impact Vetipaq performance.
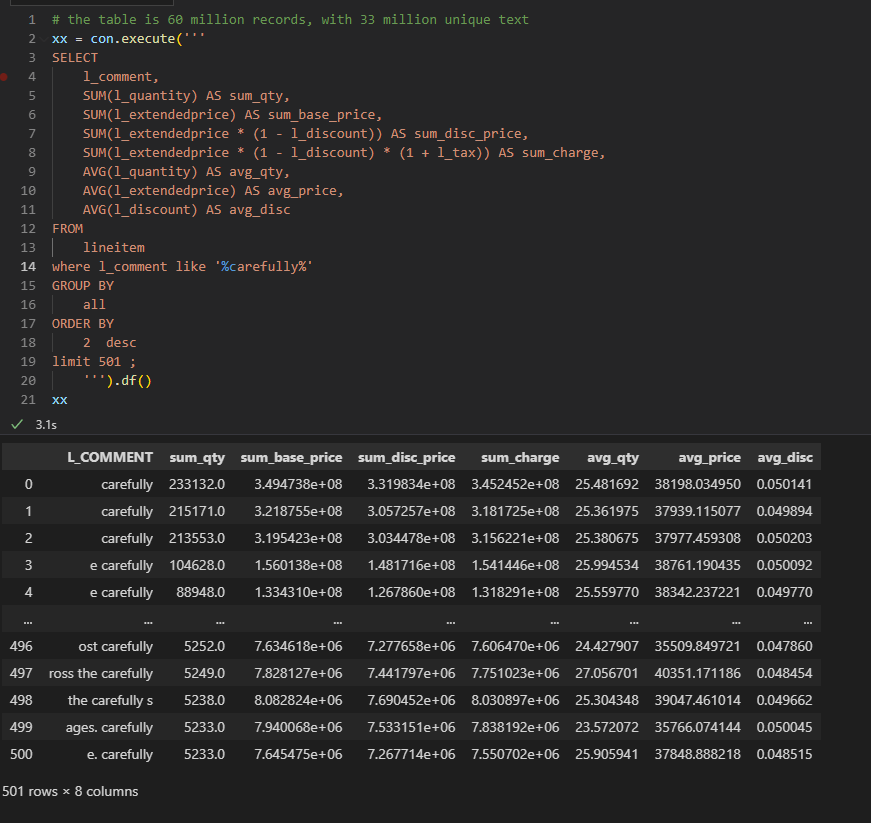
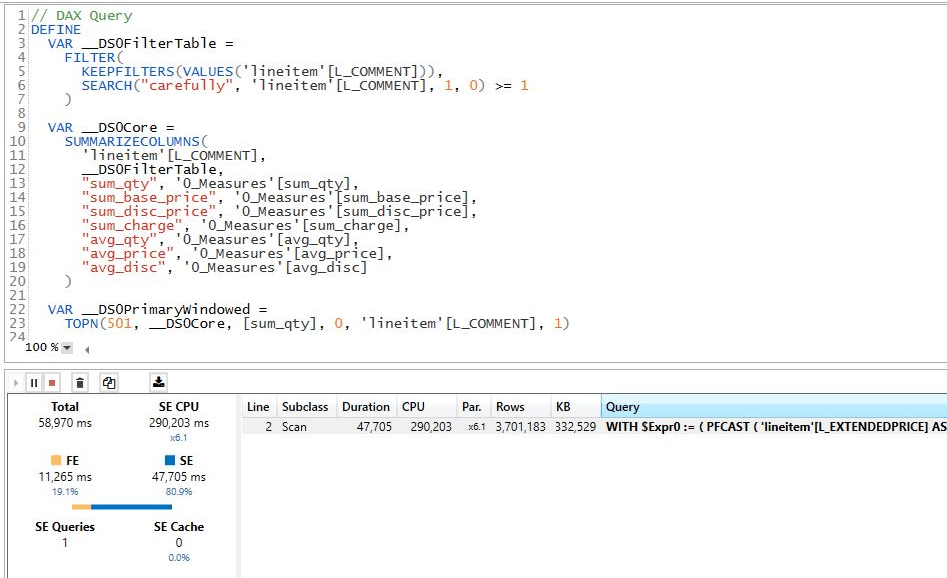
8 – Aggregate and filter on Text
DuckDB : 3.1 S
Vertipaq : 58 S
The performance seems odd for vertipaq, maybe I am doing something wrong, but it should be straightforward
Edit : Alex was kind enough and provided this excellent explanation.
9- Count Distinct group by high Cardinality base Table 120 Million records
Basically that’s the point of the blog, yes Vertipaq works well because it does fit into my Laptop RAM, let’s try a complex Query using 120 Million ? I start getting memory errors
Actually the whole experience became sluggish, just saving any edits take ages.
Let’s try DuckDB, I will just Query from parquet, I don’t want to ingest 120 million records for one Query
Take Away
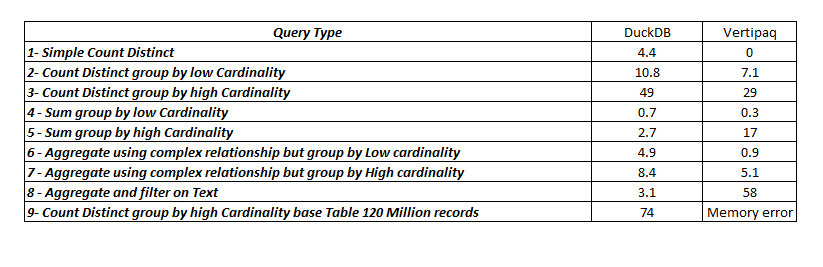
here is the summary results
Vertipaq is extremely fast but the performance degrade when dealing with High cardinality columns, filtering using string seems slow though, the Index on join or whatever the engine is doing is genius, the result for the Query 4 and 6 are magic as far as I am concerned.
DuckDB is impressive especially with the fact it is reading from Disk, yes, it is slower than Vertipaq for a small Data size which is expected as generally speaking scanning from RAM will be faster than Disk, but it does scale better.
If your data don’t fit into the RAM, DuckDB seems like an interesting proposition.
Query: custoners_bought_something is {
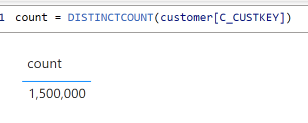
aggregate: cnt is count( distinct customer.C_CUSTKEY)
}
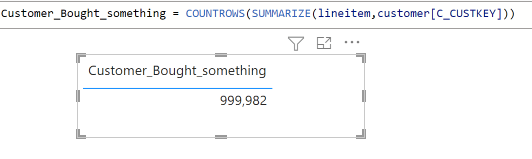
DAX : 1 500 000
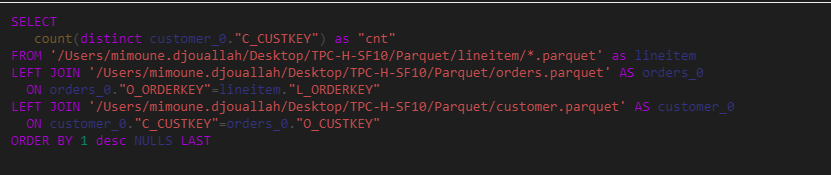
I know the table contains 1.5 M, so why Malloy is giving me wrong results, it turn out , it is by design, Malloy consider only the customers that bought something in lineitem, you can see it from the SQL Generated
DAX by default ignore the “graph” if the measure target only 1 table, to get the number of customers who bought an item, you need something like this
Take away
Maybe I am biased but I think DAX behavior make more sense, if I target only a table then the graph should be ignored, I think the relationship should be used only when I use fields from different tables.
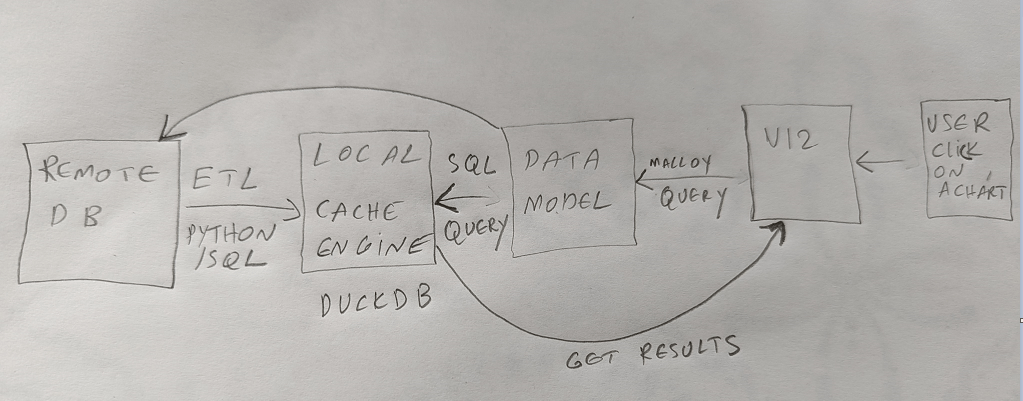
Was playing with Malloy and DuckDB and had this silly idea, can I just reproduce something Like PowerBI Desktop Just using Open Source Tools, obviously I am talking about the Overall architecture, not exact functionalities.
For a Typical Data Analytical Workload, Broadly Speaking you get something like this :
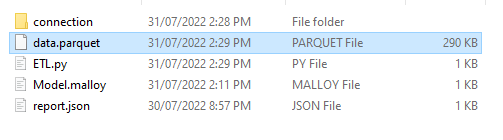
Using a Combination of Python script for ETL, DuckDB as a SQL Engine and Malloy as a Data Model you get this nice folder of files, Currently Malloy Don’t support DuckDB as a storage format, instead I am just using a Parquet file as a local Cache, but it is possible to Query the remote DB Directly, you can find the files here
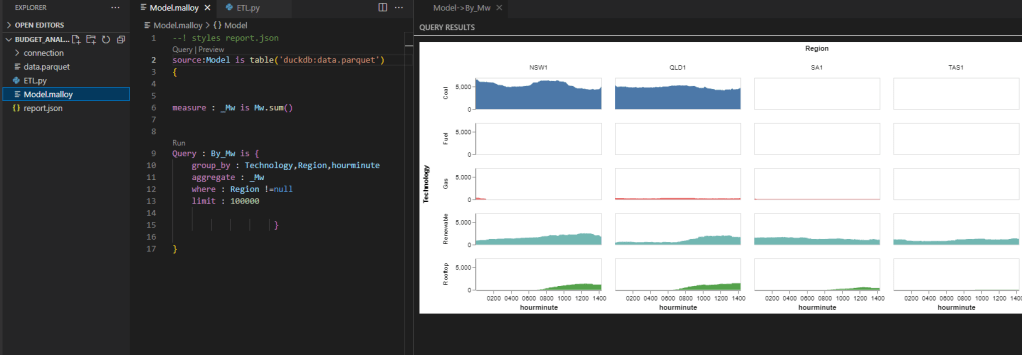
And here is a nice chart in Visual Studio Code, as of this writing, Malloy extension in VSC don’t support interactivity, they have a Viewer App, but it is not available in Windows yet.
Obviously it is a nice theoretical exercise, but one can imagine, if all those assets were bundled together in a zip file and a viewer that can natively read it. who knows, we may have something like an Open Source PowerBI Desktop equivalent.
I know it is a weird blog post, what I am trying to convey , Building a full stack BI Application is doable, it is just a matter of a lot engineering effort, and contrary to 10 years ago, we have a lot of open source building Block, Tableau had to pay for hyper, now not only a very fast SQL Engine is available as open source but a Modeling layer too, and if you care about analytics, it is a very good thing to the overall market.