Multi fact support in DAX and Malloy

This is a quick blog showing how the two languages behave when dealing with multiple fact tables.

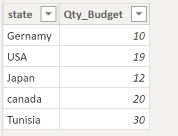
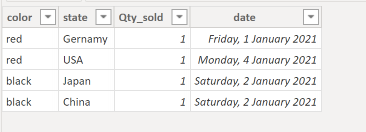
let’s start with a simple Model, Two Tables Budget and Actual storing items sold by country and color

Budget

Actual

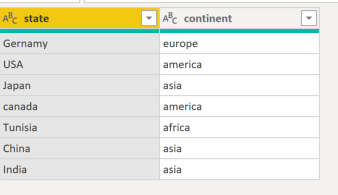
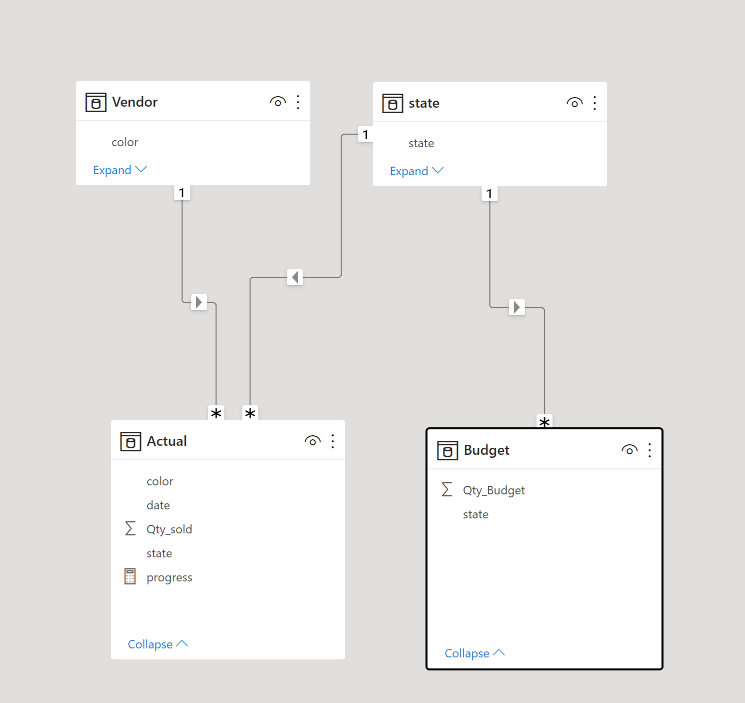
For example we want to ask, how many items were sold by continent, we don’t have this information, we need a dimension table that map state to continent.

DAX

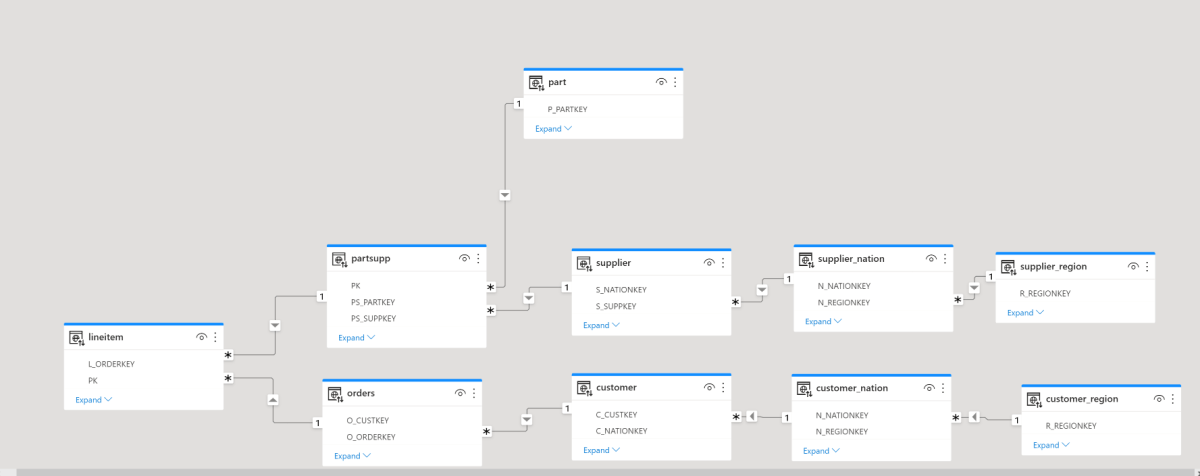
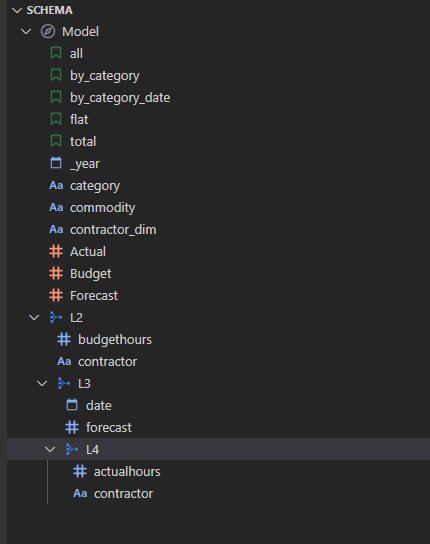
And the Data Model will look like this.

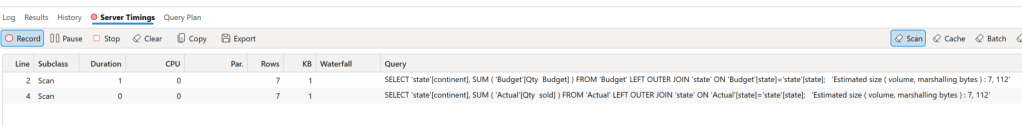
To get the results, we write this DAX Query in DAX Studio ( Btw, the new version 3 is very slick !!!)

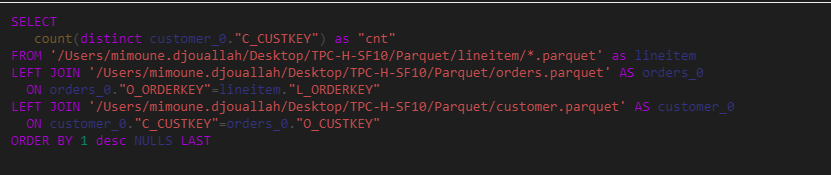
DAX will generate two SQL Query to get the results from the two tables and merge the results, using the internal “Formula” Engine
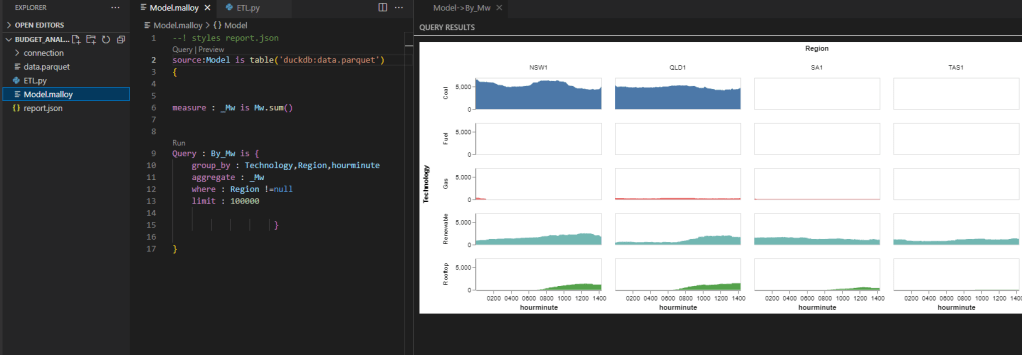
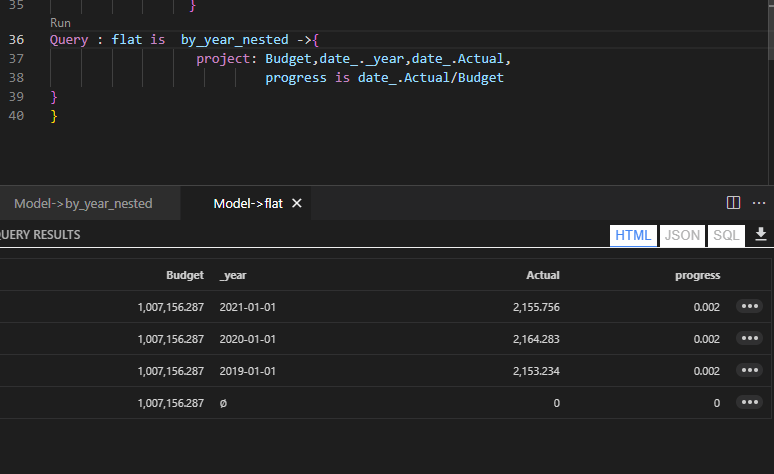
Malloy

in Malloy we do the same by writing code, you can download the Data Model here

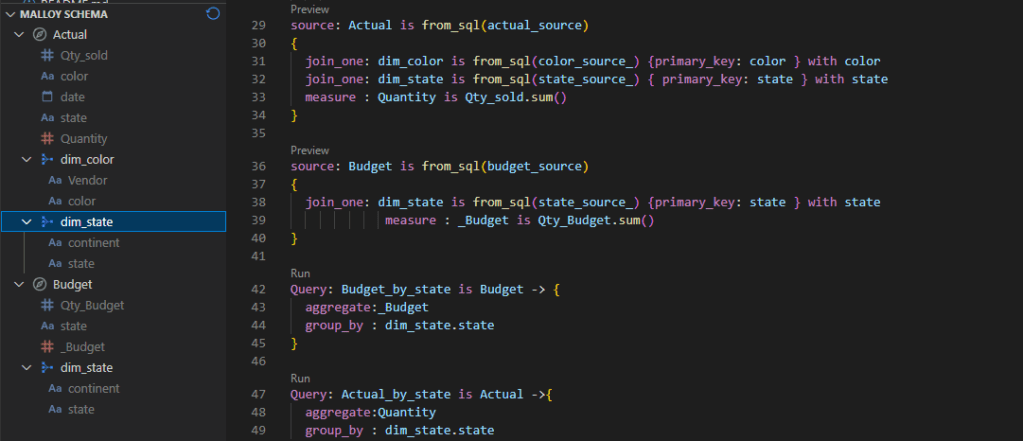
In DAX we use summarize columns to aggregate measures from different tables, as far as I can tell, Malloy don’t support this model yet, The tables Budget and Actual are independent, basically you need to manually join the two Queries generated from the two tables.

Query: Budget_by_state is Budget -> {
  aggregate:_Budget
  group_by : dim_state.state
}

Query: Actual_by_state is Actual ->{
  aggregate:Quantity
  group_by : dim_state.state
}
query: merge_results is from_sql(state_source_) {
   join_one: q2 is from(->Budget_by_state ) with state
   join_one: q3 is from(->Actual_by_state) with state
} ->{
  
  group_by : continent
  aggregate: QTY_Budget is sum(q2._Budget),QTY_Sold is sum(q3.Quantity)
}

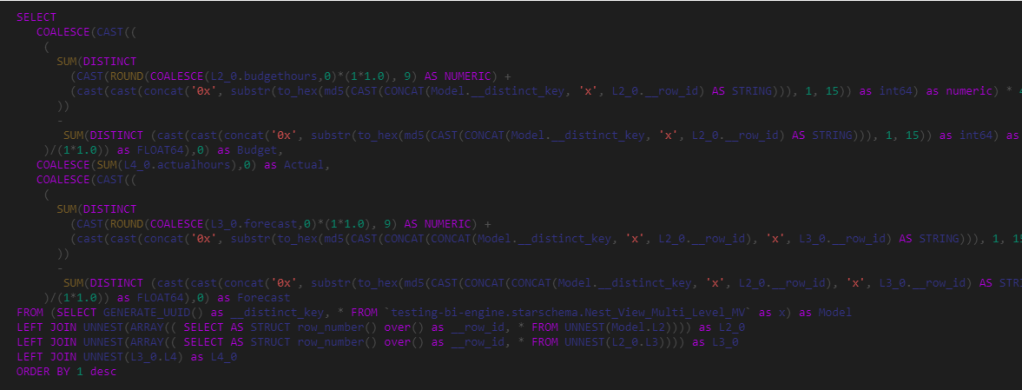
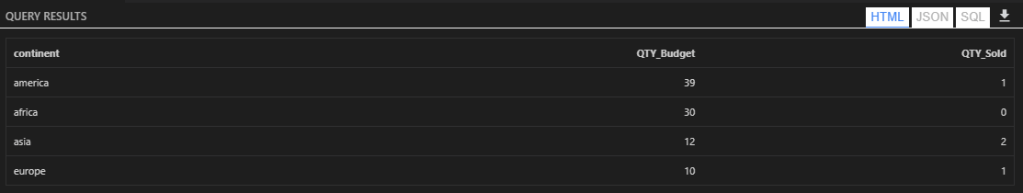
And we get the same results, Malloy always generate one SQL Query, as there is no way to merge the results internally, as a matter of fact the only “calculation” engine is the SQL Database, which is in this particular case DuckDB.

Obviously you can always create new source by using state as a base table, but I don’t think it is a sustainable solution, as the whole point is to have One model that answers a lot of different Questions.
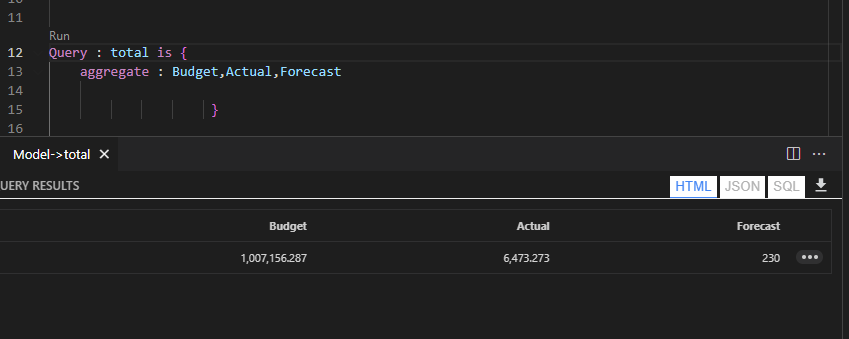
Take Away

Native support to multiple tables is obviously not unique to DAX, thoughtspot TML support it out of the Box, I hope Malloy developers consider this common scenario for future development.

Expanded Table Behavior in DAX and Malloy

Expanded tables are a core concept in DAX, Malloy has something similar although with a default behavior:).

To see the difference let’s build the same Model in DAX and Malloy and see where it is the same and where it differ.

The Model is based on TPC-H Dataset, it is a simple model as it contains only 1 Base Table ” Lineitem”

The Same Model using Malloy

you can download the Malloy here : it is just a text file

Count the Number of customers

Malloy : results 999 982

Query: custoners_bought_something is {  
    aggregate: cnt is count( distinct customer.C_CUSTKEY)
                 }

DAX : 1 500 000

I know the table contains 1.5 M, so why Malloy is giving me wrong results, it turn out , it is by design, Malloy consider only the customers that bought something in lineitem, you can see it from the SQL Generated

DAX by default ignore the “graph” if the measure target only 1 table, to get the number of customers who bought an item, you need something like this

Take away

Maybe I am biased but I think DAX behavior make more sense, if I target only a table then the graph should be ignored, I think the relationship should be used only when I use fields from different tables.

How an Open Source PowerBI Desktop May Look like

Was playing with Malloy and DuckDB and had this silly idea, can I just reproduce something Like PowerBI Desktop Just using Open Source Tools, obviously I am talking about the Overall architecture, not exact functionalities.

For a Typical Data Analytical Workload, Broadly Speaking you get something like this :

Using a Combination of Python script for ETL, DuckDB as a SQL Engine and Malloy as a Data Model you get this nice folder of files, Currently Malloy Don’t support DuckDB as a storage format, instead I am just using a Parquet file as a local Cache, but it is possible to Query the remote DB Directly, you can find the files here

And here is a nice chart in Visual Studio Code, as of this writing, Malloy extension in VSC don’t support interactivity, they have a Viewer App, but it is not available in Windows yet.

Obviously it is a nice theoretical exercise, but one can imagine, if all those assets were bundled together in a zip file and a viewer that can natively read it. who knows, we may have something like an Open Source PowerBI Desktop equivalent.

I know it is a weird blog post, what I am trying to convey , Building a full stack BI Application is doable, it is just a matter of a lot engineering effort, and contrary to 10 years ago, we have a lot of open source building Block, Tableau had to pay for hyper, now not only a very fast SQL Engine is available as open source but a Modeling layer too, and if you care about analytics, it is a very good thing to the overall market.

Building Complex Data Model using Nested Data in Malloy

Last year, I wrote a blog on how to build a nested complex Data Model using BigQuery , please read it first, unfortunately using standard SQL to nest and unnest Data was a painful exercise, maybe it was due to my lack of experience, or simply my brain is wired to think only about Tabular Data. happy to say, using the new Data Modeling language Malloy the experience became way simpler.

for a start Malloy will show a nice expended view of the nest table

The Model is self explanatory.

Now you need just to write Queries, Malloy will generate a SQL behind the scene

For example Total values of all measures :

No Idea what the SQL Means to be honest

Now Grouped by Category

Now More tricky, let’s group by year, notice, the Budget has no date values, the results is not correct !!!!

instead, you first group by year then nest the second level of grouping something like this

Malloy has a native export to nested Data Structure, but for this exercise I want a tabular results, you can easily flatten the previous Query using Project, notice how you can simply reference a previous Query, the measure Progress is simply Actual/Budget

I think it is simple enough that a “Normal” BI person can work it, you can find the Model here, The Model currently works only with BigQuery, found some bugs with DuckDB connector, hopefully it will be fixed in the next update of Malloy.

if you works with nested data, Malloy make it nearly easy 🙂

Update :

Malloy just added a semantic “All”, to ignore a group by dimension, see the same Query using the new syntax , this is Amazing !!!!