in the first blog post of this series, we showed how to connect to Primavera SQL server, in this blog we build our first report, we use only the three tables TASK, PROJECT, and PROJWBS
the online report is published here
I will not show the details of every steps, you need to have a basic understanding of PowerQuery and DAX, but i will highlights some aspects of Primavera Database schema that you should be aware of.
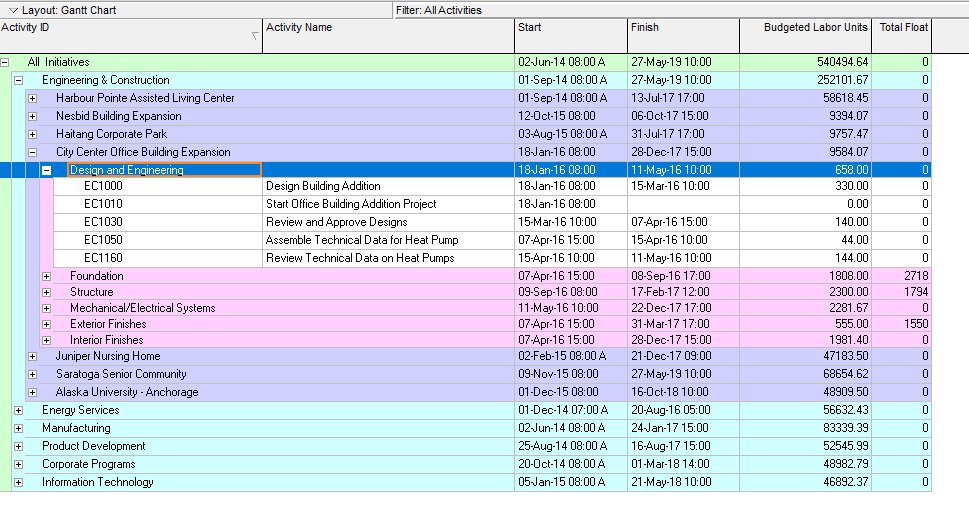
Reproduce Project View
this view show all the projects grouped by WBS and show measures, start date, finish date and budget labor units

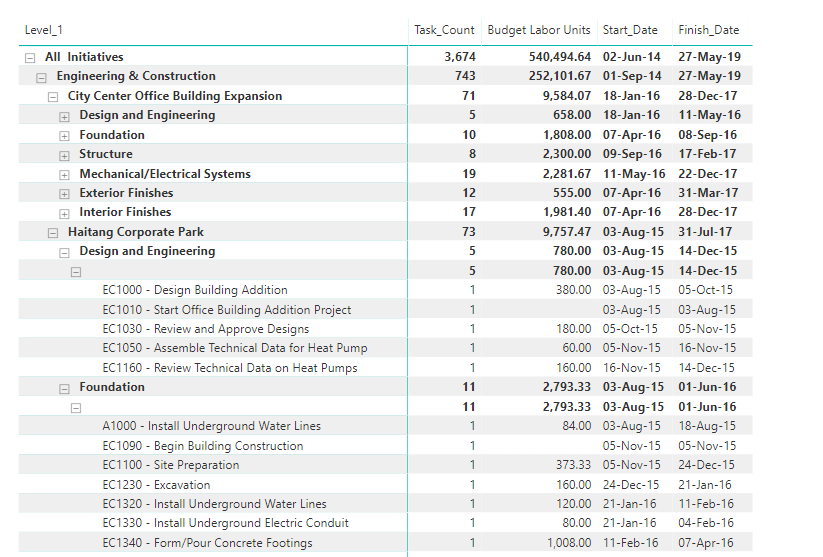
and here is the equivalent report in PowerBI
PROJWBS
the table PROJWBS store the EPS/WBS data for all projects, it is represented the database as a parent, child ID, which can’t be used directly by PowerBI, first we need to flatten the data to multiple levels so we can show it in a matrix visual, so basically moved from this format

to this format

you have multiple options either using SQL , DAX or PowerQuery, for Powerquery here is an excellent resource by the Imke Feldmann , for our example I am using DAX , the canonical reference is by Marco Russo
just make sure when you import a table from SQL server to have this filter [delete_session_id] = null , because Primavera don’t directly delete data, but instead have something called soft delete, ie; the items is not shown in the client but it is still in the database and will be deleted later, anyway for PROJWBS remove all the template WBS, (I think they are used by the EPPM web client)
TASK
task is straightforward it save all the tasks of the project, same filter [delete_session_id] = null
PROJECT
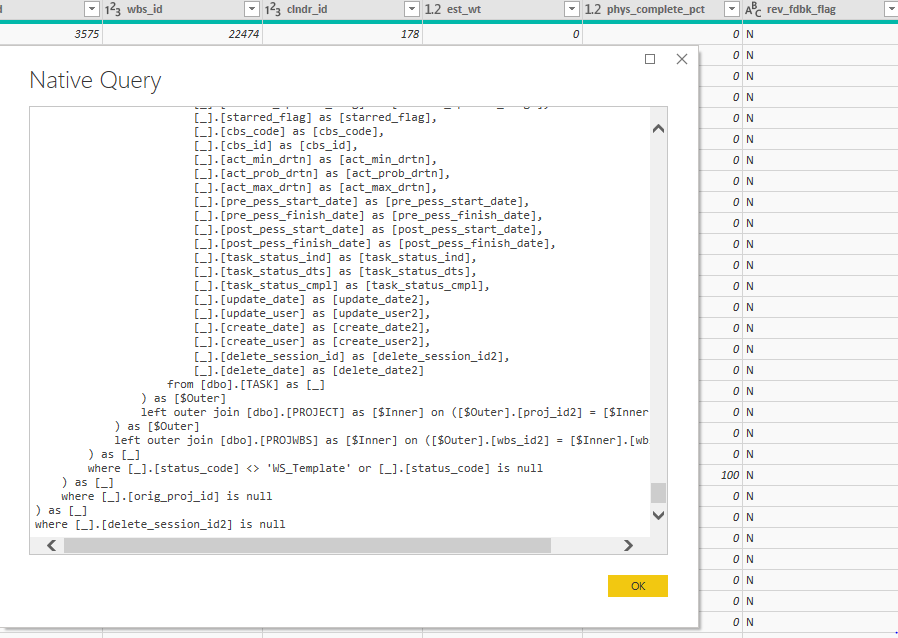
we use project table only to filter the baseline out, in Primavera current project and baseline are saved in the database exactly the same way ( that very powerful paradigm ), but for our report we want to show the activities only for the current project, too easy [orig_proj_id] = null and the best part, we don’t have to write any queries, Powerquery simply generate the SQL for the database ( that’s awesome)
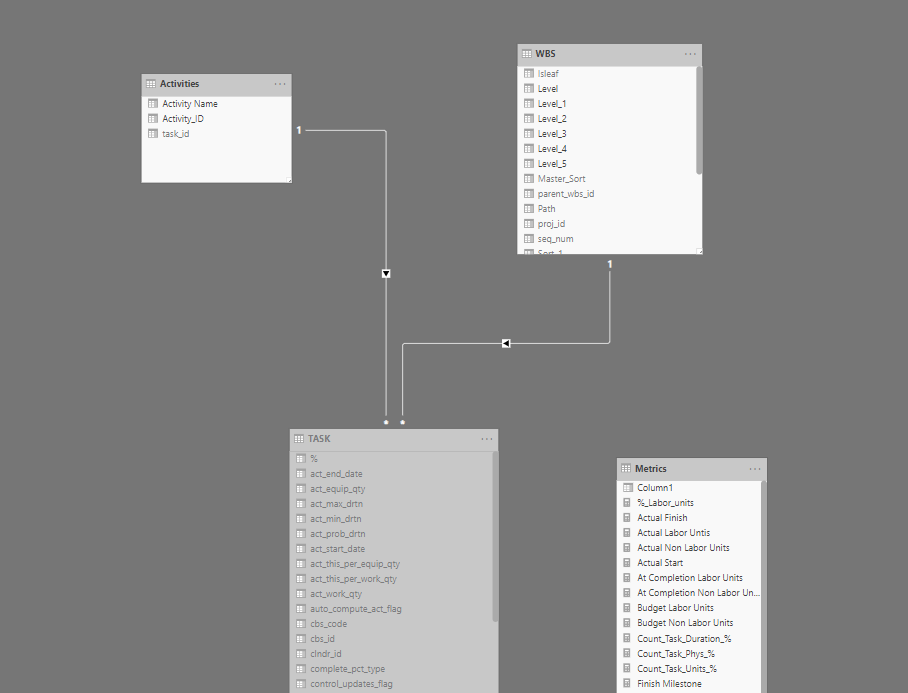
Simple Data Model
the two tables are connected by the field wbs_id, we added another copy of the table TASK as a dimension table for reporting ( just activity id, and activity name), and we have this simple data model, I like to save measures in a separate dummy tables
as you can see, building a data model is relatively easy, the complexity start when you want to add more measures, for example, total float, you need to connect to the table CALENDAR, if you want cost, you need to connect to other tables, and if you want spread it will become a little trickier ( hint it is not saved in the database)
hopefully by now, instead of asking how to connect to Primavera Database, the interesting question become, in which table the data is saved and how to join two separate tables to get the report you want
if you are still reading, I will appreciate if you can vote on this idea, unfortunately you can’t dis-activate table sorting in PowerBI, in this particular report, the sorting is already defined by the WBS, if the user click on the header, the order will change, they can still reset the order using the measure sort, still very annoying

Hi, great instruction…
Are Project Baseline Start and Project Baseline Finish (base_start_date & base_end_date) also extractable?
do you know which table contains the baseline dates in Primavera?
Thanks,Neshan
LikeLike
the dates are saved in the table task
LikeLike
Where I can find more information about this topic, or i have to export P6 report to excel?
LikeLike
I realize this may be a noob question.. but what are the steps to “flatten the data to multiple levels so we can show it in a matrix visual” ?
LikeLiked by 1 person
it is in the blog, please use this reference https://www.daxpatterns.com/parent-child-hierarchies/
LikeLike