Last year, I wrote a blog on how to build a nested complex Data Model using BigQuery , please read it first, unfortunately using standard SQL to nest and unnest Data was a painful exercise, maybe it was due to my lack of experience, or simply my brain is wired to think only about Tabular Data. happy to say, using the new Data Modeling language Malloy the experience became way simpler.
for a start Malloy will show a nice expended view of the nest table
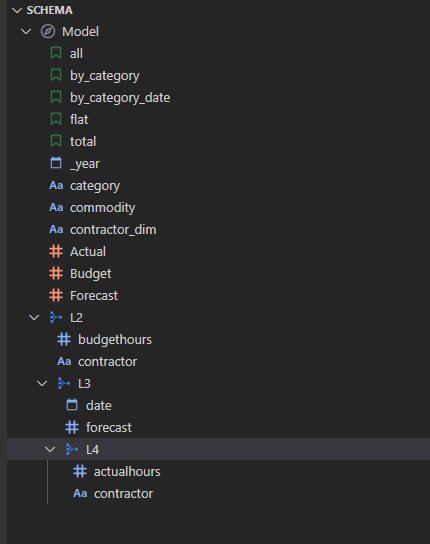
The Model is self explanatory.

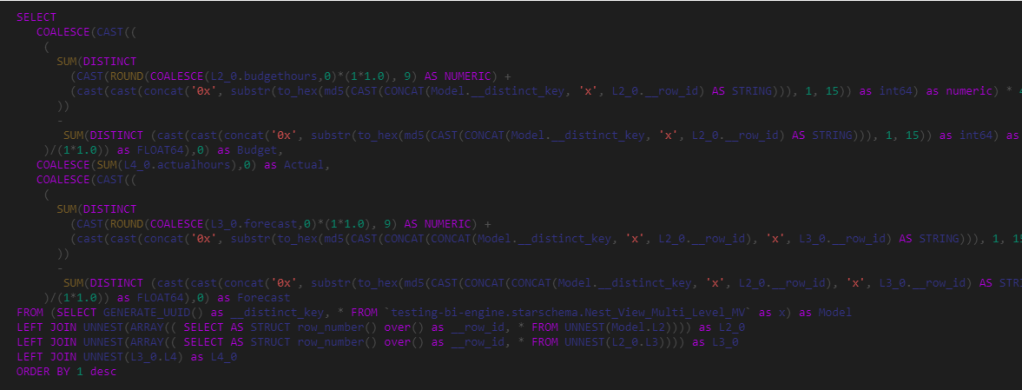
Now you need just to write Queries, Malloy will generate a SQL behind the scene
For example Total values of all measures :
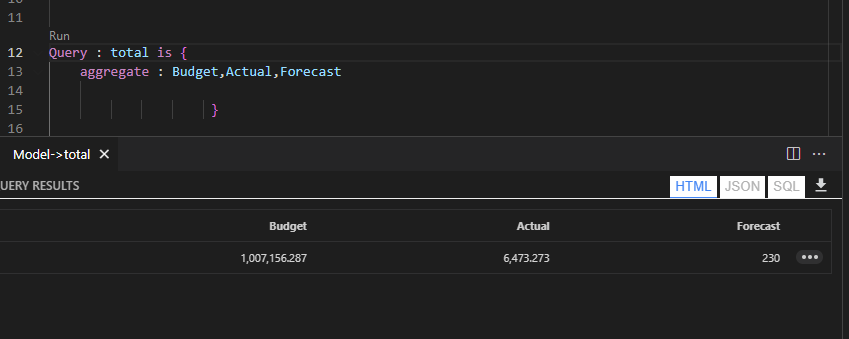
No Idea what the SQL Means to be honest
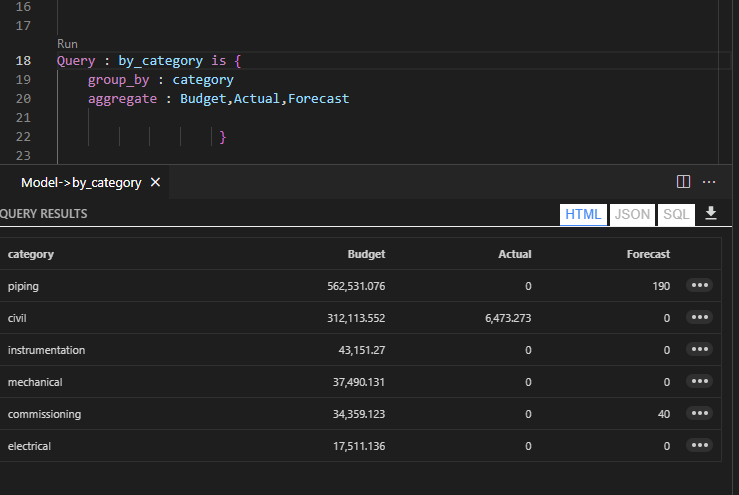
Now Grouped by Category
Now More tricky, let’s group by year, notice, the Budget has no date values, the results is not correct !!!!
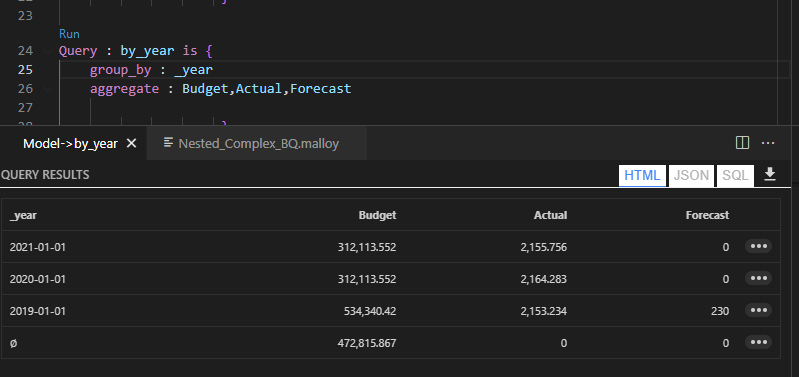
instead, you first group by year then nest the second level of grouping something like this

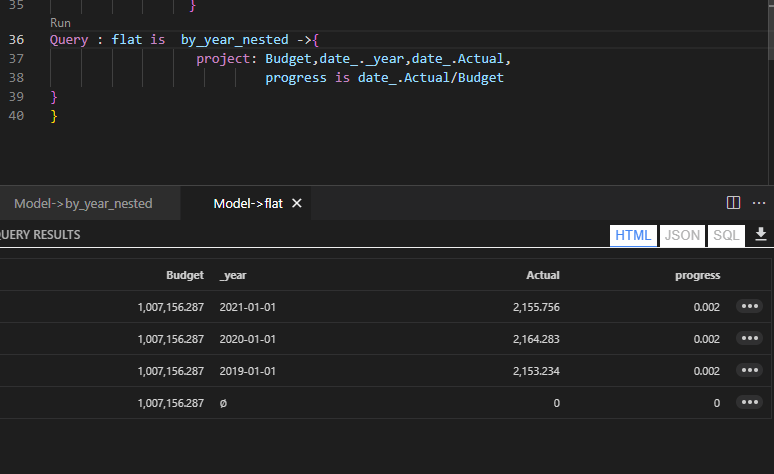
Malloy has a native export to nested Data Structure, but for this exercise I want a tabular results, you can easily flatten the previous Query using Project, notice how you can simply reference a previous Query, the measure Progress is simply Actual/Budget
I think it is simple enough that a “Normal” BI person can work it, you can find the Model here, The Model currently works only with BigQuery, found some bugs with DuckDB connector, hopefully it will be fixed in the next update of Malloy.
if you works with nested data, Malloy make it nearly easy 🙂
Update :
Malloy just added a semantic “All”, to ignore a group by dimension, see the same Query using the new syntax , this is Amazing !!!!

