This blog post is to document my first experience with mapping in PowerBI, usually the reports we produce are time series and pivot tables, but in this case, there is a geographic dimension to the data, so I thought it is a good opportunity to try map chart in PowerBI, it turn out, it is a bit difficult than I thought.
So the data is in the thousand of piles, a lot of piles in a huge area, my first attempt was just to load the data in PowerBI and view it in a map, for some reason, PowerBI show an empty map.
PowerBI expect the data to be in latitude and longitude format, my the data is using easting and northing, I had to convert it, there are plenty of online converter, but there are not practical, as they don’t support batch processing, converting point by point is not an option.
After some googling, I find this excellent open source software QGIS, it was very straightforward, the software automatically convert the coordinates reference system (I think the technical term is reprojection), my data is GDA94 / MGA zone 55 and the result should be in WGS 84.
Voila the data is ready for PowerBI,
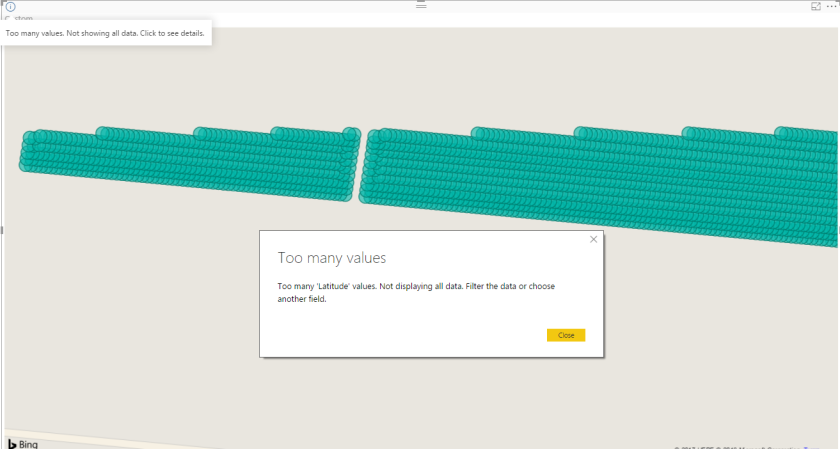
That’s a bit disappointing, PowerBI complain it cannot show all the points ( PowerBI has a maximum of 3500 points per chart).As a comparison, this is how Tableau show the data
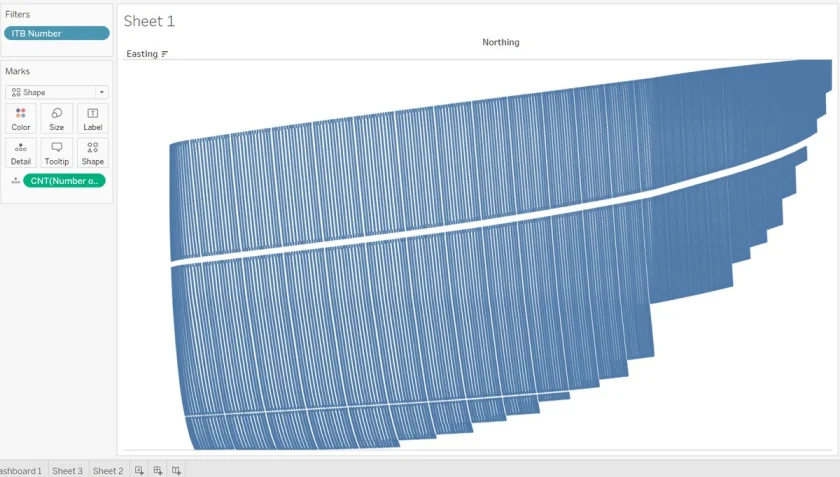
Tableau doesn’t have a limitation on the number of points.
Alternative approach
As PowerBI cannot show all the point, one solution is to create a shape file that group the points into smaller areas, and again, it was trivial to be done in QGIS.
QGIS will group the point based on a filed you provide.
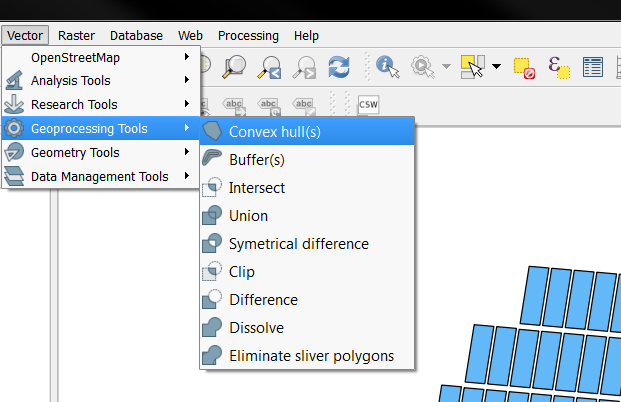
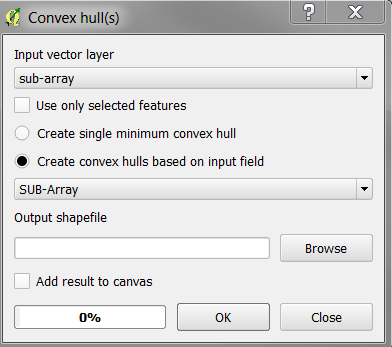
And volia
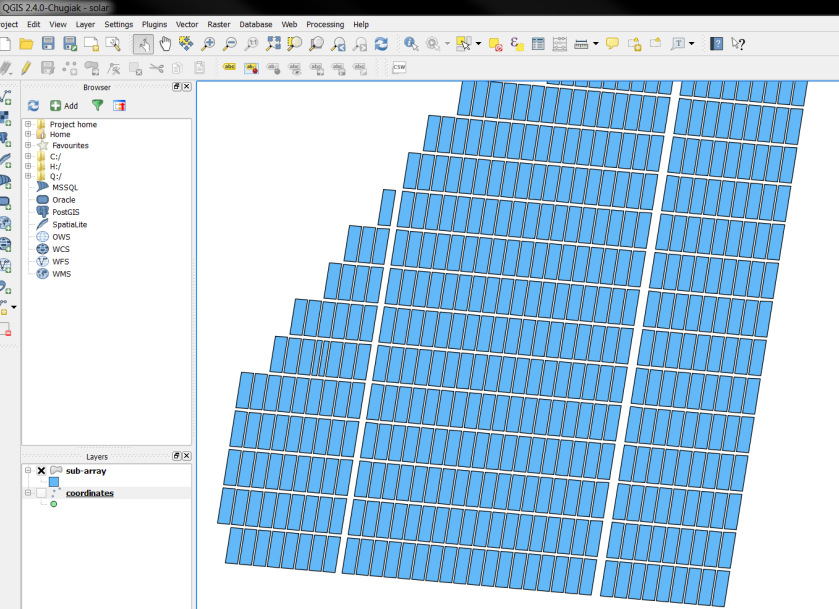
QGIS save the layer in ESRI shapefile, PowerBI require TopoJSON, I used the excellent tool mapshaper.org
Just make sure you import all the files not only .shp

Now the TopoJSON is ready to be loaded in PowerBI

Time to celebrate 🙂 not really there is a problem, I want to show different colour based on the status, if a sub-array is completed, I want it to show Yellow, if it is > 75 %, I want another colour and so on, the shape Map in PowerBI does not offer this option.
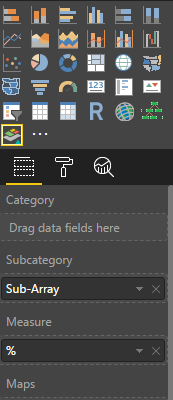
Fortunately Synoptic Panel has more options, it use SVG as a map format, which I got from mapshaper.org

Preparing the custom map is a one time operation, the color will change as per the construction progress, you need just to assign which measures you want to show
What’s Next
As long as your data model is properly built, you can do a lot of interesting stuff, you can filter by type of works (piling, Tracker installation, PV Modules), you can click on one sub-array and see in details what’s have been installed and what’s missing.
Hi Mim,
Good work, as usual! 🙂
Is this part of your regular reporting? How much time do you have to put in to produce this?
LikeLiked by 1 person
Thanks Marcus,
building the report took me a while as I didn’t really know what I was doing 🙂 but updating the report take 5 minutes, the time to refresh the new data.
Yes it is a part of the daily progress reporting.
LikeLike
Hi Mim
I have a question. Its possible show multilayers of data on PBI?. In a layer, only store one data type (point, polygon, line)
LikeLike
not sure about native visual in PowerBI, but personally I use R visuals to display multiple layers of data
LikeLike
Hello Mim!
How did you add your map to power BI? Is it possible to get a map like a shape file?
LikeLike
yes, you can use Shape map visual, the format should be Topojson though, this links may help
https://community.powerbi.com/t5/Desktop/From-Shapefile-to-TopoJSON-for-shape-map/td-p/69691
LikeLike
Does Qgis in combination with power bi supports mobile environments? I use ESRI. If I want to load the map in a mobile environment is says ArcGis Online is not currently supported in mobile environments. Thansk!
LikeLike
Qgis is just used to prepare the topjoson file, I use the native PowerBI visual to displayed it, I don’t use mobile so i would not know, have you tried mapbox, i start using it recently and I like it a lot !!
LikeLike