How an Open Source PowerBI Desktop May Look like

Was playing with Malloy and DuckDB and had this silly idea, can I just reproduce something Like PowerBI Desktop Just using Open Source Tools, obviously I am talking about the Overall architecture, not exact functionalities.

For a Typical Data Analytical Workload, Broadly Speaking you get something like this :
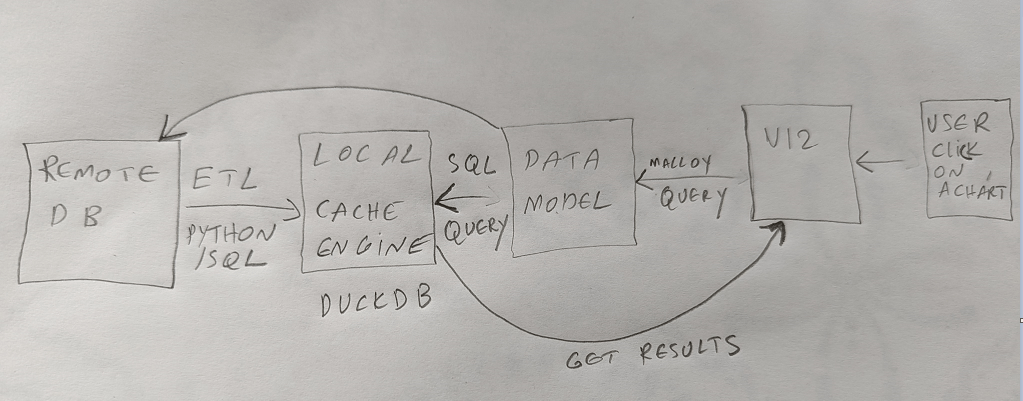
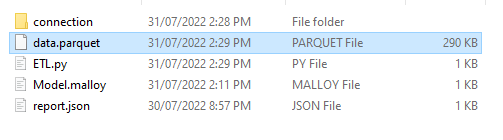
Using a Combination of Python script for ETL, DuckDB as a SQL Engine and Malloy as a Data Model you get this nice folder of files, Currently Malloy Don’t support DuckDB as a storage format, instead I am just using a Parquet file as a local Cache, but it is possible to Query the remote DB Directly, you can find the files here
And here is a nice chart in Visual Studio Code, as of this writing, Malloy extension in VSC don’t support interactivity, they have a Viewer App, but it is not available in Windows yet.
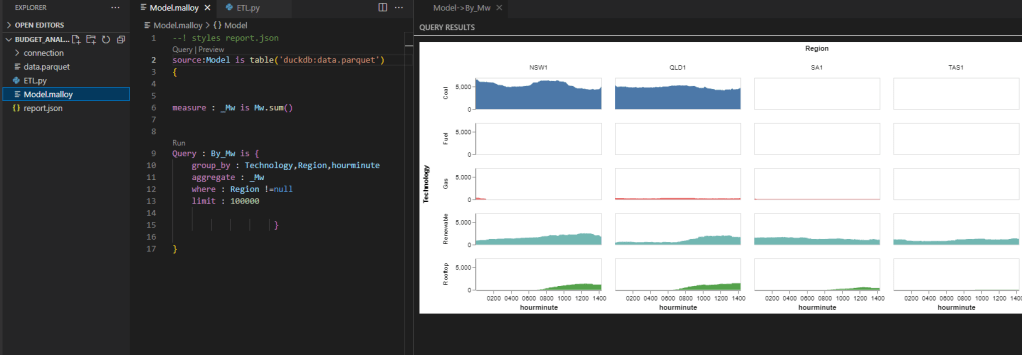
Obviously it is a nice theoretical exercise, but one can imagine, if all those assets were bundled together in a zip file and a viewer that can natively read it. who knows, we may have something like an Open Source PowerBI Desktop equivalent.

I know it is a weird blog post, what I am trying to convey , Building a full stack BI Application is doable, it is just a matter of a lot engineering effort, and contrary to 10 years ago, we have a lot of open source building Block, Tableau had to pay for hyper, now not only a very fast SQL Engine is available as open source but a Modeling layer too, and if you care about analytics, it is a very good thing to the overall market.
PowerBI vs Thoughtspot Semantic Model and Why Pricing is an Engineering Problem.

A couple of days ago, Thoughtspot released a new tier tailored for Small and medium enterprise, see the pricing here, The big surprise, unlimited users is a standard offering even for the entry level tier which cost 95 $/Month, yes there are some limitation, but you can add any number of users !!!!

One may ask, how they can afford it? Thoughtspot is not a charity and they have a margin to maintain !!! and why a bigger player Like Microsoft can’t do that, the hypothesis of this blog is, it is mainly an engineering problem , which bring us to the semantic Model Architecture for Both product.

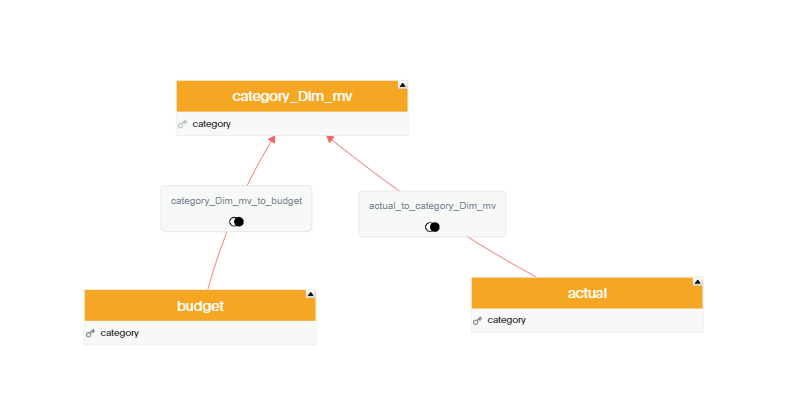
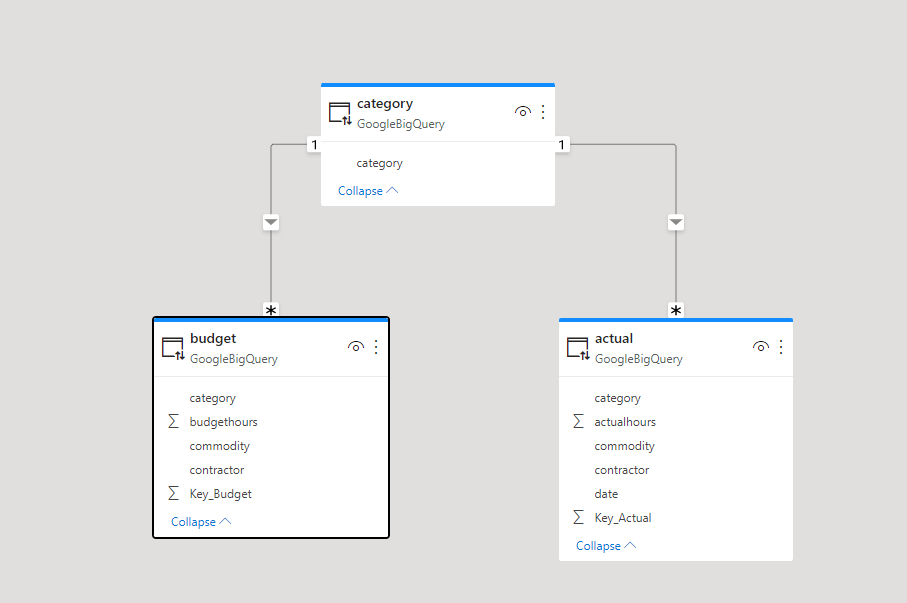
Let’s build a very simple Semantic Model in PowerBI and Thoughtspot, two fact tables with one common dimension, Both Data is hosted in BigQuery

now let’s have a simple report, in both PowerBI and Thoughtspot

Now let’s check the Queries sent to BigQuery.

PowerBI send three Queries

Thoughtspot Send one Query that return the results exactly as the visual

Why PowerBI needs three SQL Queries ?

That’s the key Question in this Blog, PowerBI was designed to have two tiers, a first tier to scan data either from the internal Database Vertipaq ( or external DB in live more) and the second tier to do ” result merge” and more complex calculation, it is a very clever design decision as it works with less sophisticated DB, after all , all External DB needs to provide is a simple scan and inner & left join, all the complexity is handled by the Formula Engine. ( Tableau has more or less the same architecture)

Thoughtspot made different design decisions, all the calculations are done by the external Database, The “Front End” job is to generate SQL based on the relationship between tables and the definition of measures, this was made possible because Cloud Data warehouse are fast and can do complex calculation. ( I know it is more complex than that like indexing and AI stuff but that the general idea )

My speculation is Thoughtspot Semantic Model require less compute resources, which made unlimited users possible even for the small tier.

I would argue even if thoughtspot decide to add an internal Database later, it will be still cheaper as the Storage/ compute can be shared and it is separated anyway from the Logical Data Model.

To be very Clear, I have no Idea how vendors decide their pricing, but my speculation is architectural design have consequences, and paying per user pricing model is archaic, and hopefully will be history.

Tableau vs PowerBI behavior in Direct Query Mode , Result Cache

I was intrigued why Tableau and PowerBI have a different behavior when operating in a Direct Query Mode ( Tableau call it Live Mode), I always assumed it is just a driver difference, but it seems it is a little bit more complicated than That.

It is a long weekend, and Tableau released the next version as a beta (which is free), so it is a perfect opportunity to do some testing, Hopefully it will be a series, but let’s start with the fundamental difference, Query Results Cache

Again, this is not about import mode, also known as extract in Tableau, which generally speaking works the same way (PowerBI can have mixed mode, which is not supported in Tableau as far as I know)

The Data Model

The Model is very simple Star Schema, 1 Fact ( 5 years of electricity Data) and two dimensions, Calendar Table and Power Generation Plan attribute

I built this simple report, Total Mwh by substation

Tableau generate an Inner Join, same behavior as PowerBI

SELECT `DUID_DIM`.`StationName` AS `StationName__DUID_DIM_`,
  SUM(`UNITARCHIVE`.`Mwh`) AS `sum_Mwh_ok`
FROM `test-187010.ReportingDataset`.`UNITARCHIVE` `UNITARCHIVE`
  INNER JOIN `test-187010.ReportingDataset`.`DUID_DIM` `DUID_DIM` ON (`UNITARCHIVE`.`DUID` = `DUID_DIM`.`DUID`)
GROUP BY 1

Filtering Data

  • Tableau

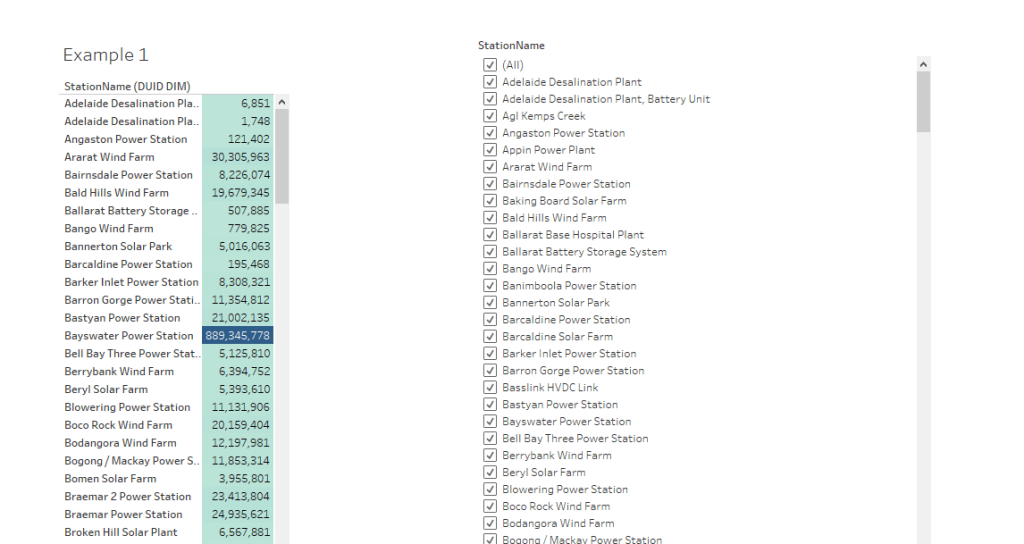
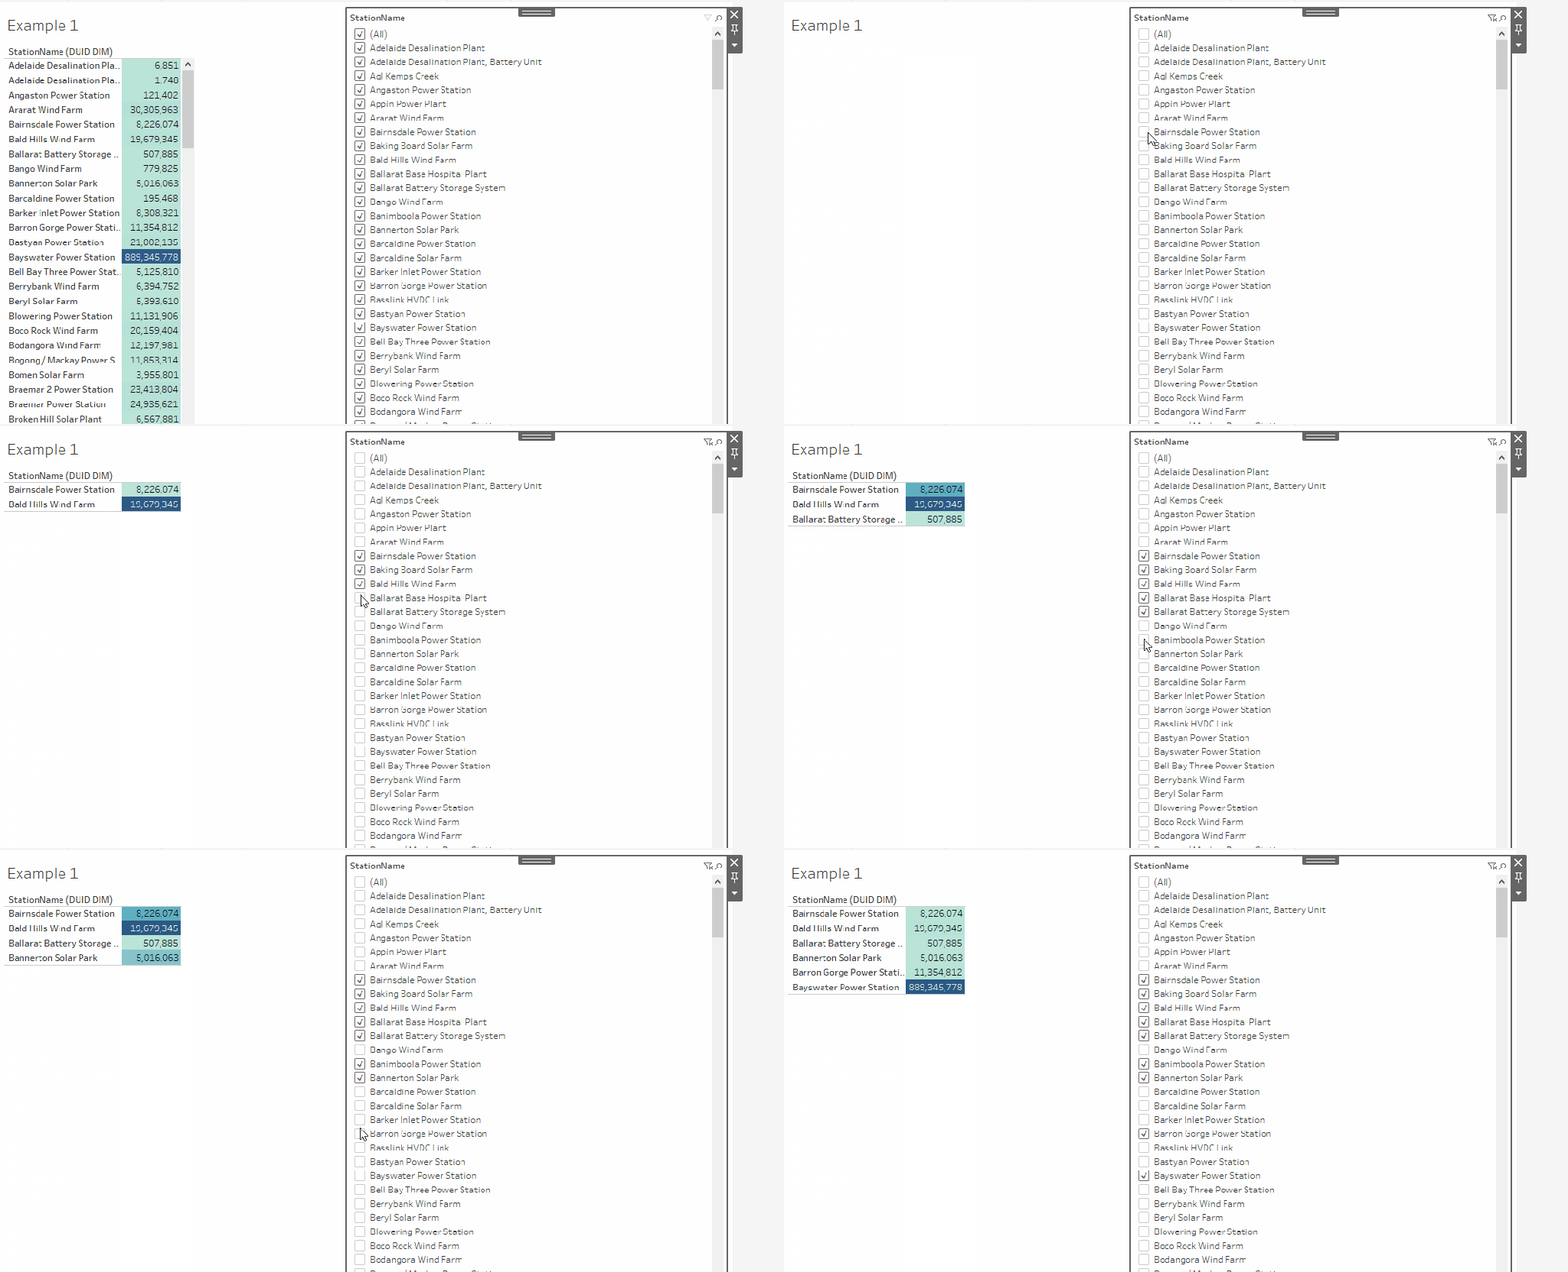
I noticed filtering data is basically instantaneous, it is hard to believe it is using Direct Query Mode, you can see it here.

Tableau cached the results of the first Query, when you filter a substation, the data is already there, it does not need to send another SQL Query

  • PowerBI

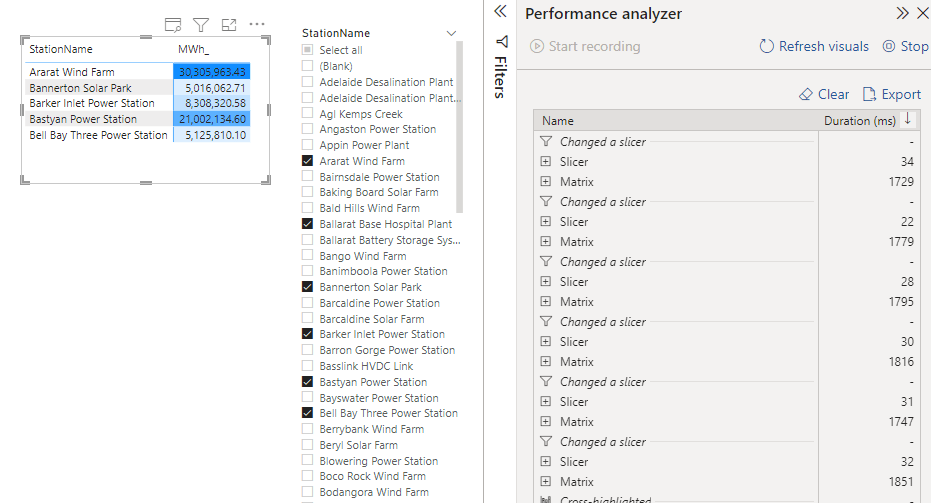
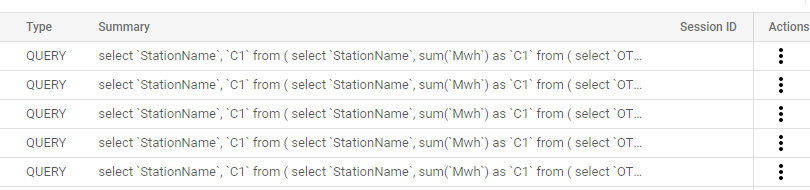
Built the same report in PowerBI, every selection will fire a new SQL Query, yes it is still fast ( under a 2 second), but it is not instantaneous.

Here is an example in BigQuery Console

Take away

That was a simple example, but imagine 100 of users with a lot of Visuals, I suspect it will create a massive Workload on the source system, I think Tableau behavior, as a lot of other BI tools (Superset, Looker etc) make a lot of sense, and maybe it will be useful too for PowerBI.

First Look at Thoughtspot Modeling language TML

I have a bit of an obsession with Modeling language, I am referring to semantic model language like PowerBI tabular Model , Looker LookML and the new alpha release of dbt metrics and Google Malloy

For some reason, TML the modeling language of thoughtspot is not getting enough attention, although IMO, it is one of the most mature offering right now in the so called “Modern” Data Stack.

This is not a review, I spend some time in the weekend playing with the free trial, (no credit card required , and you don’t need to talk to a sales department) and I thought it is worth sharing some notes.

For Any test, I always start with the same Model, 3 facts tables with different granularity and a couple of common dimensions, because this is the kind of Model I use at Work with PowerBI.

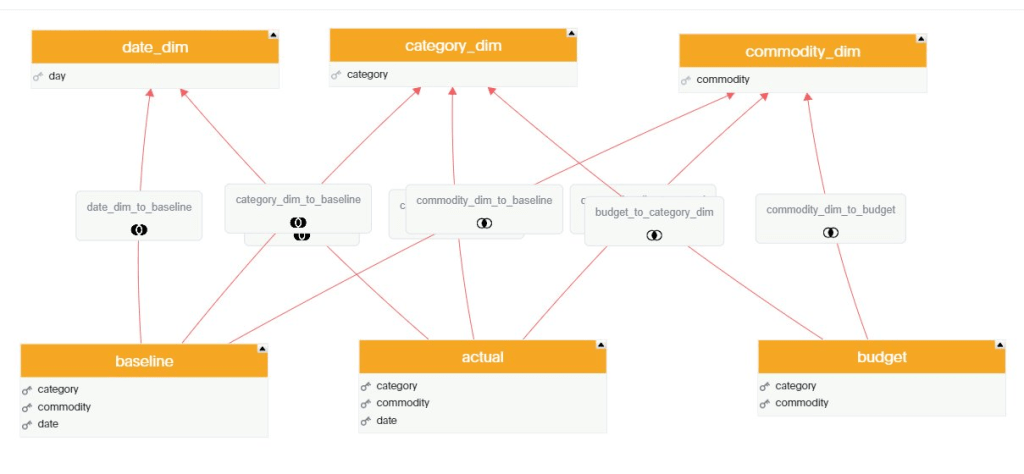
My Data is loaded into BigQuery, connecting to the database in Live Mode and selecting the Tables was very straightforward, adding the relationship between Tables was very easy too, using a simple GUI.

Here we go, a Multi facts ( AKA Galaxy Schema ) is supported out of the box, in other BI tool Like Tableau for example, you can have only 1 Base Table, here like PowerBI it is not an issue.

The Join between Tables are Progressive, only the joins need between the selected columns in the visual will be used.

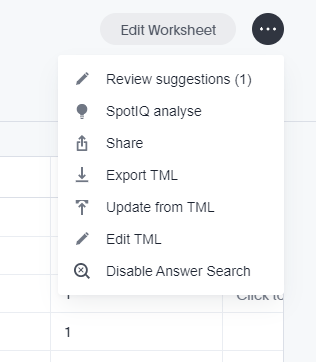
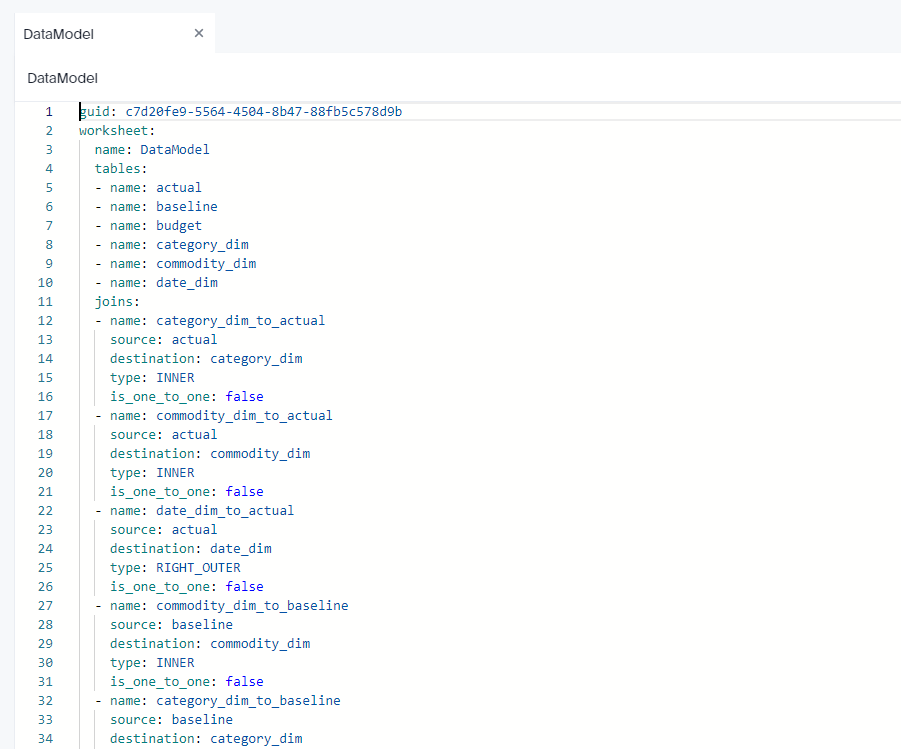
Although I build the Model using GUI, the code is written behind the scene, you can build it by hand or edit it, or simply import it.

Complex Measures

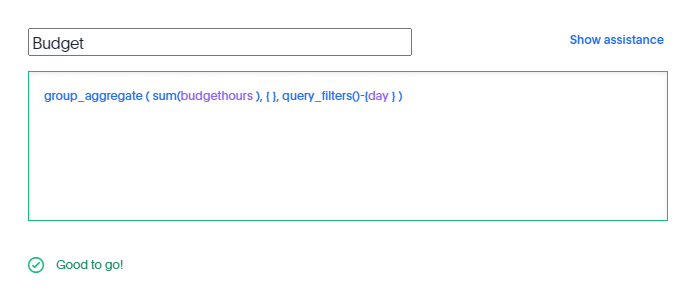
in this Model the table Budget don’t have a date dimension ( 1 Km of Electric cable is the same independent of time), to model that, I need to tell TML that the measure budget should ignore the date dimension

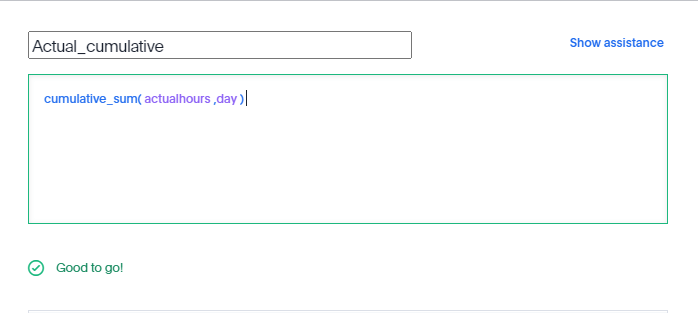
Calculating cumulative sum is straightforward,

All sort of level of details calculation are supported, including measures from different tables.

All SQL

As far as I can tell and based on the SQL Generated by Thoughtspot , there no Post processing for the calculation, Like PowerBI Formula Engine and Looker Merge results, all the calculations are done at the Source Database level, there is even a very nice visual Query Planner

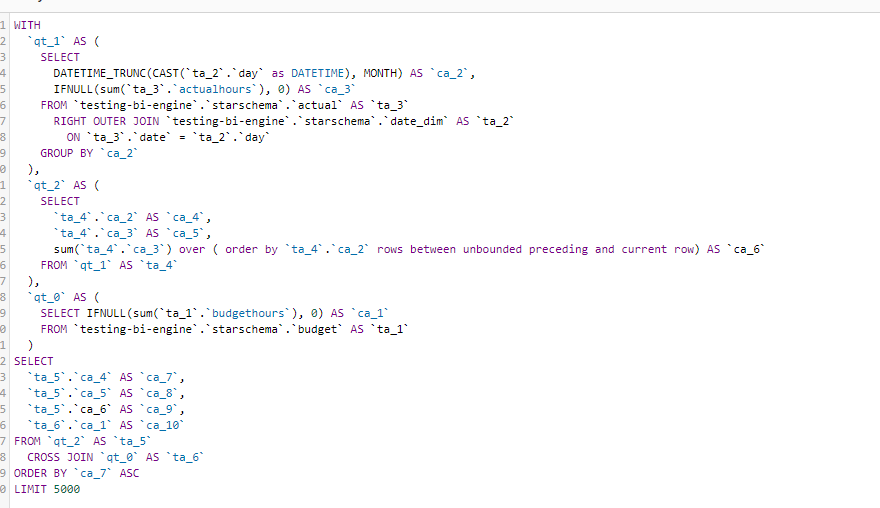
And here is an example of the Query generated, I think it use the concept of Drill across

You can see how sum cumulative was translated to SQL sum () over (order by)

Take Away

There is a lot of discussion nowadays about the need for a pure logical metric layer, where all the calculations are done by the DWH, unfortunately most of the proposals are either immature or sometimes are just magical thinking, TML is a damn solid language and a Query generator, and the guys building it knows what they are talking about.

I think if thoughtspot somehow decide to release TML as an open source Project with the Query generator it will change the current market dynamic, The Cloud Data Warehouse are getting really Fast and they deserve a decent Semantic Layer.