Come across this blog post in Twitter and I thought this approach can be very useful in PowerBI to deal with Big GIS dataset.
The idea is simple, let’s say you have a big spatial dataset with million of coordinates, so instead of plotting all the individual points which is unfeasible for performance reason, you simply do this,
– First generate a grid for the area you want to analyse using something like QGIS.
– Then count how my point belong to every cell in the grid and color the results accordingly, you need a spatial Join for that, either using QGIS , SQL Server etc
– Drill down to individual points using WKT multi point
Generate a Grid System
After a lot of googling as I did not even know what to look for, turn out QGIS can very easily generate a Grid, here is a good tutorial I found
and here is a results for Chicago area as I am using it as an example for this blog, Please notice, the grid should have less than 30K polygons which is the maximum number of rows that PowerBI can plot.

Spatial Join
I could have used QGIS to do the spatial join, but my data is from BigQuery public dataset (bigquery-public-data.chicago_crime.crime) and for convenience, it is easier to do the join there, the previous link show how to do the join in QGIS.
After loading the grid geometry to BigQuery, I am using this Query to join the two dataset, Grid and my current example, Crime data in Chicago
CREATE OR REPLACE TABLE
  XXXXXX.GIS.crime AS
WITH
  crime AS (
  SELECT
    fbi_code,
    ST_GEOGPOINT(longitude,
      latitude) AS geo,
    longitude,
    latitude
  FROM
    `bigquery-public-data.chicago_crime.crime`)
SELECT
  fbi_code,
  geo,polygon,
  longitude,
  latitude,
  ID
FROM
  crime
JOIN
  XXXX.GIS.Grid AS Grid
ON
  ST_INTERSECTS(geo,
    polygon)
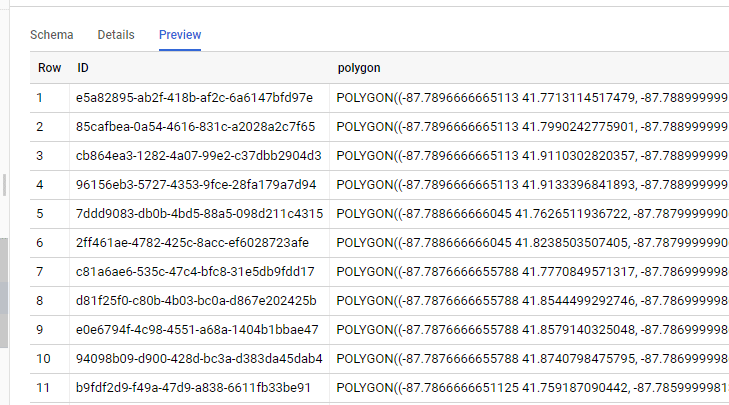
The Query is checking every coordinates and looking up which polygons it belong to, so the Grid table is something like this
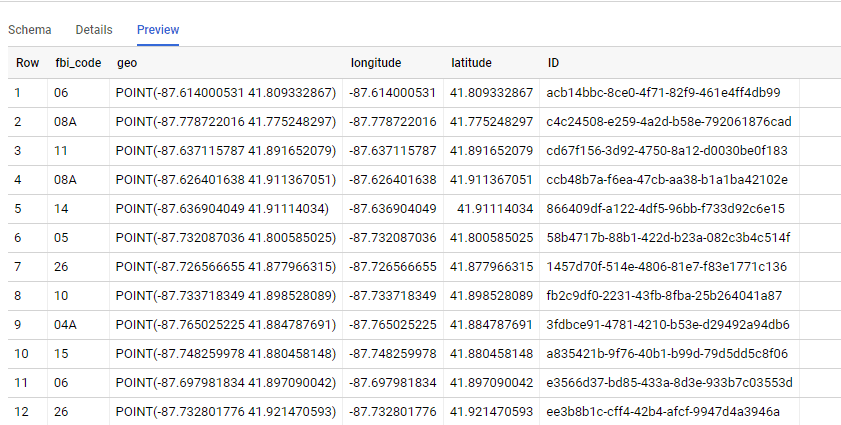
And the Query results is like this, we go the ID from the Grid Dataset, Any DB that support geometry can be used SQL Server, PostgreSQL etc
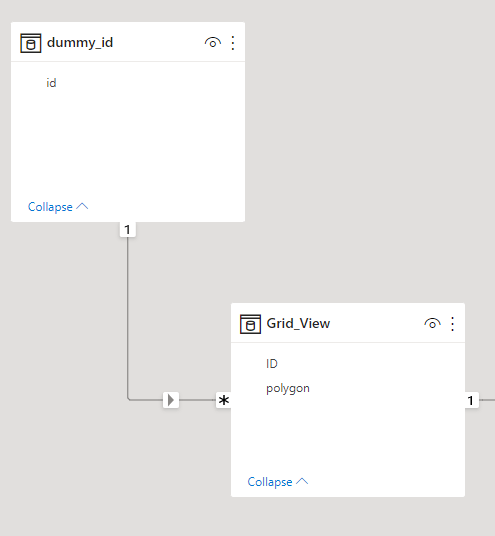
PowerBI
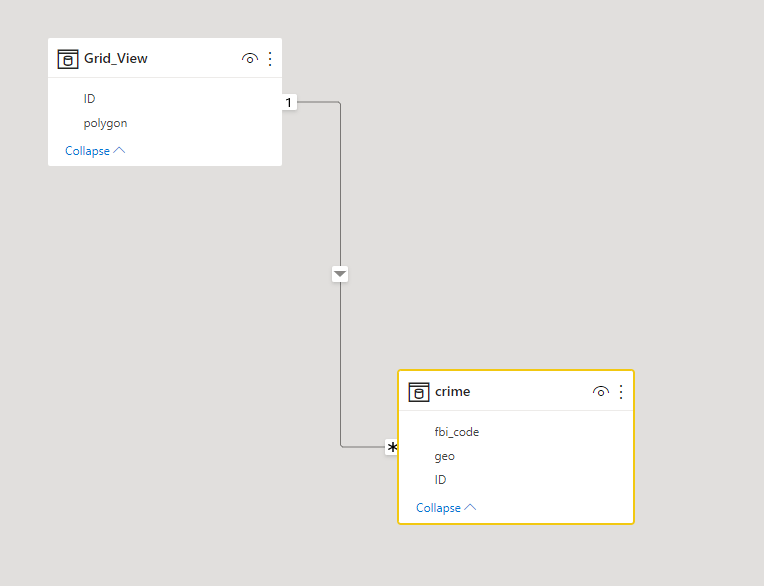
Let’s import those two table to PowerBI, the two tables are joined by the field ID
Luckily PowerBI support WKT format using Icon Map, show the grid with the count of number of coordinates is straightforward
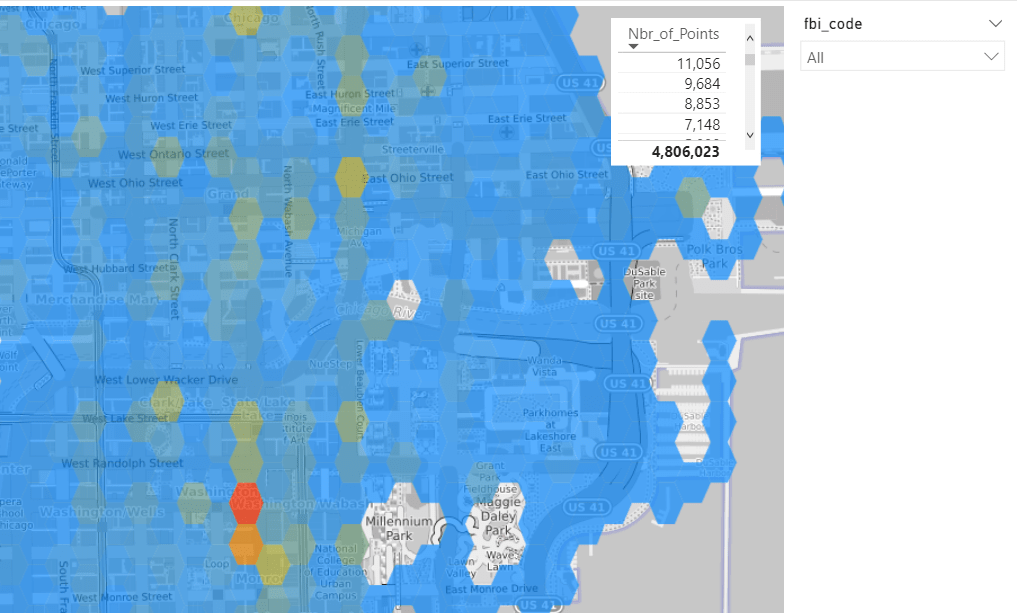
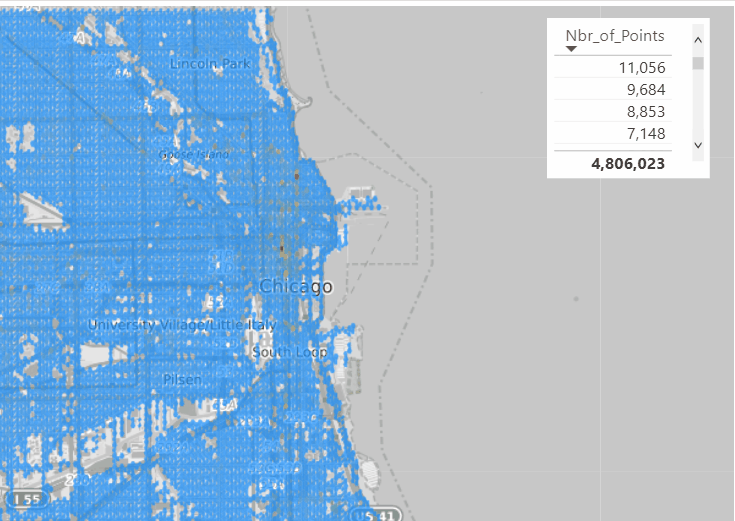
Ok, it is great we have an aggregation of 4 Millions points and we can see the areas with the highest Number of recorded crime, you can filter by FBI code which classify the crime gravity (I have zero knowledge about this dataset, I just used as an example)
Drill Down to individual Cell
because we have the individual points, all I need to do is to generate Multi point geometry using DAX , that’s why I love Icon Map so flexible , The measure will simply detect if the cell ID is filtered or not and then switch between Polygons and Multi point
Geometry =
VAR polygon =
    MIN ( Grid_View[polygon] )
VAR concat =
    CONCATENATEX ( VALUES ( crime[geo] ), crime[geo], "," )
VAR Multi_point = "MULTIPOINT (" & concat & ")"
RETURN
    IF ( ISFILTERED ( dummy_id[id] ), Multi_point, polygon )
Notice Here, as a PowerBI Visual can not filter itseelf, I had to add a dummy dimension
and here is the final result
Take Away
PowerBI Icon map and QGIS is a very powerful combination, and the fact that DAX can generate a geometry on the fly is very interesting Pattern.
