a very common pattern in Data Analytics is to calculate top performing items by category, for example Top 5 car sales by Brand and Country , now that GDS support SQL Parameter I thought it is a nice opportunity to try it.
I am using a data set that show sales of items by country and geographic region for a hypothetical Company

to get the rank, I am using Row_Number () analytics functions and to make the example a bit more complicated, I presume, the user want to filter by Sales_Channel , Online/Offline or Both
here is the query
WITH
xx AS (
SELECT
Region,
Country,
SUM(Total_Revenue) AS Total_Revenue
FROM
Sales_Summary_rand
WHERE
Sales_Channel IN UNNEST(@Sales_Channel)
GROUP BY
1,
2)
SELECT
*,
ROW_NUMBER() OVER(PARTITION BY Region ORDER BY Total_Revenue DESC) AS rnk
FROM
xx
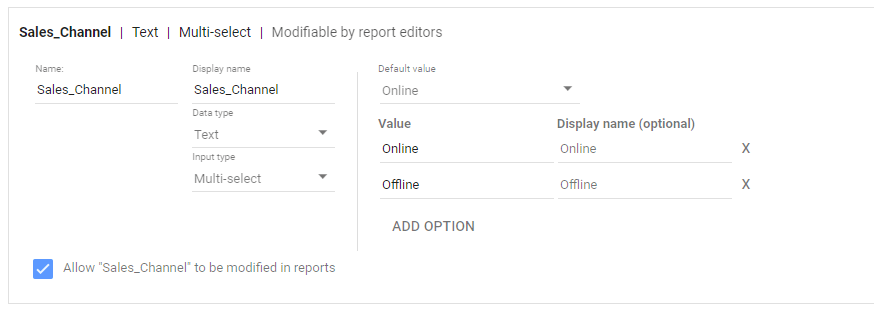
now you define the parameter ‘@Sales_Channel’, notice you have to type the values manually, for this example there are only two Values, Online/Offline
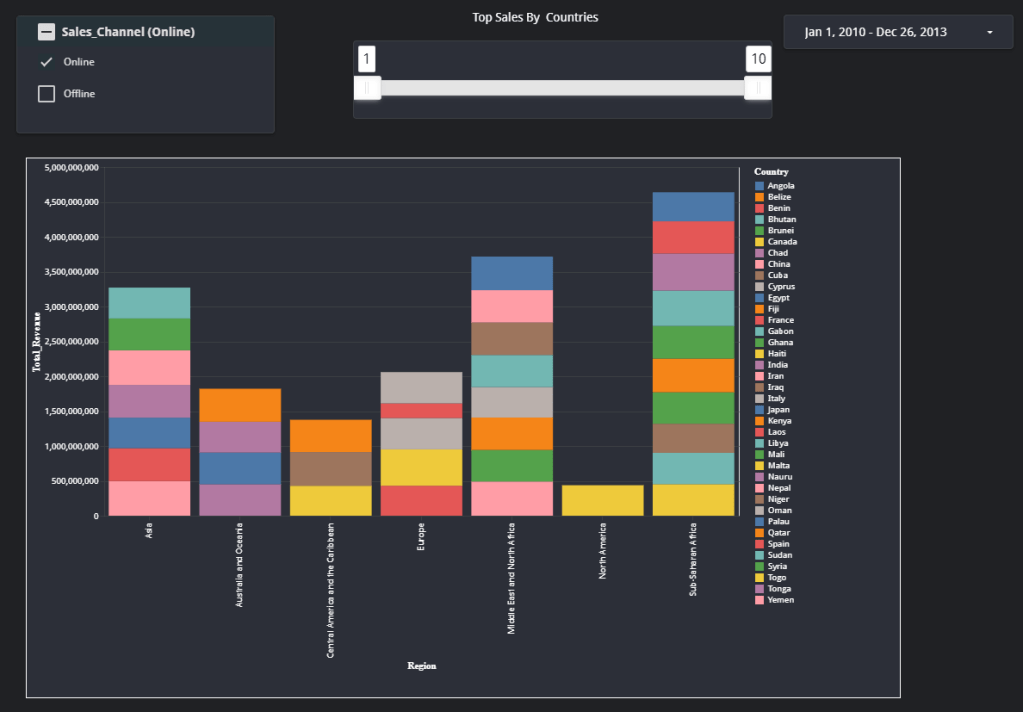
and here is the report, notice, I am using vega-lite custom viz as the native visual shows only max of 20 categories, the user will have the option to filter the Top 5,10 etc, it is a very powerful visual analytic tool

Unfortunately as of August 2020, BigQuery BI Engines does not support Analytic functions nor UNEST ( which is required for multiple selection of the parameter)

ok, someone may say ( I am looking at you piedatastudio ) that it was possible before and we don’t need parameter, which is true, technically we can show the rank for the three possibilities (Online Sales/Offline Sales, and both) and just use a UNION them add a filter to select the Sale Channel.
now to make it more interesting, let’s say they want to see the top performing based on a date selection, this year, this month etc, very easy using Dates Parameter
WITH
xx AS (
SELECT
Region,
Country,
SUM(Total_Revenue) AS Total_Revenue
FROM
GIS.salesdates
WHERE
Sales_Channel IN UNNEST(@Sales_Channel)
AND Ship_Date >= PARSE_DATE('%Y%m%d',
@DS_START_DATE)
AND Ship_Date <= PARSE_DATE('%Y%m%d',
@DS_END_DATE)
GROUP BY
1,
2)
SELECT
*,
ROW_NUMBER() OVER(PARTITION BY Region ORDER BY Total_Revenue DESC) AS rnk
FROM
xx
in this cases you can not pre calculate the results, as they are thousands of different combination for Date selection.
Please notice, as the Query is not accelerated by BI Engine in Data Studio, the report will incurs BigQuery cost, very negligible for small tables but still 🙂
I added a new report based on Covid19 dataset which is provided for free by Google.
