I have previously outlined an approach that can be used for Engineering Progress.
This post is an extension to that which instead of looking at engineering model development, instead looks at construction development. I don’t want to delve too much into the details about exactly how this was built (again see the post above).
Some big differences is that I have used a resource assignment view. in addition to the date metrics This allows for resources histogram and progress curves to be quickly sorted down to an activity level. This approach also follows a prior post Resource Analysis Dashboard .

The data
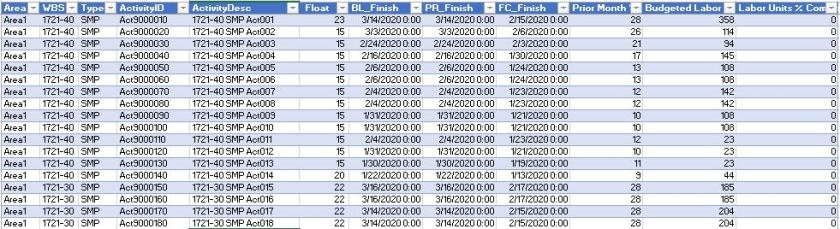
The underlying data is very similar to our engineering progress example. We can use a flat file export direct from P6 with a standard set of columns. As I have mentioned before, you can achieve this in a SQL query as part of a larger data model, although with everything, a delicate balance is needed (balancing database formalism and easy excel solution)
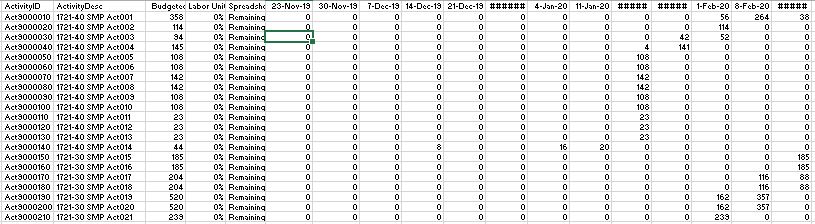
We will also have the resource assignment data
The WBS Slicer and Area Selection

This design element doesn’t work for project with too many WBS elements. For this example, each major area only has about 10 WBS elements, therefore I could pull this off with no drama. I really prefer this selection as opposed to drop downs where it is often difficult to quickly make selection.
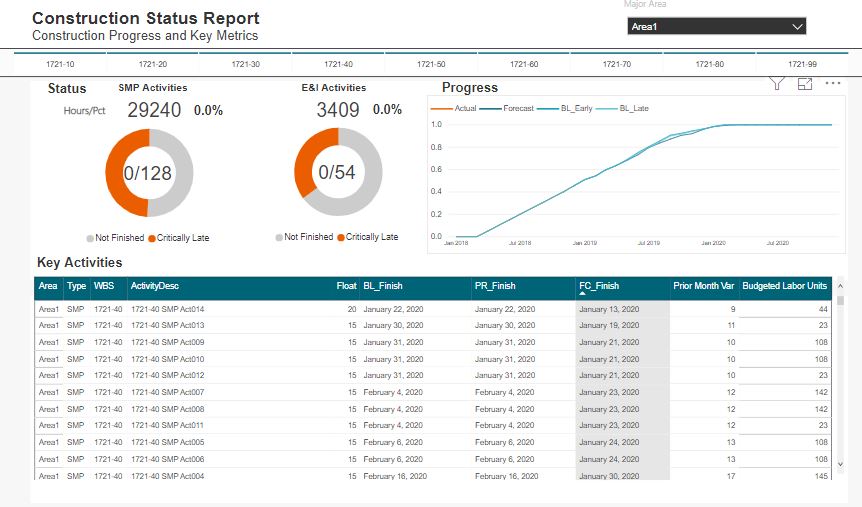
The Pie and Metrics
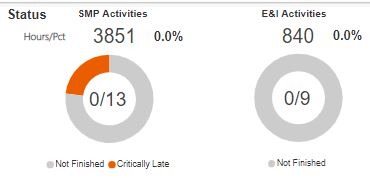
Here we follow much of the look and feel I used with the engineering progress; however instead of just using activity count metrics, I have also inserted hour and percent complete metrics. There is nothing fancy about these.
The Data Table
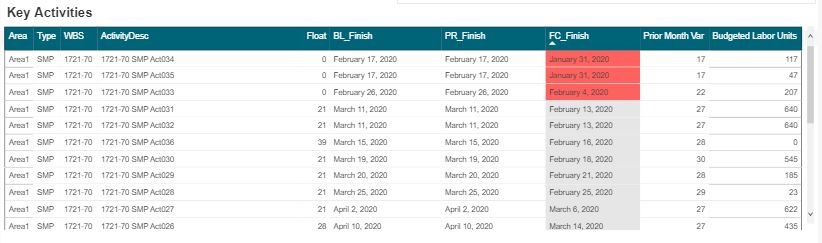
I’ll sound like a broken record again, when you have a good design with one aspect of a project, you can likely take that and run with it for many other areas. In a following post I will detail this systems engineering aspect to nearly everything we touch.
Obviously the key inclusion into the table is the budget units and %’s. I still prefer these tables views vs the GANTT views. Having clear visibility into the last month dates, the prior month dates, and variances is the purpose of this view.
The Future
Again, the extension of this are endless. At this stage, we are starting to see how pre filtered views provide more focused dashboard as compared to a one size fits all. Sitting in an EPCM world, most of the detailed activities and schedules are managed by our contractors. Thus, this construction view is more suited to using an export from a contractor Level 4 schedule.
At some point, we will need to begin to discuss an overarching design where a user can navigate to our various dashboard in a logic way.
Happy data wrangling!

2 thoughts on “Construction Progress Report – PowerBI – by Darrin Kinney”