I have dreamed about the ability to easily integrate many of my favorite applications. A few technological roadblocks had prevented me from pursuing this, but I am finally in a position to showcase what I view to be a quite seamless integration chain and management process.
Our key objective is to
- View our schedule activities
- Allow our area specific team to provide commentary on each activity (if we view the activity deviating from our plan or perhaps need to include notes about key interfaces)
- Allow our project wide team view our comments
- Provide a tool to present schedule and progress aspects of our area
Note that I still view JIRA as providing a tool that immediately makes this post redundant. Although, in lieu of everyone jumping on JIRA, let’s dive right into an interesting use case of common applications.
Primavera
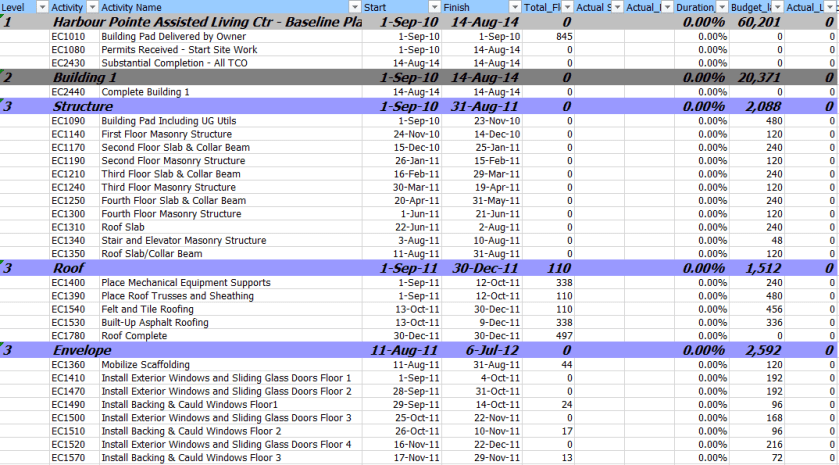
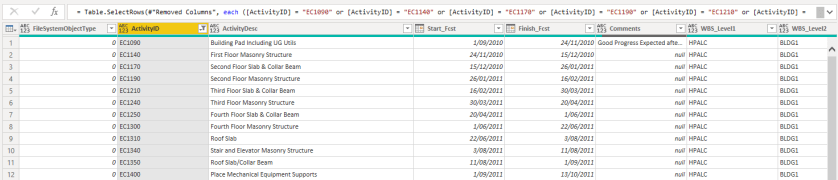
For this example, I am using dummy schedule data. The ideas here are quite universal and can be used with any schedule. Care should be take to ensure proper filtering to avoid ever displaying too many activities.
The key objective here is to be able to export our activities to Excel and then upload the data into a SharePoint list. Tools, such as XER reader, provide the ability to quickly move activities into Excel.
SharePoint
Here, a lot of interesting hacks and strategy come into play.
Digital Strategy – Enter Data Once
SharePoint is a perfect tool for editing data in one location, and to source it in many different ways without having to reenter it.
The first thing we need to do is create a list.
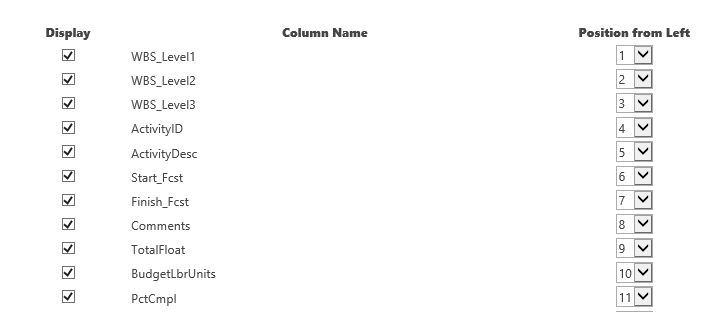
You can insert a few more columns to pull in Plan Dates, or prior updated dates. However, we are only looking at a comments functionality with this list. We can live with a very stripped down data set (and leave PowerBI to capture everything at a later point).


The above view is what you would see in the edit view on your SharePoint website. This functionality is fast and allows a team to provide a much more concise internal list of comments specific to each activity (or perhaps only key interface activities).
Where the above doesn’t work? It doesn’t work in situations where we might have a chain of comments. SharePoint allows effectively free text fields. We can enter multiple lines of data for each comment and include dates inside the comment for when the comment was made. There are more sophisticated data models that would allow for multiple comments to be actioned on each activity. However, this example is a lightweight solution — using easily available, off-the-shelf technology. From this point, we dive into your standard PowerBI template.
An URL with predefined filter criteria applied to the SharePoint list is simple. However, we need to use this with caution, because we may end up with 1000s of activities in SharePoint and it will be hard to update this in the future.
Microsoft Access
It is possible to directly edit a SharePoint list using MS Access. In this example, we get constant updates from our contractors on dates. Keep in mind, the SharePoint list is not the management tool for the dates or progress (however — looking at the above, it can be!).
To allow for the list to be bulk updated with new dates and progress figures, we can utilize a query in MS Access. I am a firm believer in the ability for MS Access to facilitate moving data between different systems.
PowerBI
In this example, I will be using an existing template I have previously discussed (follow this link to the Construction Progress Reporting post).
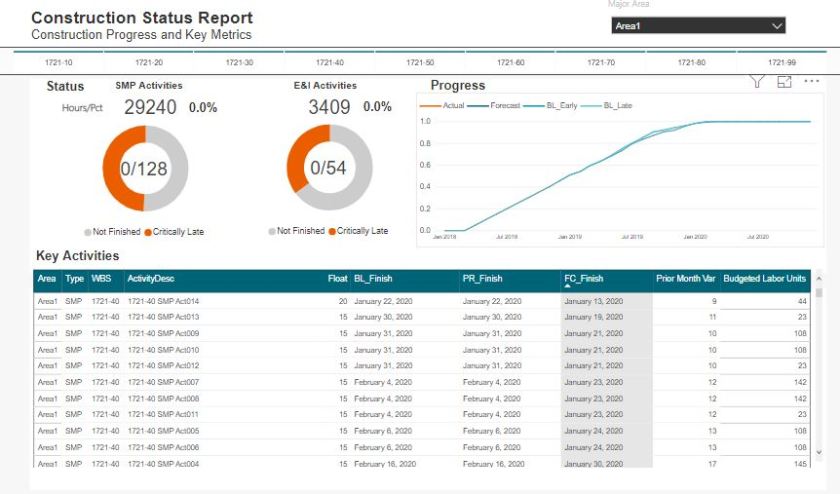
Where reports in PowerBI fall over, is that users have a difficult time actually being engaged as managers of the data. We do not have an easy ability to provide context or comments to specific data elements.
Here, we can immediately see that we can interface this dashboard with our SharePoint list. In our PowerBI queries, we can link to the SharePoint list.
As our schedule data is unique per ScheduleID, and our SharePoint list is unique per ScheduleID, we can link these 2 tables together and pull the comments into our table.

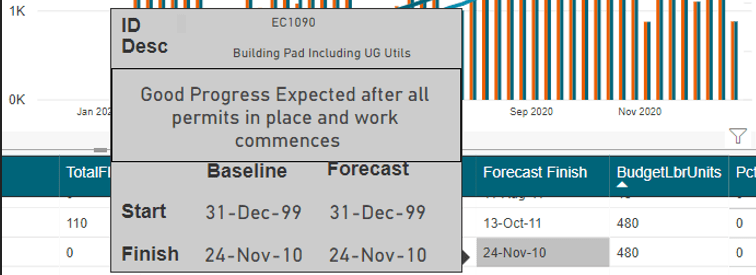
The resulting comment can the efficiently placed on a custom tooltip.
Extensions
As with any comment, it is important to include an indication of criticality. In the above picture, we don’t have an indication if a comment exists, and if a comment does exist we do now know if its important. Therefore, in our SharePoint list, we can use an extension to insert a traffic light in the cell. Then on the PowerBI visual, a traffic light is displayed using a small, colored circle. This would allow for quickly glancing at all the activities and being able to quickly drill into a critical comment.
This is different from looking at Total Float or Variations. Typically on-site, various activities have issues for various reasons that may not have anything to do with float or variances. These may be risk-related issues we are trying to prevent, or perhaps gets others to understand. This approach to comments is exactly what can lend value to a project.
