Edit: March 2022, I am keeping the blog post as it was my first impression at the time, but I have to admit I was wrong, Dedicated Pool is designed for Big Data Workload, Starting from TB, it does not work well at all for small dataset, basically I was testing it for a load that was not design for it.
for Data size in the 100 GB , SQL Server with columnstore index is probably a better option.
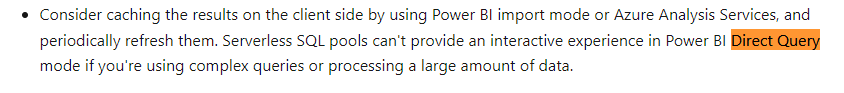
in a previous blog, I showed that Synapse Serverless is not great for interactive BI workload, which is rather obvious as even Microsoft don’t recommend it as a best practice
The logical next step is to have a look at Dedicated Pool ( ex SQL DW), where you don’t pay by data scanned but rather resource reserved, this model make more sense for a steady interactive Workload.
To be very clear, this is a real first impressed, I did not tried any optimization (to be honest I don’t even know how to do it), all I wanted is to get a feeling of the product.
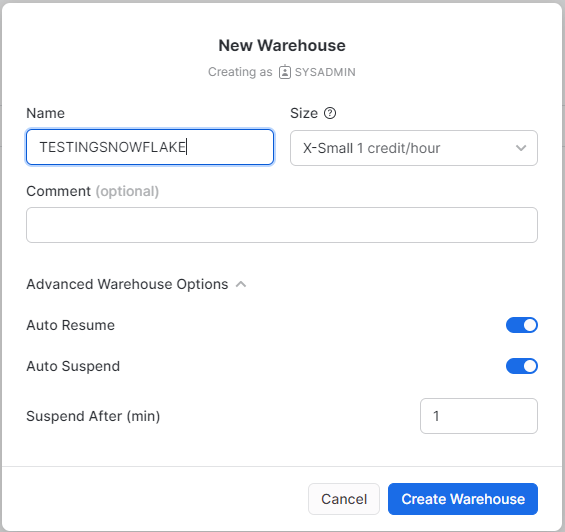
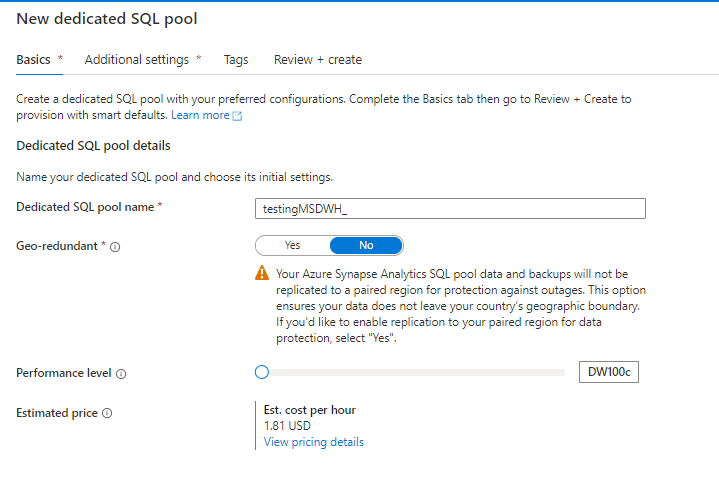
Creating a new cluster is trivial, notice, I have already a Synapse analytics Workspace, Microsoft is very good in creating integrated solution
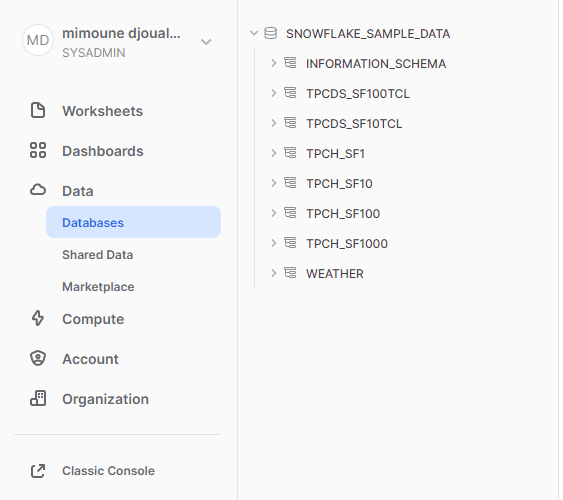
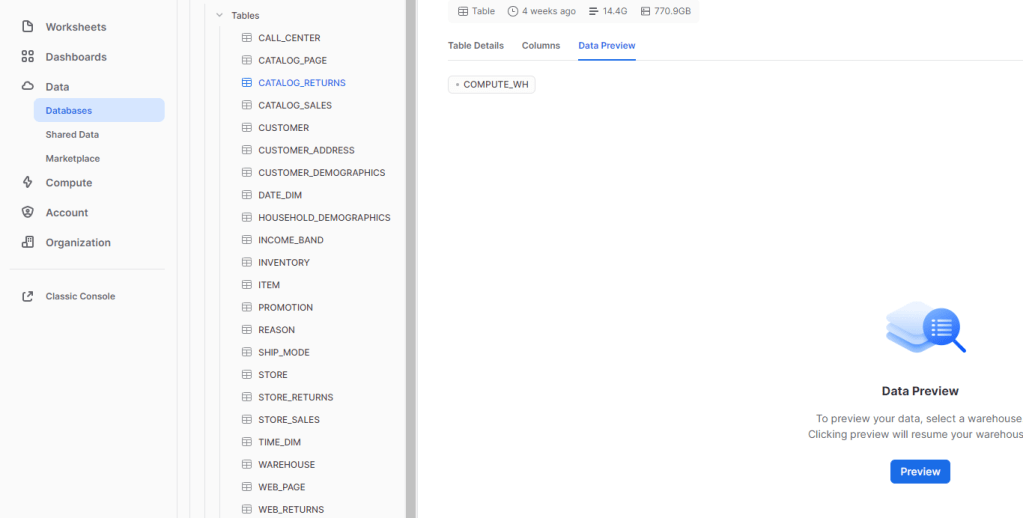
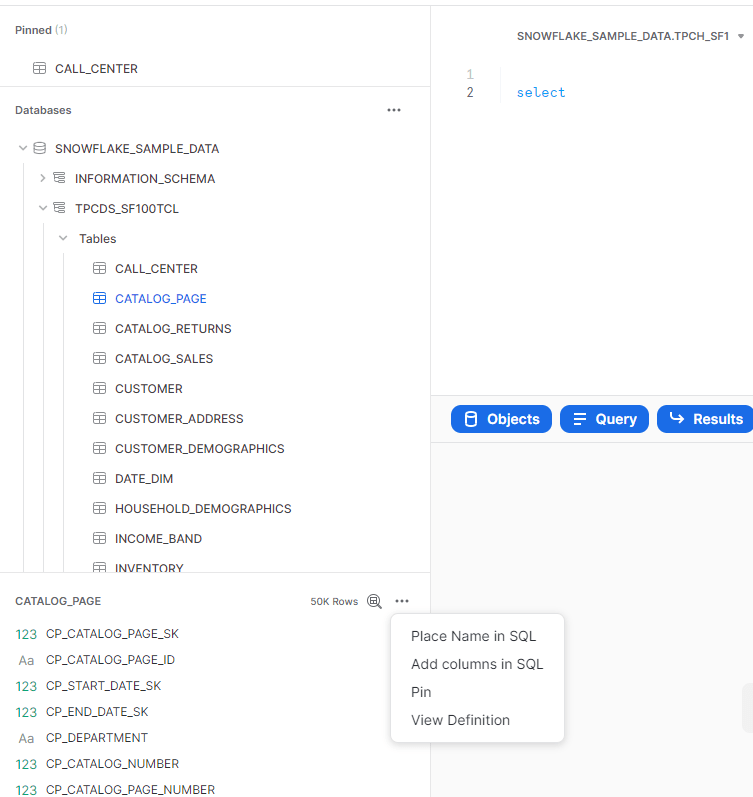
You can directly start running Queries from data store in Azure storage, see example here,in this example , I am selecting serverless here.
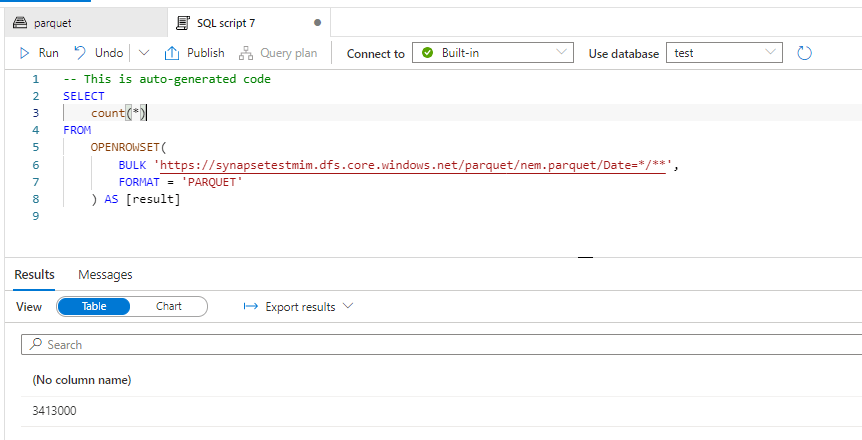
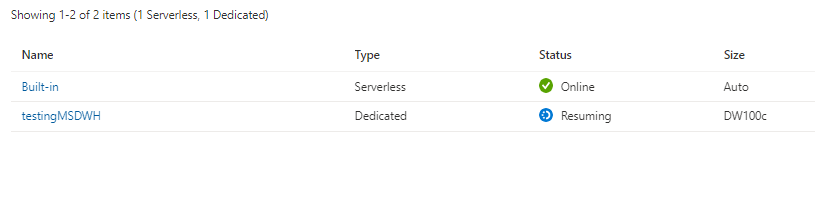
Now using dedicated Pool, I had first to start the cluster as it was suspended, you need to wait a couple of minutes
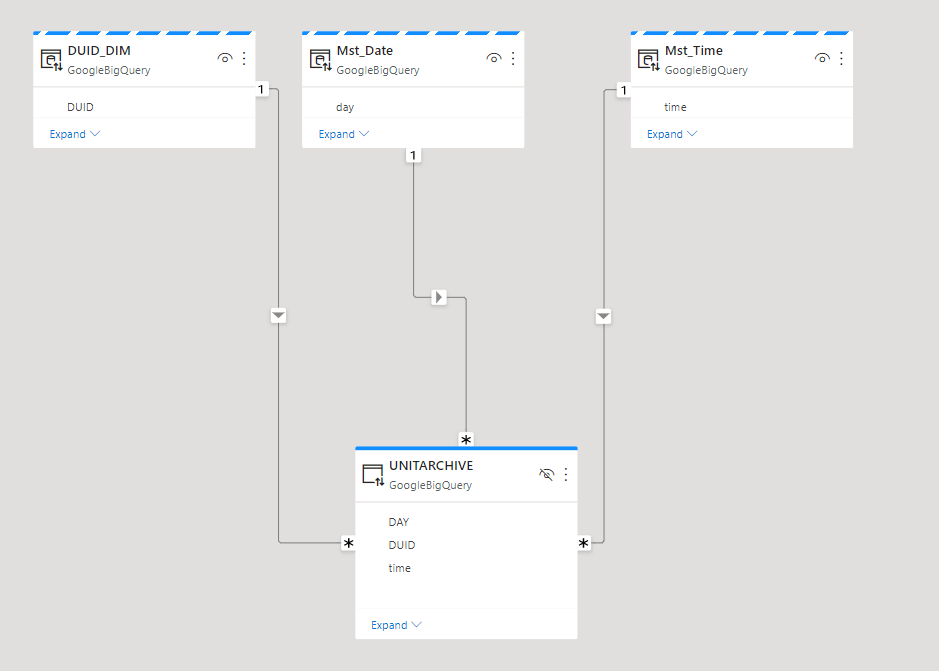
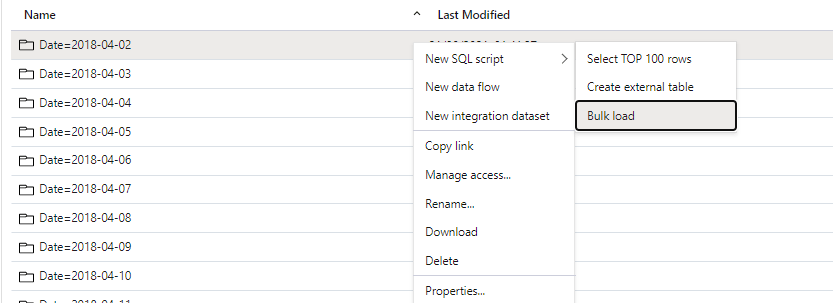
And for some reason, openrowset did not work, instead, I need to create External Table, still very easy

The GUI generate the SQL Script, very nice
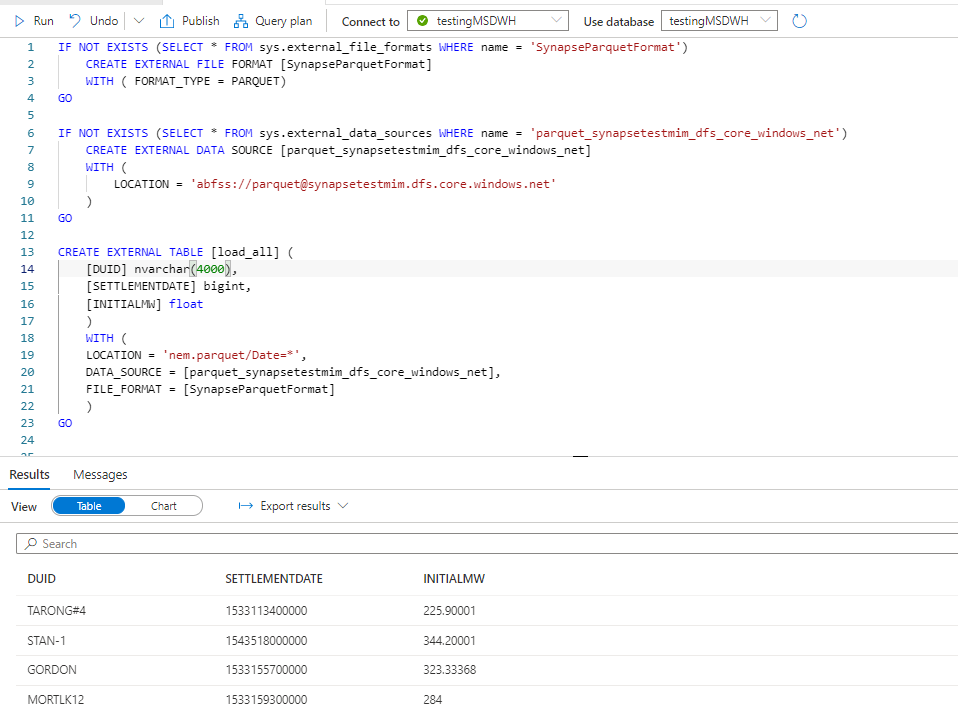
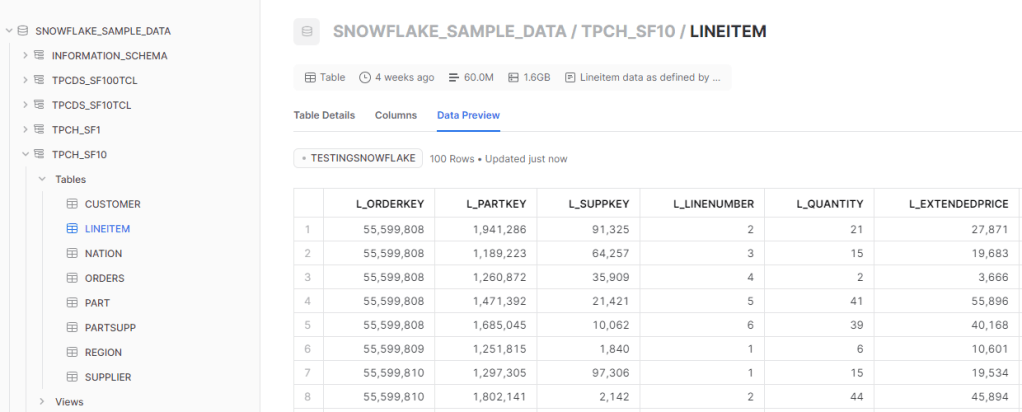
DUID is a short string, but I will leave the default value as nvarchart(4000), for some reason the column SETTLEMENTDATE is recognized as a number, it is should be a datetime ( maybe the issue is with parquet file itself), but that’s not a big issue for this blog. the point is you can Query your data lake files either using dedicated pool or Serverless
Native Storage
Dedicated Gen2 does not support a real separation between storage and compute, when you load a table, it has to be allocated to a specific DWH, and cross Query between DWH is not supported ( it is planned since 5 years).
Loading data is very easy, same approach, a GUI will generate a script
and here is the Script generated, I changed the text column to varchar(20)
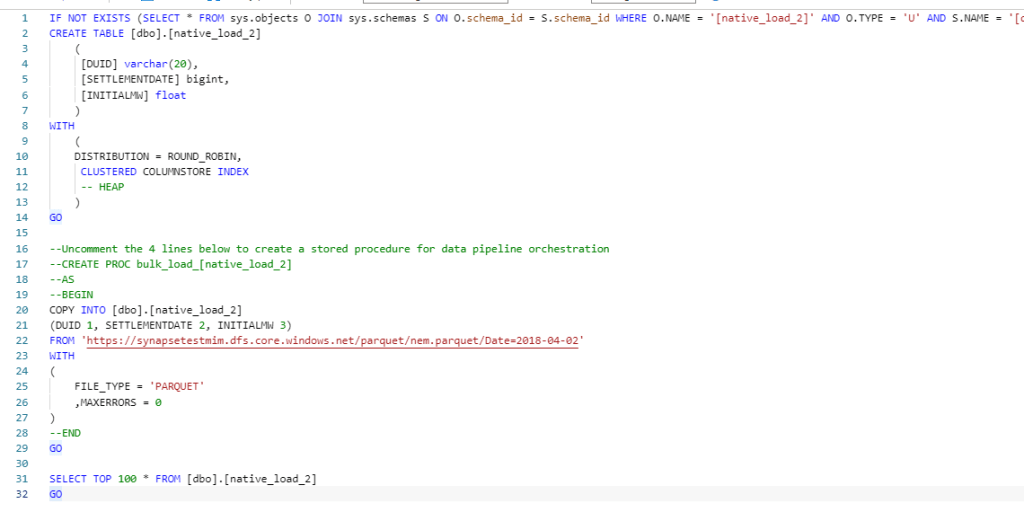
Now instead of loading only 1 file, I loaded 536 files, it took 8 minutes, that’s seems very slow
Performance
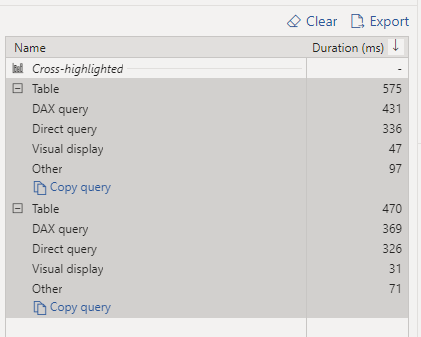
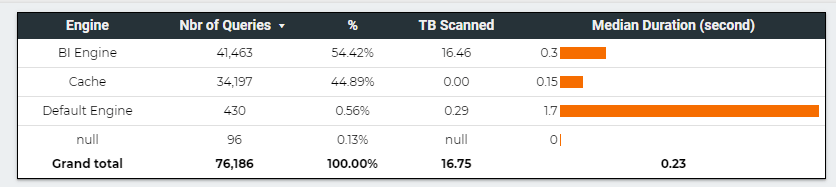
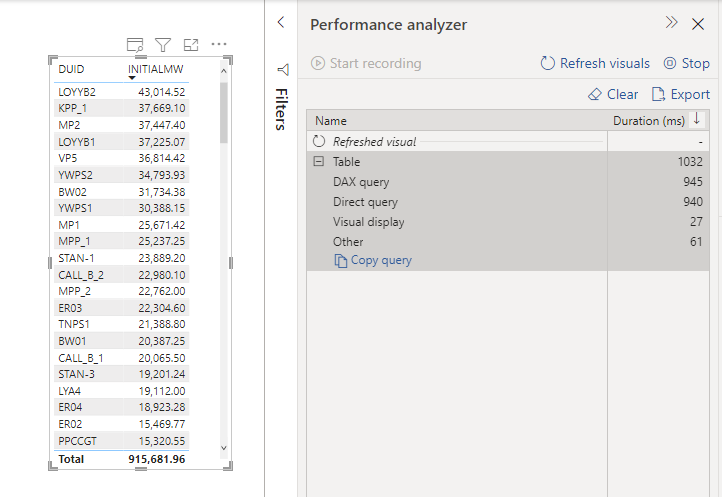
Obviously, it is not a benchmark, but just to get a general feeling, when I test it with a very small table, I did like the results in PowerBI (Direct Query took 940 ms and DAX literally 5 ms)
A bit latter, I try it with Another again , first I got this error
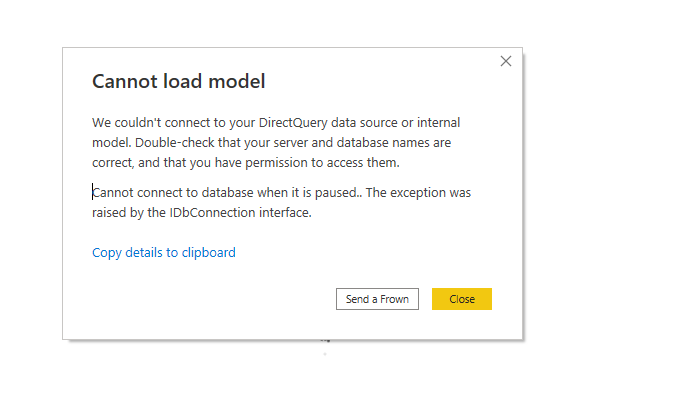
it was my fault, when a cluster is suspended, it will not wake up automatically when it receive Queries, you need to manually start it.
The PowerBI report is a simple Direct Query with some table, just to generate multiple SQL Queries
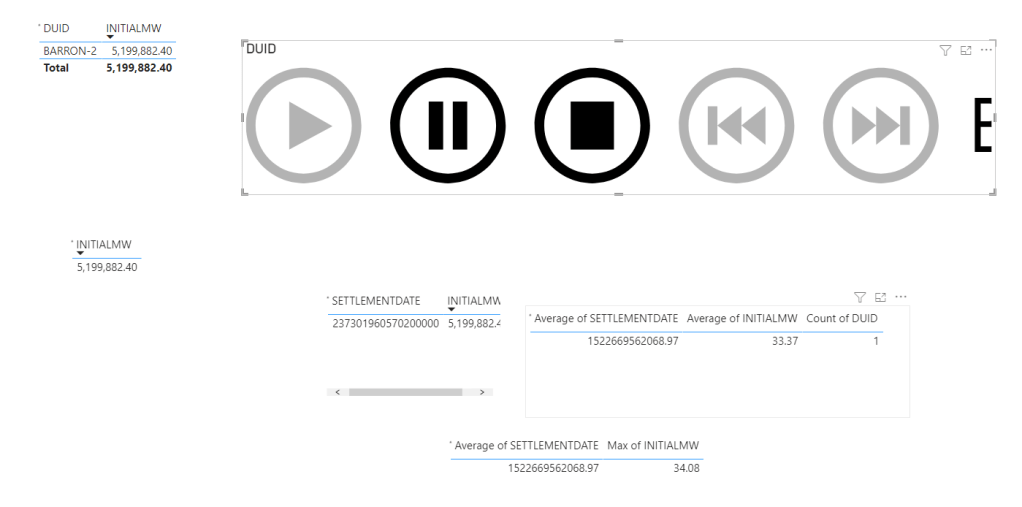
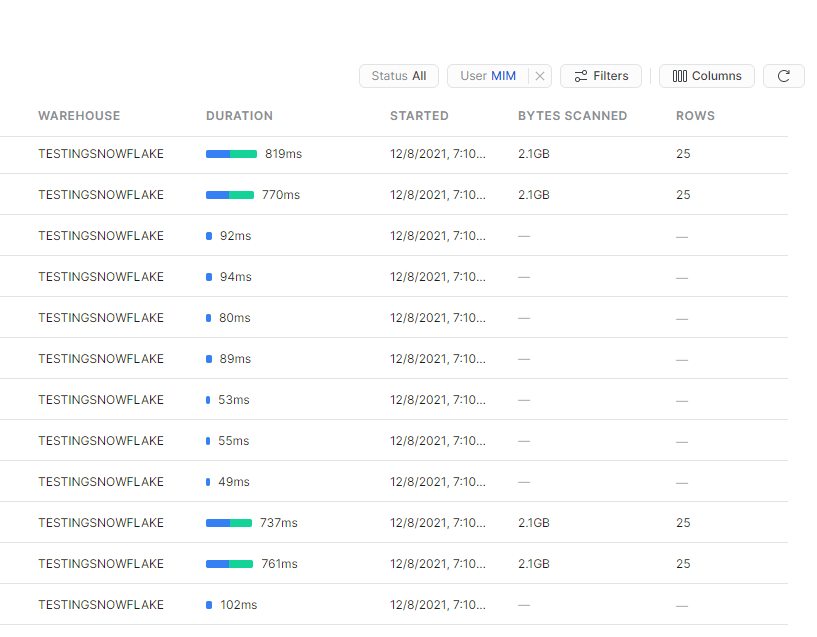
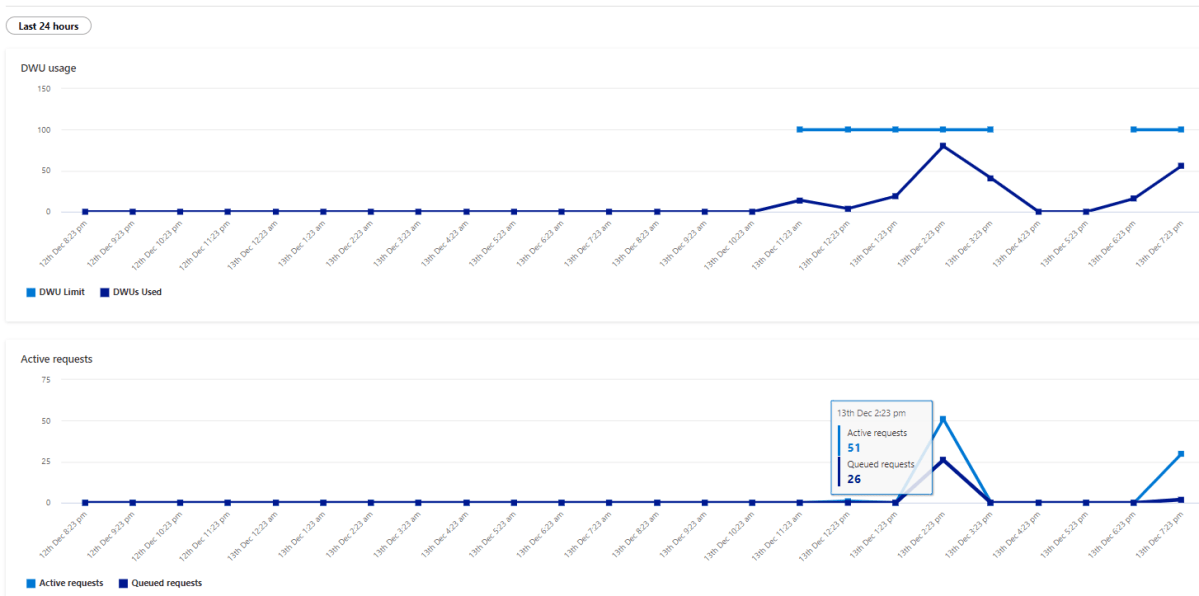
Initially it felt alright, but when I added another instance of the report, things start to feel slow, had a look at the service and SQL Pool has already started adding SQL Queries to the Queue !!!!

Take Away
The Good :
- Integration with Azure Storage
The Bad :
- 1.181 $/Hour is far from being cheap for an entry level tier specially that auto suspend does not Work.
- Dedicated Pool is the only major DWH that does not separate Storage from compute, you can’t simply spin up a compute and Cross Query another dataset.
The Ugly :
- Performance and concurrency seems particularly poor out of the box.
I am sure there are some optimization that can be done ; for example switch on result cache ( why it is not on by Default ?) maybe partition etc but I wanted just to give a first impression, and honestly color me unimpressed, Better Gen3 be Good.
Edit : got this feedback from Andy that DW100c is limited to 4 Concurrent Queries