A typical situation in the construction industry the progress data is sourced from multiple system with different format, generally we get two type of reports.
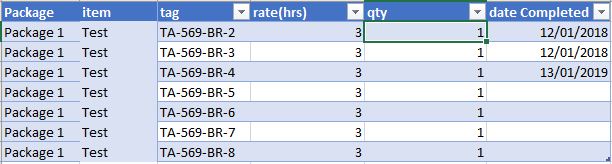
Time stamp items
My preferred one, the data is tracked at a very low level (cable, spool, pre-commissioning and commissioning tracking), and you get a date when the item is completed something like this
This format is very convenient as you need to maintain only 1 file, the history is recorded in the data itself unfortunately, this kind of report is not always available for multiple reasons, the main one is, in some kind of work to finish one item it will take longer period of time, for example completing 1 drawing will take 3 weeks, no manager will wait 3 weeks to claim a progress.
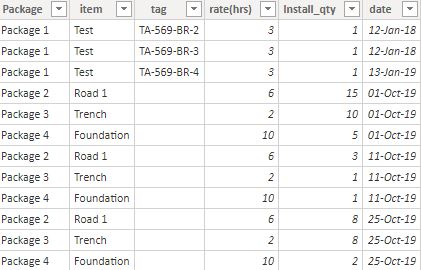
Cumulative Progress
This format reports the cumulative progress at a time period (daily, weekly, or whenever there is a progress) something like this
This is format is very common, it is very easy to update by the supervisor, and works with any level of details
the challenge of this format is
To get the historical data you need to keep all the previous files.
As it is cumulative data, calculating the progress per time period is a bit harder, and getting something like year to date is very awkward.
we need to normalize those files to be in the same format, one approach I use with PowerQuery is
Load the cumulative files.
Calculate the reverse total cumulative using self-join
Filter only the values where there is a progress
Append to the time stamp file.
Now we have a normalize Actual Table, where quantity per period, year to date and all date calculations are very easy to calculate.
I know it is tempting to just load data and start making visual and do some complex DAX calculation, but it is not sustainable and it will make your life miserable, a simple data model will make further development much easier.
In this blog, I will present a workflow, I have been using for
the last 2 years with a rather a good feedback.
Obviously, I like interactive Dashboard, I want everyone to
login to the PowerBI service and start doing their own analysis, but to my
dismay, not everyone is interested in doing that, a lot of users want only a
report that they can print. A took me a while to understand that that there is
nothing wrong with that, and in a lot of use cases, a printed report is the
best medium to convey information.
in my case, we do a lot of maps, and users want print
quality maps, and because the data change daily, you need automation.
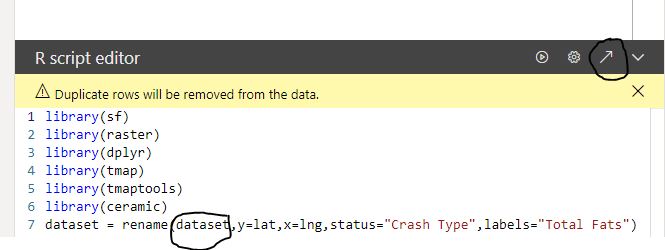
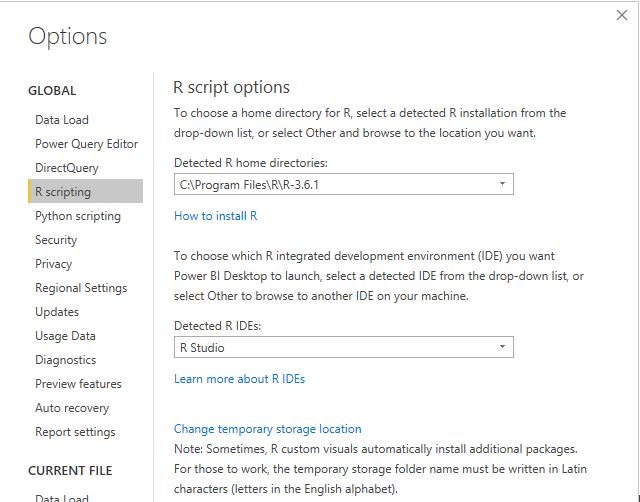
In previous blog, I wrote how to integrate PowerQuery with R, in the current blog, I will show how to generate multiple pdf with a customized map, by using R custom visual.
The PowerBI team has done a fantastic job, all you have to
do is add the R script visual, add the fields you need, which automatically
create a dataframe and write your code, and with one click, you can edit your
code in RStudio!!!
Rstudio Integration works by creating a temporary csv file
that hold the dataframe data
I personally prefer RStudio, but you can use any IDE
There are two caveats though
The dataframe has a maximum of 150k rows.
When you work in the desktop, it will use your R installation, all packages are supported, but when you publish to the service only the packages in this list are supported (ceramic is not supported, I think packages that downloaded external data are not supported), I found a workaround
Let’s generate some maps.
I am using the excellent package tmap for the mapping, you can customize any aspects of the map, layout, Text Size, legend, titles, it is really an amazing product and show the power of R, for tiles I am using ceramic .
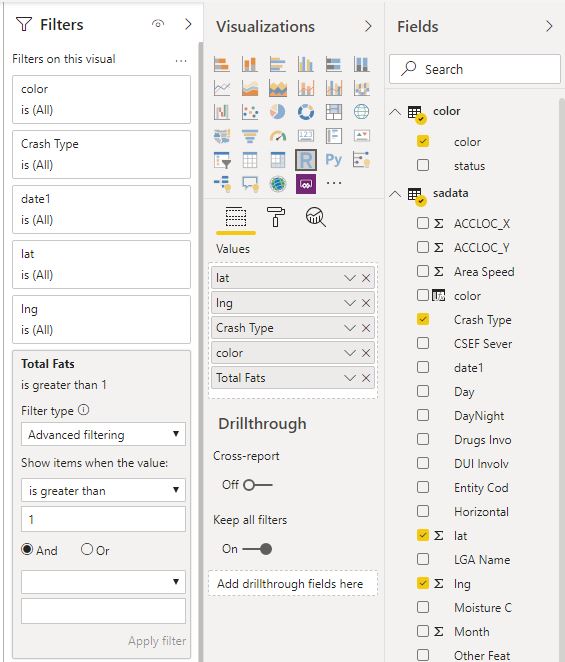
you need a Mapbox token (their free tier is very generous), I will use South Australia car crash data as an example.
Copy the same custom visuals and just change the filters
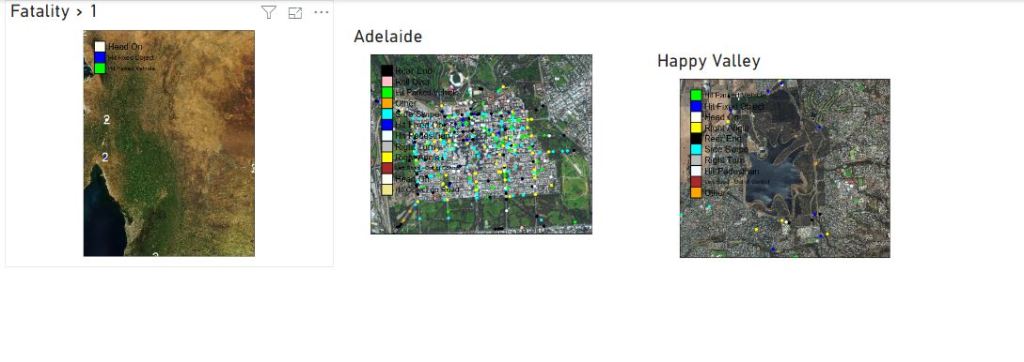
Here we go
Best part the pdf
files
Now you can share those files per email or save it in a shared folder. the map show only dots, but you can load polygon if you need to, see this blog for further details
You can download the pbix here, you need R to be installed, and your own Mapbox token.
In this blog, I will show how to leverage Python (or R) to implement an incremental refresh in PowerBI using PowerQuery and Python, nothing is really new ( I am sure Imke and Maxim has blogged about it before).
in a previous blog, I showed how to use R & Python integration to load data to a Database
This approach make sense only when you do a lot of heavy
transformation and your data source change based on time.
As an example, in my previous job, we receive a new excel
file every Monday (300K rows), this file gets approved and corrected every Thursday.
the workflow was:
save the files in a folder, do the transformation, which was fine , but after the first year, it was around 52 files, and although technically you need only to do transformation for the last file, and as PowerBI does not support incremental refresh, twice a week we redo everything, after two years, the refresh took nearly 30 Minutes and sometimes we get out of memory errors.
in the big picture,Half an hour was not that bad (we have a desktop just for refresh), the worst was, you refresh the model and once you finish, you get a new revision and you must refresh again.
Now using Python/R script, the idea is every file get transformed only 1
time, regardless of how many times you refresh, just by exporting the
results of the transformation of every file as a csv in a staging folder.
The first run is slow, as it will process all the existing files in Source Data, but the subsequent run, will transform only new files.
Let’s say File 2 was revised, all you need to do,is to delete File2.csv and it will be transformed again, but only that file.
Ok, if you see step 4, the files are reloaded each time, I am not too much worried about that, as the batch loading of csv files from a folder using PowerQuery is relatively fast (yes, a bit slow compared to R), the bottleneck is rather the transformation.
the code for python script is here, as you can see PowerQuery integration is amazing, just add a new step and you get a dataframe, that’s all,
the script split the dataframe by the column filename, and then export each file separately, currently it is saving into a local folder, but you can easily save those files into a cloud storage
to test it, I built a quick workflow using public data, PBIX here, the source data is zip files in a public website, there is a new zip file daily, it is relatively complex transformation as you need to unzip the file split it, delete some columns etc, the first run is slow, as it is processing all the files (62 files), but the next run, will just process 1 file, you can simulate that just by deleting some csv files in the staging folder, when you refresh again, only the files deleted will be processed again.
I think the main take away is, Python and R integration are amazing tools to implement new possibilities that will not be necessary available in PowerBI, and you don’t need to be a programmer to use those integration, a serious search on stackoverflow will get you started quickly.
This article addresses to all the schedulers and project professionals who import schedules into scrubbing P6 databases, remove undesired data, export the cleaned XER, and then import to a production database or share with third-parties such as contractors or sub-contractors.
If it happens to you to go through such a process, then you might want to read this article and see the better way to “clean” a XER file, prevent external data from corrupting your database thus maintain security and keep schedule integrity.
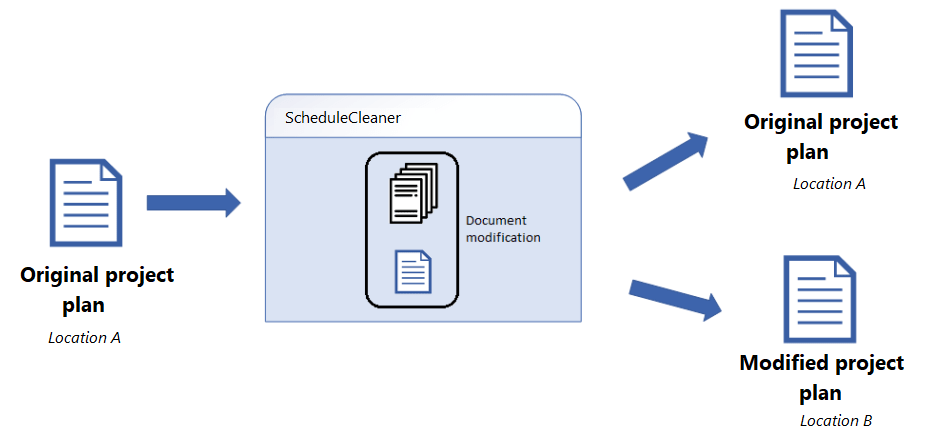
You can achieve this with a simple tool called ScheduleCleaner.
Now, I want to explain how the tool works and how you can benefit from it.
How to get started with ScheduleCleaner?
ScheduleCleaner is a desktop application for Windows operating system. It’s not connected to a database, and does not require internet connection to use it.
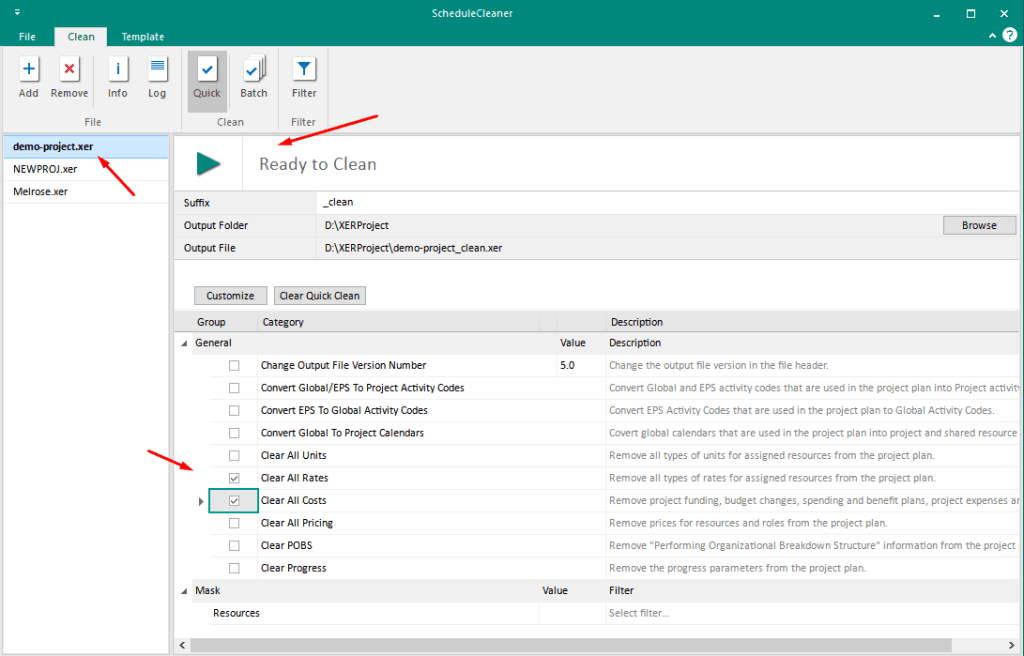
The “cleaning” process of an XER file can be achieved in 5 steps as explained below.
Launch the software;
Add an XER File;
Select the output folder;
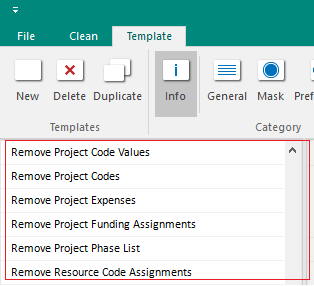
Click on the categories of data you want to remove;
Click “Clean” button.
As you can see, there is no manual work, no editing of a XER file in Notepad, and no scrubbing databases.
The software is intuitive, easy-to-use, and works offline as a standalone desktop application.
What’s more important, the software does not modify the original project plan. Instead it creates a copy and modifications are saved in the new file. The original project plan remain untouched.
Now, let’s see what you can accomplish with this tool in more specifics.
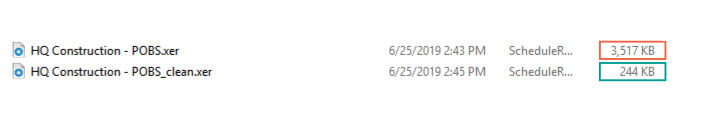
Removing POBS
If it takes a lot of time to import XER file intro Primavera P6 database, POBS data might be the reason for that.
Overall, the POBS defect affect the performance of the application and users lose valuable during the import operation. According Oracle, the POBS data is not used yet:
“We do not utilize the POBS table yet we export/import the data from this table when completing XER Export/Import. The XER export/import should be written to exclude this data with XER export/import operations of P6 Professional.”
The removal of POBS data can be done manually, but the process is prone to errors and can be time consuming.
The impact of all these errors when managing global data in an enterprise, will ultimately result in a polluted database and unconscious mistakes on a project level.
So using a tool for removing POBS data is desirable.
You can see a significant difference of the file size before and after cleaning POBS which greatly affects the time needed to import XER file into a Primavera P6 database.
Imagine the time that can be saved for larger XER files.
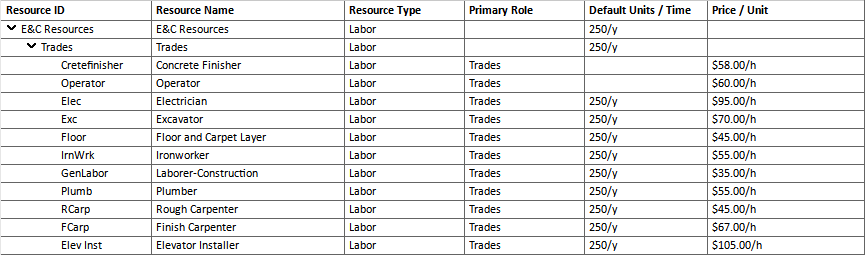
Remove Units, Rates, Cost, Pricing, Progress
As the purpose of exporting data files in XER format is to transmit project data to another database, in many cases data should be kept private. For example, a general contractor wants to send the project to a sub-contractors, but without the cost of resources.
Another examples is related with the GDPR regulation. Namely project schedulers and managers share files that contain sensitive information such as resource names that can disrupt the guidelines of the GDPR.
To be GDPR compliant, companies need to hide/anonymize confidential information, and ScheduleCleaner is the perfect tool to easily and securely protect sensitive information.
Just by clicking checkboxes, users who want to share the XER schedule can pick certain categories of data that want to be removed from the schedule before sending to third-parties or upload to a Primavera P6 database.
Before “cleaning” prices
After “cleaning” prices
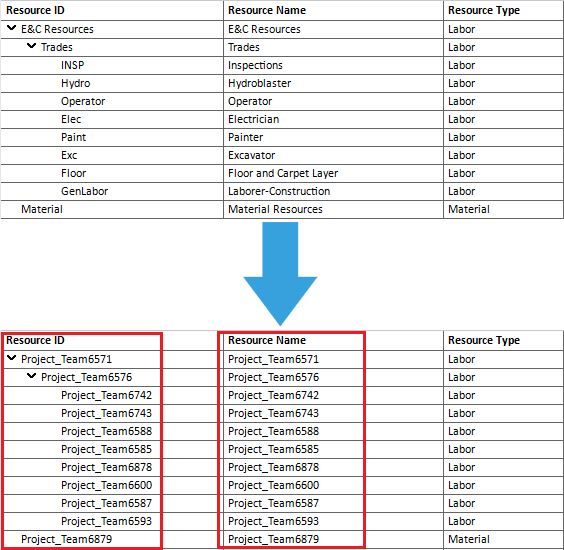
Mask Project Data
Similar as removing certain categories of data, you can also mask project data.
The only difference is that with masking, you can add custom codes, labels or text for the specific categories.
Add Prefix/Suffix
Inserting prefix or suffix to different categories in the project plan, can give additional information to the person who reads the information and acts according them.
To add Prefix/Suffix, you need to select the template that will contain Prefix/Suffix, select the appropriate category, and add the terms that will be words’ prefix or suffix.
Then, you go to “Clean” ribbon and click on the “Batch” button. The end result when adding prefix/suffix are given in the image below.
Converting Data
The software features an option to convert Global and EPS activity codes to Project Activity codes and EPS to Global Activity Codes. The activity codes are important to schedulers and planning engineers when creating different types of work performance reports.
So here are the type of categories that can be converted with ScheduleCleaner:
Convert Global/EPS to Project Activity Codes.
Convert EPS to Global Activity Codes
Moreover, you can convert Global calendars that are used in the project plan into project and shared resource calendar. In this way, you will avoid errors when importing the XER file into P6 database.
Save time with process automation
Who doesn’t want automation? Automation saves time and gives a sense of comfort and security.
Here, it’s not actually a full automation because you still need to click on a button in order to perform an action or combination of actions. But this is quite useful when you have a set of actions that need to done on a daily basis such as sending a daily progress report to top management or uploading recent progress into a database.
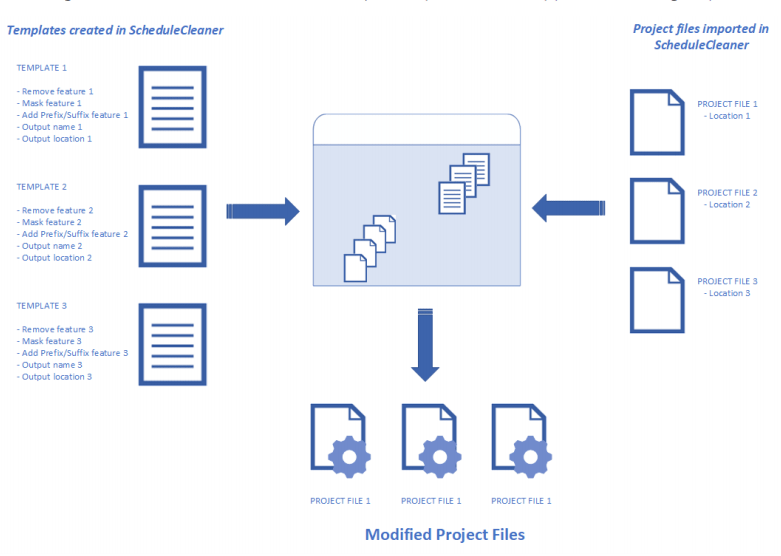
Automation is ScheduleCleaner is viable through creating Templates, save them and apply to imported XER files.
Batch Clean
“Batch Clean” is a feature that works with templates. User must create at least one template and assign it to a file in order to use the batch file cleaning.
“Quick Clean” on the other side is more suitable when user wants to modify very small number of project files, while “Batch Clean” is useful when large number of data files, usually located in different folders, need to be modified.
Final Words
ScheduleCleaner enables you to quickly remove or anonymize confidential data in XER data files exported from Primavera P6, while keeping the schedule integrity.
It replaces the many work when “cleaning” XER file prior to sharing the file or import to a production database.
As the manual process of removing or anonymizing project data is time-consuming and unreliable, performing Batch Clean in combination with Templates can speed up the process.
Organizations can significantly improve their productivity, communication and security by integrating ScheduleCleaner in their working environment.