A typical situation in the construction industry the progress data is sourced from multiple system with different format, generally we get two type of reports.
- Time stamp items
My preferred one, the data is tracked at a very low level (cable, spool, pre-commissioning and commissioning tracking), and you get a date when the item is completed something like this
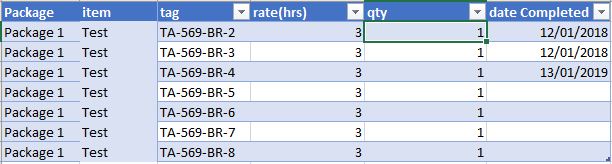
This format is very convenient as you need to maintain only 1 file, the history is recorded in the data itself unfortunately, this kind of report is not always available for multiple reasons, the main one is, in some kind of work to finish one item it will take longer period of time, for example completing 1 drawing will take 3 weeks, no manager will wait 3 weeks to claim a progress.
- Cumulative Progress
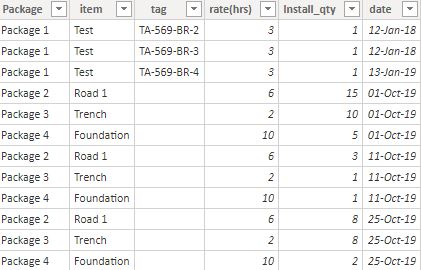
This format reports the cumulative progress at a time period (daily, weekly, or whenever there is a progress) something like this

This is format is very common, it is very easy to update by the supervisor, and works with any level of details
the challenge of this format is
- To get the historical data you need to keep all the previous files.
- As it is cumulative data, calculating the progress per time period is a bit harder, and getting something like year to date is very awkward.
we need to normalize those files to be in the same format, one approach I use with PowerQuery is
- Load the cumulative files.
- Calculate the reverse total cumulative using self-join
- Filter only the values where there is a progress
- Append to the time stamp file.
Now we have a normalize Actual Table, where quantity per period, year to date and all date calculations are very easy to calculate.
The pbix files and the source data is saved here
I know it is tempting to just load data and start making visual and do some complex DAX calculation, but it is not sustainable and it will make your life miserable, a simple data model will make further development much easier.
