Create a PowerBI Resource Analysis Dashboard – by Darrin Kinney

Feel free to provide comments directly to my LinkedIn Post that references this article and contact me directly – Darrin Kinney

Some content in this post is perhaps superseded by PowerBI Progress & Schedule Dashboard.

Getting the right structure for what a PowerBI dashboard can do in relationship to construction projects is not a 1 sized fit all approach, so really this post is meant to just focus on some of the data elements, which again have been perhaps better presented in the new link above

Analyzing  resources in P6 is a common responsibility of all planners. However, ultimately the data typically stays in the realm of the planner, and never properly given to the specific project managers and project engineers who actually need to execute the work. Thus, there exist a huge opportunity in the digital world to extract data from P6, and present it to the masses. Planners are penultimate professionals in this. We live for this. We take the resource assignment data from P6 and work our magic in excel creating a suite of reports and graphs (s-curves).

However, all the excel work is customized. The ability to quickly drill into the data from the data table or the graph is just too difficult for management. The need to create custom graphs, takes time. Instead, we can create something quite amazing using PowerBI.

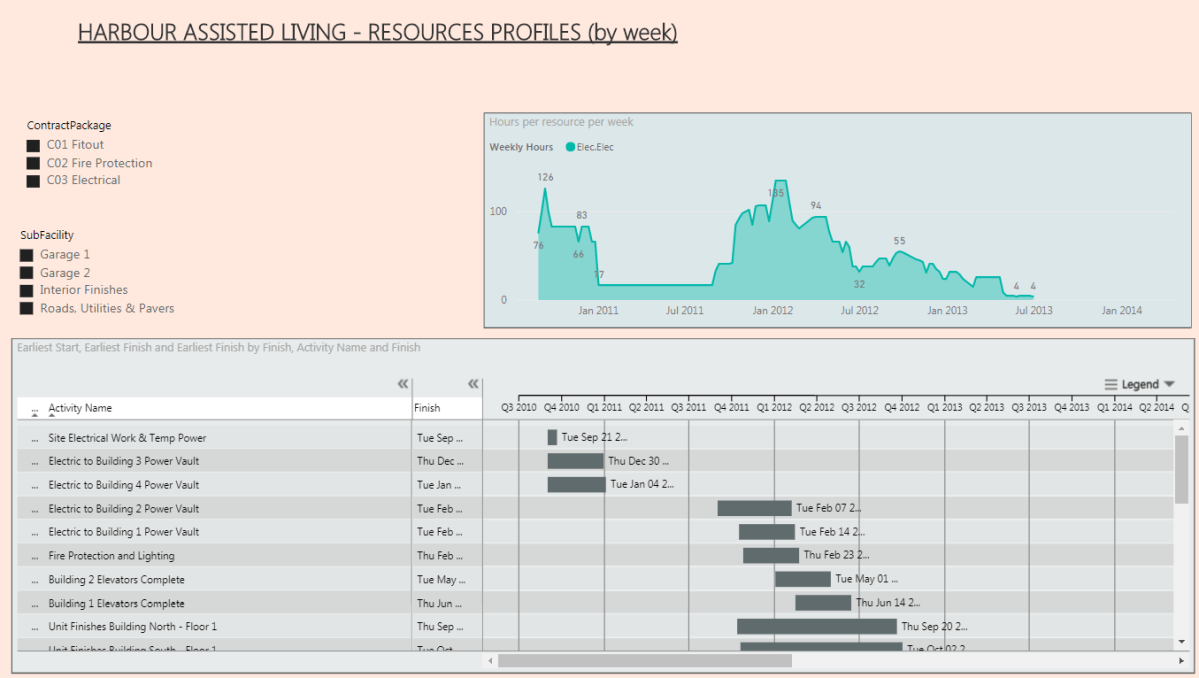
Using PowerBI we can create a simply easy to use dashboard that provide nearly unlimited flexibility to display both schedule and resource information to any user on a project. The below is a walk through to create a simple view with a simple schedule. However, I have run this through a schedule with 5,000 activities and multiple resources including both manhour resources and quantity resources. It is situations where you have data overload that PowerBI shines. Get the data out from the planner, and into the hands of the project management group.

Step 1 – Get resource assignment data

Using the resource assignment tab in P6, remove all the grouping and just display everything. You will want to ensure some key fields are available: Start Data, End Data, Resource Data, Resource ID and Type, Activity Name and ID, plus some WBS and grouping data (ex contract).
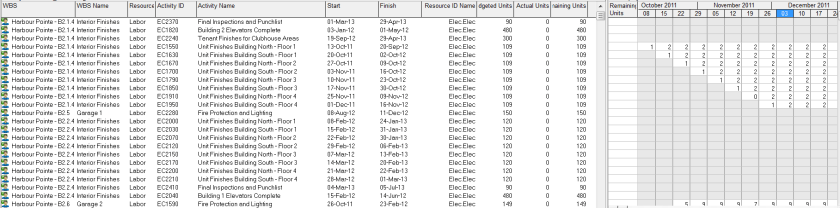
RA_2_P6_resources

Step 2 – Copy-Paste Resource Assignment Data into Excel

A simply copy-paste from P6 into excel will suffice. It is really that easy. Sometimes the data from P6 may not contain the right descriptions, so this is an opportunity to use some vlookups (or Index(Match()). The data also needs to be presented in a table. Select All and use CNTL-T to convert to a table.

RA_3_excel_table

Step 3 – Unpivot Data using Power Query

This step can be done directly inside PowerBI Desktop, or in perhaps a more flexible excel environment. I prefer to do as much data handling in excel to reduce the complications once inside PowerBI; however, many options exist.

Inside Excel (ensure you have power query add in), select the columns with the dates, and click “UnPinvot Columns”. Close and Exit.

After running the unpivot, you will see each data column turned into a row. This is an easier data format for use in databases and a trick universal not just for powerBI, but anytime you might be dealing with databases.

RA_5_powerq

Step 4 – Import Into PowerBI

PowerBI has very quick and easy import routines. This post is not meant to be a specific click by click guide. There are easy import routines you can find to import excel files. Again, as indicated above, just make sure your data is converted into a table. You can directly create a datasource using something similar to the below

=Excel.Workbook(File.Contents(“C:\Users\Name\Downloads\P6_resource_Assignments_HP.xlsx”), null, true)

Step 5 – Create your PowerBI Elements : Gantt, Graph, and Slicers

GANTT

The PowerBI file uses a custom visual you can download for free from the marketplace

GANTT by MAQ Software

The parameters you will want to use are roughly as noted below

GRAPH

The PowerBI file use AREA CHART. This is an easy to use built in graph feature of PowerBI. You can use potential extension of line graphs to show a % Complete curve. However, from a base usage, the area chart provides the easiest visual.

A nice trick in the overall dashboard is to align the data range of the GANTT with the GRAPH. I have found some limitations to this exist, but in this example, it worked quite nicely.

SLICER

The real power of this visual is through the use of slicers. Slicers allow for immediate filtering based on a variety of selections. This visuals uses a range of filters for Contract, Facility, SubFacility and ResourceID. Depending on the structure and data you extracted from the P6 resource assignment, your options here are unlimited.

Conclusion

This example just scratches the surface of what is possible. I found the above to be immediately useful to our project team in clearly visualizing the resources required over time. There is some manual effort to keep the source excel updated after changed to P6 – this is not a live linked datasource. There are numerous possible development extension people can use to customize this.

The biggest critique to the dashboard is the lack of visibility into the Baseline dates and plan curves. For this, we can only hope someone builds a more robust custom visual to accommodate this. In the end, happy planning.
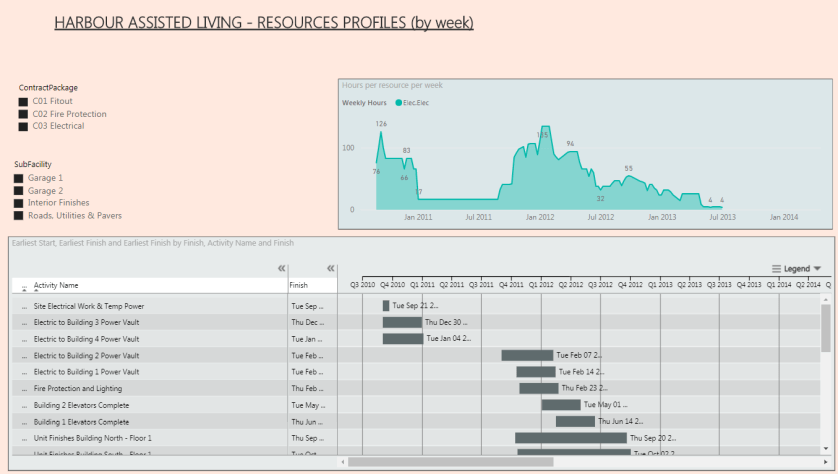
RA_1_Final

Using Powerquery List.Dates to generate time phased Budget and account for holidays

There are plenty of templates on the internet on how to spread a budget using Excel formula, in this blog post we will use the Powerquery function “List.Dates”, and a calendar table to account for holidays and periods with less working hours, for example under extreme weather conditions, the working hours per day will be less than standard working hours.

Obviously Planning software handle this scenario very well, but contrary to popular belief, Excel is still the most widely used planning software among non-planners. (I have yet to see a cost controller or QS using a planning software, even MS Project).

The function is straightforward:

List.Dates(start as date, count as number, step as duration)

In this case, count will be the durations in days, and step will be 1 day

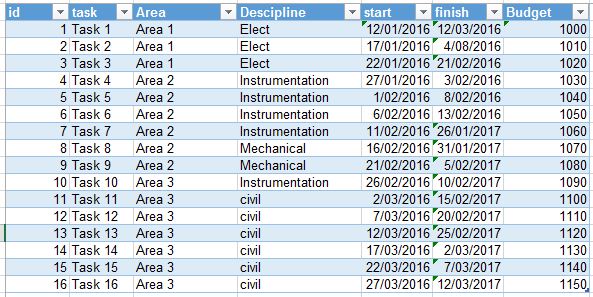
Let say you have a list of tasks, with a start and finish date, and some kind of budget, (cost, revenue, quantities, Effort required etc).

Budget_0

Let’s load the table Task and generate the spread.

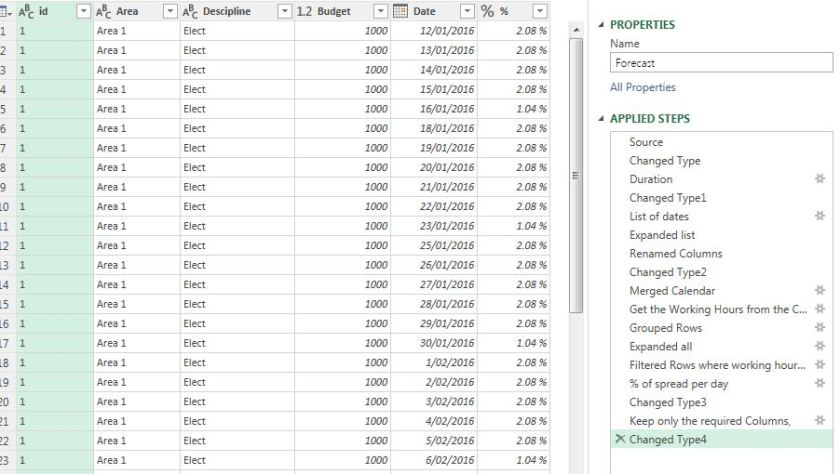
  • First we calculate the duration ( Finish-Start)
  • We use the List.Dates to generate the list of dates between the start and finish of every task.
  • Expand the list to become a column.
  • Merge the list of date with the calendar table to get the working hours per day.
  • Now we sum the total working hours per id.
  • The % by day = working hours per day/ Total working hours per task.

Budget_1

Voila, you have % per day.  Now to spread the budget, just multiply the budget by % per day.

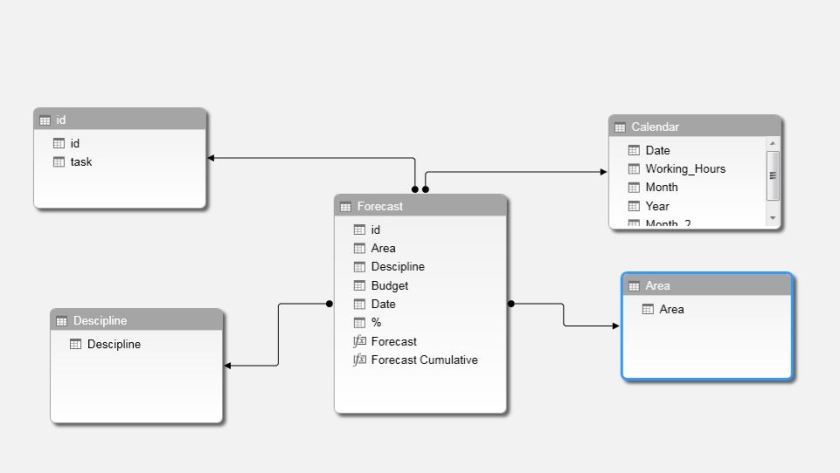
Then we load some dimensions table in order to slice and dice the pivot table and WE add a measure to calculate cumulative Budget time. As we are using a calendar table, we can show the budget per day, Month, year or any time period.

Here we got a nice little Star schema

Budget_2


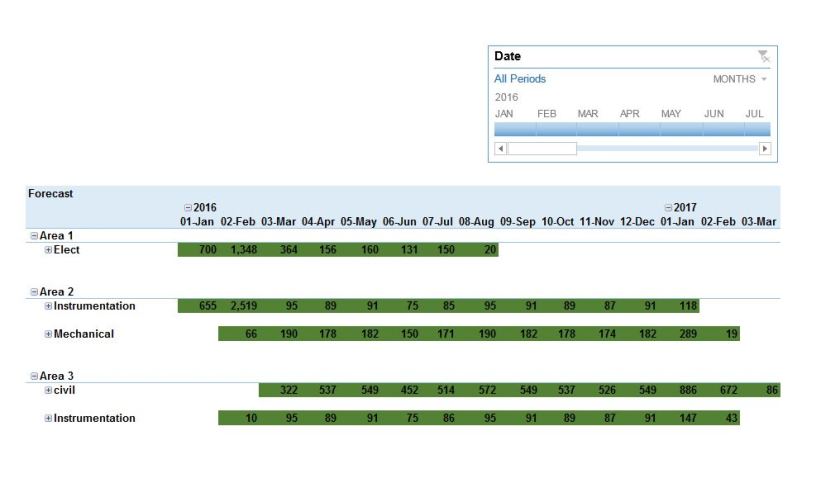
Now a Pivot table with conditional formatting will show a Gantt like chart.

Budget_3

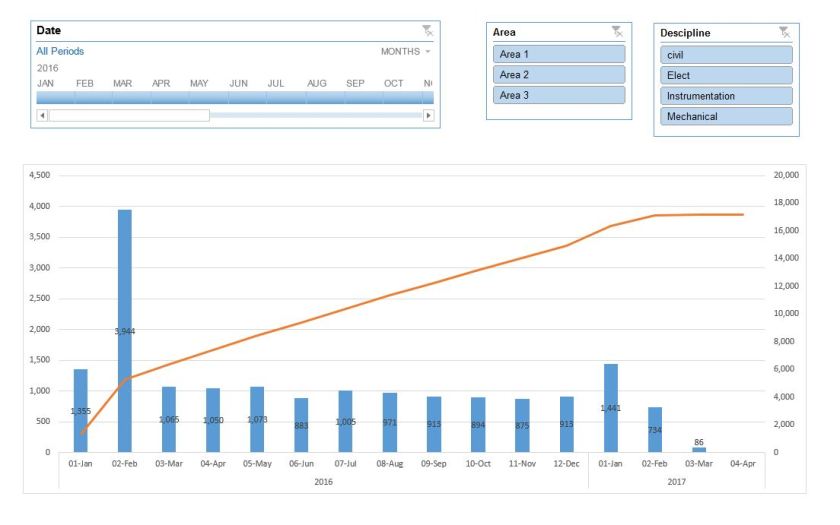
And a pivot chart to show the Budget per Period and the cumulative.

Budget_4

You can download the template here, you need Excel 2013+, if you don’t have it, you can always download PowerBI desktop for free, and import the Excel file, but you need to redo the charts though.


Integrated Project Control system using PowerBI

One of the most popular discussion in planning forum is how to have an integrated project control system, every practitioner has a different opinion how it must be done, and of course you get a lot of marketing from people trying to sells their systems

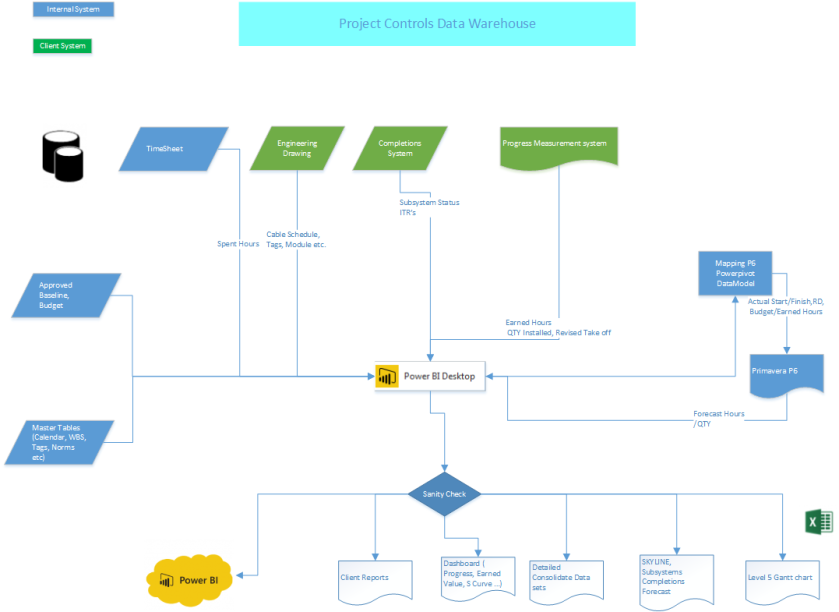
In this blog, we share high level description of a data warehouse built using PowerBI desktop.

Data warehouse are not widespread in the construction industry, because the reporting specifications are different from project to project, and every client has a different systems and tools, and trying to have a standard system works only if you are the main contractor but if you are a subcontractor you have to adopt the client system.

Another reason is; it required a specialised IT skills, we are just business users not programmers, we do understand data very well, but not necessarily having the skills and tools to manage it, The good news is, with the rise of self-service Business intelligence, we have exactly that, Powerful data management tools yet accessible (assuming you want to learn something else than Excel).

So at high level this is how it works.

 Project Controls Data Warehouse

  • The Data warehouse was built using PowerBI desktop, I know it should be called sematic model, (for me data model, data warehouse are fundamentally the same thing), initially it was using Excel PowerPivot but it did not scale well with the increase of the volume of data.
  • As the data is not always in the format we want, PowerQuery is very handy in this case, as virtually it can transform any source of data, example lookup the subsystem using the tag field, trying to do that if you have 8 Million rows using Excel or Access is not feasible.
  • We maintain Master tables to integrate all the different source of data (tags, WBS, subsystems etc)
  • Every week, we get new Export from the source systems (Cobra, proprietary database systems etc), we load the new data and keep the historical records, it took 15 minute to refresh, which is quite impressive, Cobra alone is a folder 60 Excel file, and nearly 2 Giga in size.
  • Usually you publish your reports into PowerBI.com service to end users once your refresh your data model, in our case we can’t use the cloud for privacy reason, instead we use Excel as a reporting tool that pull the data from PowerBI desktop, the advantage of this approach is that we have different reports for different users, Skyline, Gantt chart, Client reports (in their required format), management reports etc.

Some thoughts.

  • As you can see Primavera P6 is used only as a forecasting tool and to calculate the critical path, the earned value calculation is done in the data model, personally I think P6 should not be used as the centre of your project control system, I remember the first time I start learning Primavera P3 ( a long time ago:), we kept asking the trainer how it is possible to track the spent hours at the activity level, the answer is we don’t, actually deciding at which level you track you spent hours it is the most important decision to make when you start a new project.
  • the basic idea here is in order to have an integrated project controls system is stop trying to have one, data will be always in silo, don’t try to change other department how they manage their specific data, it will not work and they will not listen to you anyway, So instead of trying to have one system to rule them all, just use the existing systems and build a data warehouse for reporting and Integration with P6.

How to import Progress to Primavera

It is quick post showing how to import activities status to Primavera using Excel.

Cobra is as an example for a progress measurement system, it can be any other systems.

In P6 always use new template, never trust an old file as things may have changed in the meantime and you end up with discrepancies.

Assuming the schedule is resource loaded, you need first to import

  • The new activities status ( actual start, actual finish, remaining duration )
  • The new resource status ( Budget hours, Earned Hours, at completion hours)

You need to import first the activity status then the hours.

  • Export activities status from P6

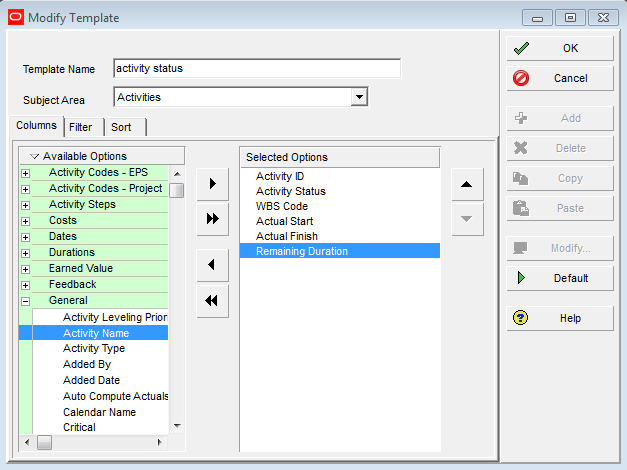
Make sure you select Export type, Activities

0

The Activity ID, activity status and WBS code are selected by default, you need to add Actual start, Actual Finish and Remaining duration

1

P6 will export an excel file LIKE THIS

7

Now you can transfer the progress data from  COBRA, using the activity id as a reference, don’t change the WBS code.

In some cases you may let P6 calculate the remaining duration, personally I prefer to do the calculation outside P6, as it is more flexible, for example you can calculate remaining duration based the actual productivity, which is very easy to do in Excel

Import back to Excel, Make sure to save any error message

  • Import the hours

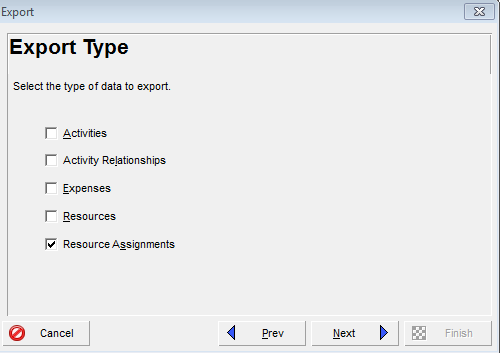
The same approach, make sure you select, resource assignment

2

3

8

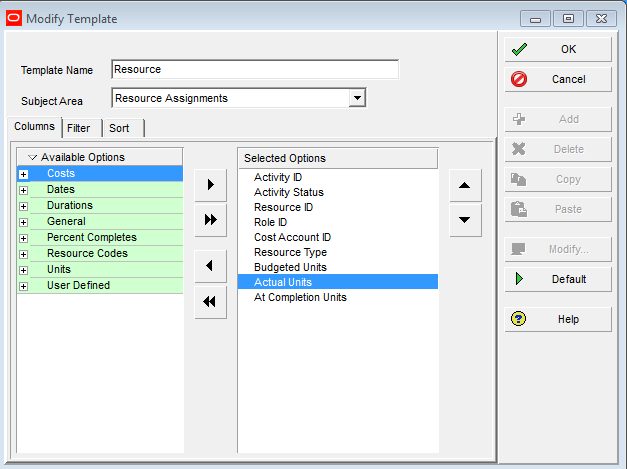
Make sure to update only the column (Budget units, Actual unit, At Completion Units),

The activity status cannot be updated from this template that’s why you need first to import the activity status and then the resource status.

Note: if the activity status is completed, make sure actual unit = at Completion units.

P6 can assign multiple resources to the same activity, so make sure you don’t have duplicate resources assigned.

Why you must automate the whole thing ?

As you can see the import to P6 is rather straightforward, probably you are asking why I am blogging about it in the first place?  And the reason is how do you know your import was successful?

Ok for the hours it is easy, if the total hours match, then the import was probably successful, but what if the total hours do not match? Or how do you know the activity status is updated correctly

One approach is to design a system for example in Excel , Modern Excel or Access that do the following.

  • Automatically map P6 activity ID to Cobra.
  • Generate the activity status and compare it to the current P6 status
  • Import the new status to P6
  • Redo step 2 and 3 until the status in P6 match exactly the status in Cobra.

Now if you are spending too much time manually updating P6 ( we all done that), I think it is unfortunate, and honestly it a waste of time better spend in analysis the schedule, ok it is easy said than done, and there are many technical and non technical roadblock to have such a system in place, but I think the most important one, the Planner responsible for the initial preparation of the baseline is more concerned to have his schedule approved than to worry about how the schedule will be maintained later. ( usually it is other planners problems).

but if you stick to this general rules, probably you will do fine

  • Only use, contractual Milestones, Access Milestones and resources loaded activities.
  • Schedule activities should never be more detailed than your Bill of Quantities
  • if you can not measure a task, don’t use it
  • don’t use level of effort just for presentation purpose.

Edit : 17-04-2017, for complex project, we just use one generic resource to load the total hours and earned hours per activity,  trying to load individual resource type is not feasible  and become a nightmare to manage and honestly even getting the “spent Hours” at the activity level is not possible,  that’s why I think Earned valued and productivity analysis should be done outside P6