If you work for the main contractor or doing an EPC contract, then there is already a well-established project controls systems and procedures applied enterprise wide, all the projects use the same approach and methodology, all you have to do is just learn it and fellow the procedures.
Now when you work for a subcontractor it become tricky, although there are already systems and procedure in place, you need to fellow the main contractor specifications.
In this blog, I will share a generic approach that is agnostic to the client’s tools, it is not a step by step tutorial as every client has a different systems and terminology, but I hope you can adapted it to your particular case.
First you can implement the mapping system in any database systems you are familiar with, you can use MS access, SQL server or any open source database,
I will use Cobra as the progress measurement systems and Primavera as the planning tool, this is only an example, any other combination will works, as we exchange data using Excel and we use activity codes as a reference, all the planning tools support some kind of activity codes.
Why do we need mapping in the first place?
Updating a schedule is a time consuming task!! And it is prone to errors and personal judgement of the planners involved, generally the update process involve two steps.
- Updating the facts ( Actual Start, Actual Finish, Earned Hours , remaining duration)
- Review the update and analyse the results (critical Path, Forecast Curve) and check for any discrepancies, and thinking of mitigation plans if there are slippage.
If step 1 is done manually then obviously the planner will have less time for step 2, which I think is the most important Task.
I think a better approach is to make step 1 fully automated and let the planners do step 2 which cannot be automated (unless computer become self-aware).
How to do the mapping then.
- Manual, most used approach, the planner open the progress spreadsheet and manually copy the hours and the new status, either by filtering or a pivot, or on ad hoc basis (nice word to say guess work).
- Primavera activity ID is manually assigned to cobra, Cobra then will make an export with the new status grouped by activity id, the disadvantage of this approach is, it is hard to maintain when the take-off change which is natural fact of life in construction projects and there is no transparency why the mapping was done in such way, still it is way much better than the first one.
- Dynamic mapping: instead of manually assigning activity id in cobra, we define a new primary key in P6 that based on fixed rules will automatically generated link to Cobra.
How this dynamic mapping works:
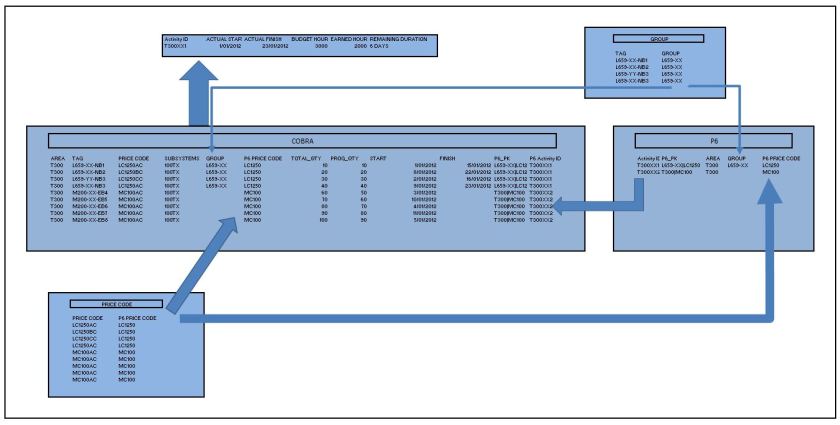
We don’t use Primavera activity id, instead we define a new natural key, let’s call it P6_PK, this key define the exact scope of work of one activity, in this example we have two type of activities:
We can use this P6_PK as the activity id, but if you have already a baseline, you can’t touch the activity id and sometimes the default length of the activity is too short.
Let’s define some terms:
– Activity Level 3: P6_PK is Area|P6 price code
– Activity Level 4: P6_PK is Group|P6 price code
– Group: a group of tags that have common characteristic: by subsystems, major package, cables grouped by destination, or origin or whatever the schedule is grouped by. Or simply how you think the work will be done.
– P6 price code: the MTO has a very detailed breakdown for the price, obviously we can’t use them otherwise we end up with a massive schedule, instead we group the code to a manageable level.
In P6 (or MS Project or whatever you are using) define new codes, Area and P6 price code.
Create two tables.
P6 price code: define how you group your MTO Price code to P6 price code
Group: define how you want to group your tag.
The Database will look up the group from the group table and P6 price code from your P6 Price code, then generate P6_Pk from that then we get the activity id.
Obviously I just outlined the fundamental concept, in real project, it is much complex, P6 price code may have different level of details in the same schedule, and some tags may have different groups based on the type of activities, we may keep excavation at the level 3 but pouring concrete for foundations at level 4. (Hint you can new dimensions to your dictionary tables)
Please notice I use Level 3/4 just for the purpose of mapping, it is not to reflect the level of the schedule which is an open question. (Two planners will tell you different thing)
The output of the system:
- The new status of the activities. ( import back to P6)
- The new scope that are not mapped.( update the new groups and price code eventually)
- The activities that used be mapped but now lost the scope ( statue them as completed, as there is no more scope)
The time to update P6 was significantly reduced (by order of magnitude), the system was implemented using PowerPivot/Power Query as filtering and manipulating huge list of data is more convenient in Excel.
The challenge
The biggest challenge was how to combined all the weekly export from cobra in Excel and combined them in one table and add other data from other systems to get a format required for the mapping, if you are an SQL ninja it is doable but if you are a planner what you do, there was no easy answer before, but now we have it, Build a data-warehouse in PowerBI, but that’s a blog for another day.

I think automating schedule updates is an important step for improving project planning efficiency.
LikeLike