There are plenty of templates on the internet on how to spread a budget using Excel formula, in this blog post we will use the Powerquery function “List.Dates”, and a calendar table to account for holidays and periods with less working hours, for example under extreme weather conditions, the working hours per day will be less than standard working hours.
Obviously Planning software handle this scenario very well, but contrary to popular belief, Excel is still the most widely used planning software among non-planners. (I have yet to see a cost controller or QS using a planning software, even MS Project).
The function is straightforward:
List.Dates(start as date, count as number, step as duration)
In this case, count will be the durations in days, and step will be 1 day
Let say you have a list of tasks, with a start and finish date, and some kind of budget, (cost, revenue, quantities, Effort required etc).
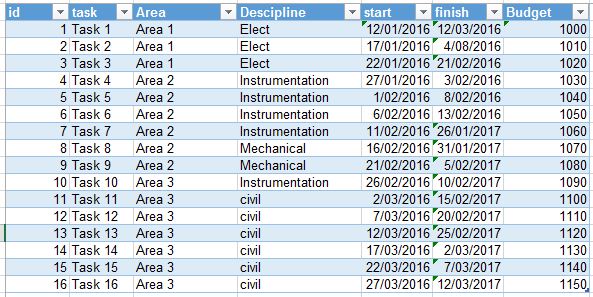
Let’s load the table Task and generate the spread.
- First we calculate the duration ( Finish-Start)
- We use the List.Dates to generate the list of dates between the start and finish of every task.
- Expand the list to become a column.
- Merge the list of date with the calendar table to get the working hours per day.
- Now we sum the total working hours per id.
- The % by day = working hours per day/ Total working hours per task.
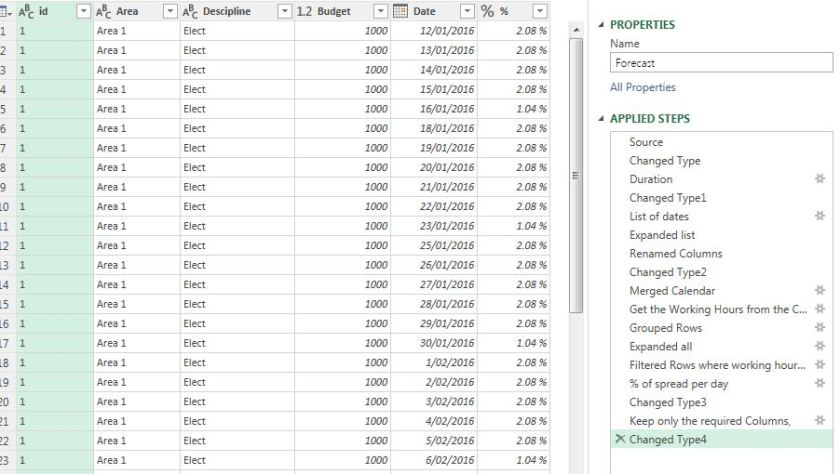
Voila, you have % per day. Now to spread the budget, just multiply the budget by % per day.
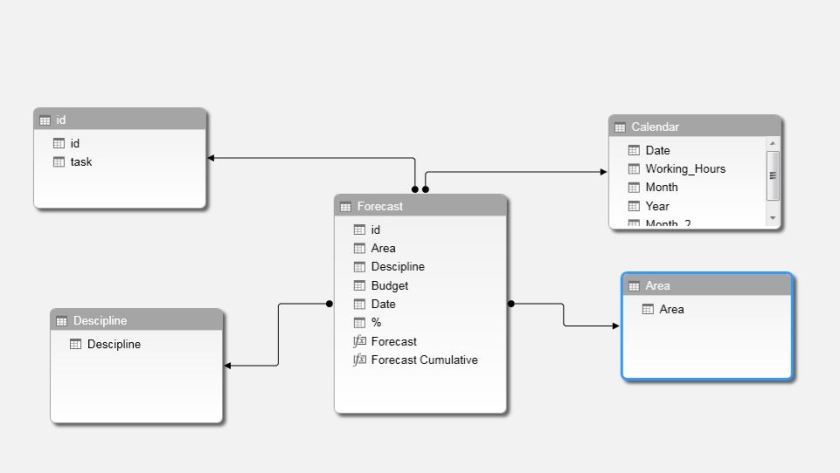
Then we load some dimensions table in order to slice and dice the pivot table and WE add a measure to calculate cumulative Budget time. As we are using a calendar table, we can show the budget per day, Month, year or any time period.
Here we got a nice little Star schema
Now a Pivot table with conditional formatting will show a Gantt like chart.
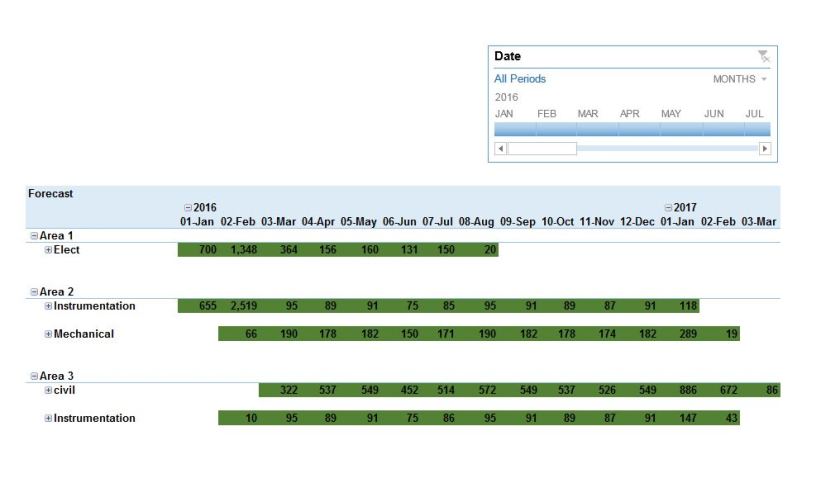
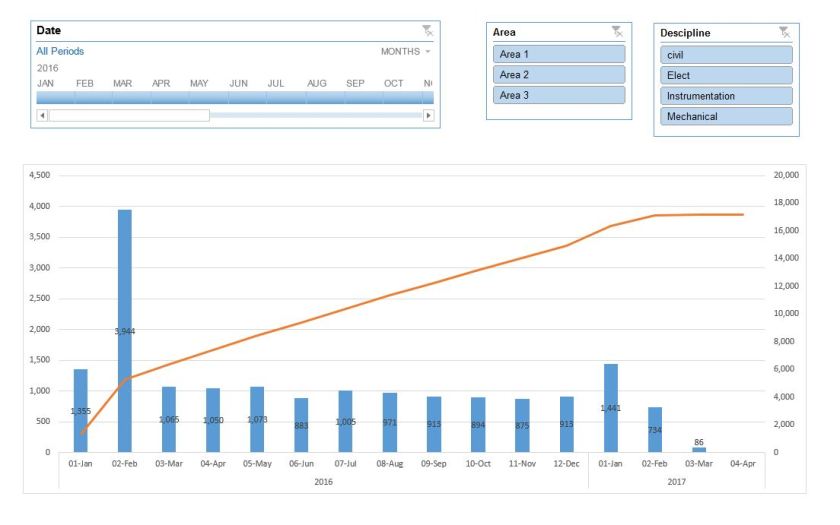
And a pivot chart to show the Budget per Period and the cumulative.
You can download the template here, you need Excel 2013+, if you don’t have it, you can always download PowerBI desktop for free, and import the Excel file, but you need to redo the charts though.
