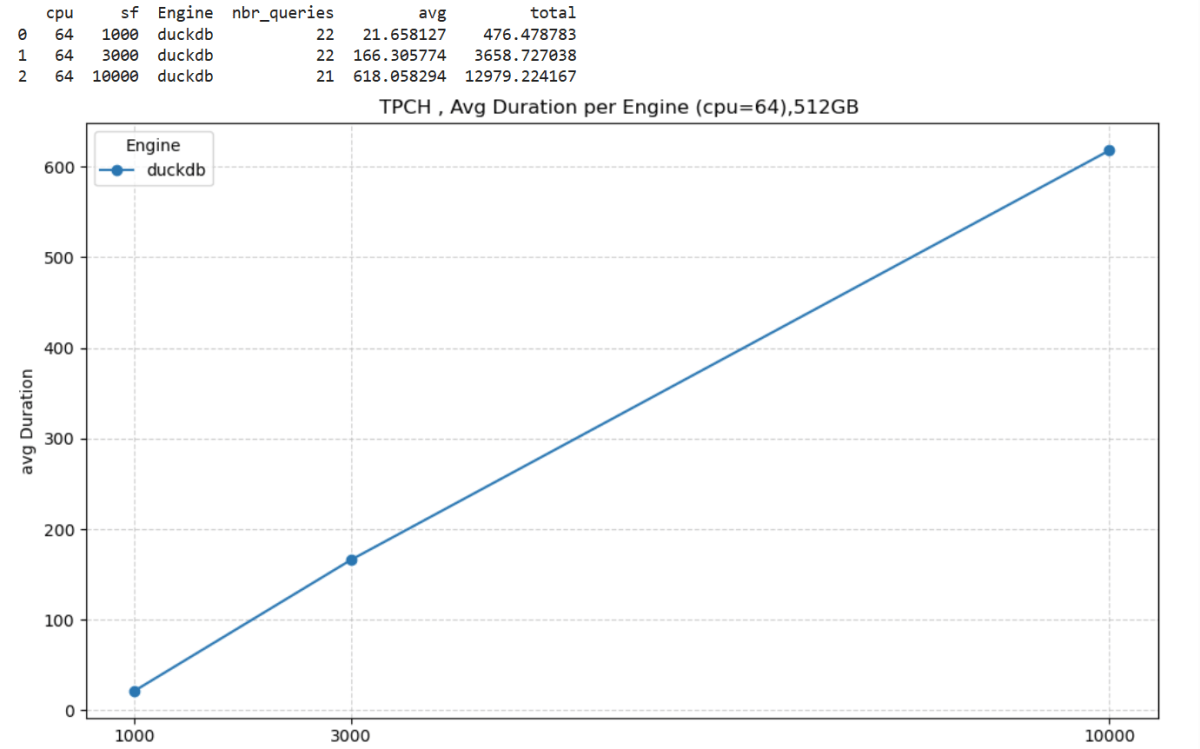
This started as just a fun experiment. I was curious to see what happens when you push DuckDB really hard — like, absurdly hard. So I went straight for the biggest Python single-node compute we have in Microsoft Fabric: 64 cores and 512 GB of RAM. Because why not?
Setting Things Up
I generated data using tpchgenand registered it with delta_rs. Both are Rust-based tools, but I used their Python APIs (as it should be, of course). I created datasets at three different scales: 1 TB, 3 TB, and 10 TB.
From previous tests, I know that Ducklake works better, but I used Delta so it is readable by other Fabric Engines ( as of this writing , Ducklake does not supporting exporting Iceberg metadata, which is unfortunate)
The goal wasn’t really about performance . I wanted to see if it would work at all. DuckDB has a reputation for being great with smallish data, but wanted to see when the data is substantially bigger than the available Memory.
And yes, it turns out DuckDB can handle quite a bit more than most people assume.
The Big Lesson: Local Disk Matters
Here’s where things got interesting.
If you ever try this yourself, don’t use a Lakehouse folder for data spilling. It’s painfully slow(as the data is first written to disk then uploaded to remote storage)
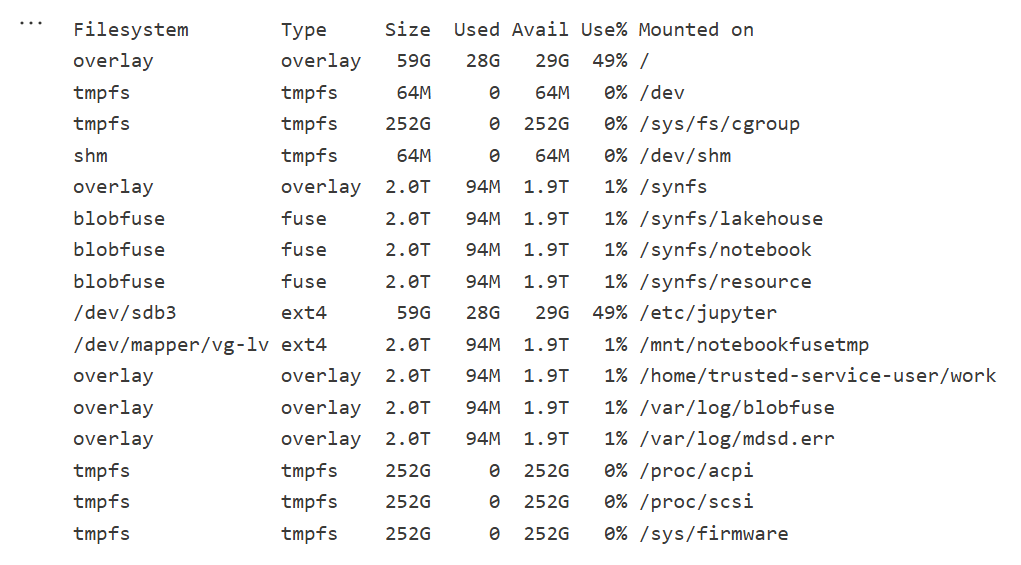
Instead, point DuckDB to the local disk that Fabric uses for AzureFuse caching. That disk is about 2 TB. or any writable folder
You can tell DuckDB to use it like this:
SET temp_directory = '/mnt/notebookfusetmp';
Once I did that, I could actually see the data spilling happening in real time which felt oddly satisfying, it works but slow , it is better to just have more RAM 🙂
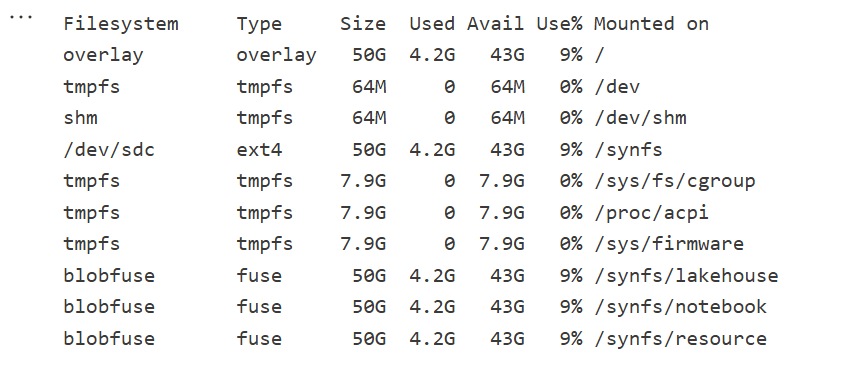
Python notebook is fundamentally just a Linux VM, and you can see the storage layout using this command
!df -hT
Here is the layout for 2 cores
Which is different when running it for 64 cores ( container vs VM, something like that), I notice the local disk increased with more cores, which make sense
The Results
Most queries went through without too much trouble. except Query 17 at 10 TB scale? That one It ran for more than an hour before my authentication token expired. So technically, it didn’t fail 🙂
DuckDB does not have a way to refresh Azure token mid query. as far as I know
Edit : according to Claude, I need at least 1-2 TB of RAM (10-20% of database size) to avoid disk thrashing
Observations: DuckDB’s Buffer Pool
Something I hadn’t noticed before is how the buffer pool behaves when you work with data way bigger than your RAM. It tends to evict data that was just read from remote storage — which feels wasteful. I can’t help but think it might be better to spill that to disk instead.
I’m now testing an alternative cache manager called duck-read-cache-fs to see if it handles that better. We’ll see, i still think it is too low level to be handled by an extension, I know MotherDuck rewrote their own buffer manager, but not sure if it is for the same reason.
Why not test other Engines
I did, actually , and the best result I got was with Lakesail at around 100 GB. Beyond that, no single-node open-source engine can really handle this scale. Polars, for instance, doesn’t support spilling to disk at all and implements fewer than 10 of the 22 standard SQL queries.
Wrapping Up
So, what did I learn? DuckDB is tougher than it looks. With proper disk spilling and some patience, it can handle multi-terabyte datasets just fine, and sometimes the right solution is just to add more RAM
personally , I never had a need for TB of data ( my sweet spot is 100 GB) and distributed system (Like Fabric DWH, Spark etc) will handle this use case way better, after all they were designed for this scale.
But it’s amazing to see how far an in-process database has come 🙂 just a couple of years ago, I was thrilled when DcukDB could handle 10 GB!
(Disclaimer : I use BigQuery for a personal project and it is virtually free for smaller workload, at work we use SQL Server as a Data Store, I will try my best to be objective )
TL:DR ;
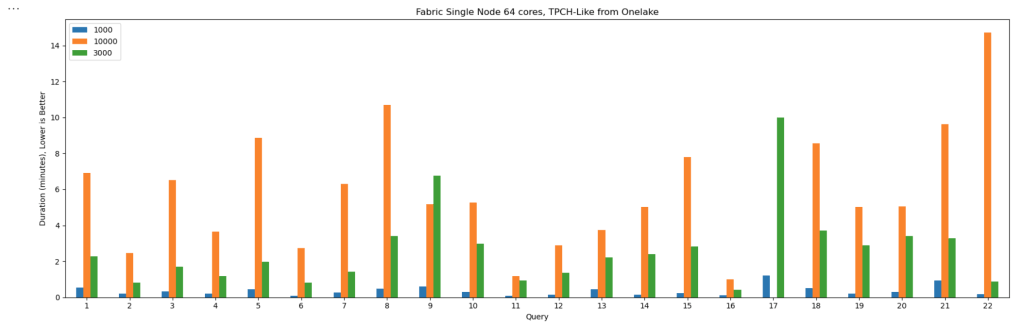
Run TPCH-SF100 benchmark (base table 600 million rows) to understand how different Engine Behave in this workload using just the lowest tier offering, you can download the results here
Introduction
Was playing with Snowflake free trial ( maybe for the fifth time) and for no apparent reason, I just run Queries on TPCH-S100 Dataset, usually I am interested in smaller dataset, but I thought how Snowflake may behave with bigger data using the smallest cluster, long story short, I got 102 second, posted it in Linkedin and a common reaction was Snowflake is somehow cheating.
Obviously I did not buy the cheating explanation , as it is too risky and Databricks will make it international news.
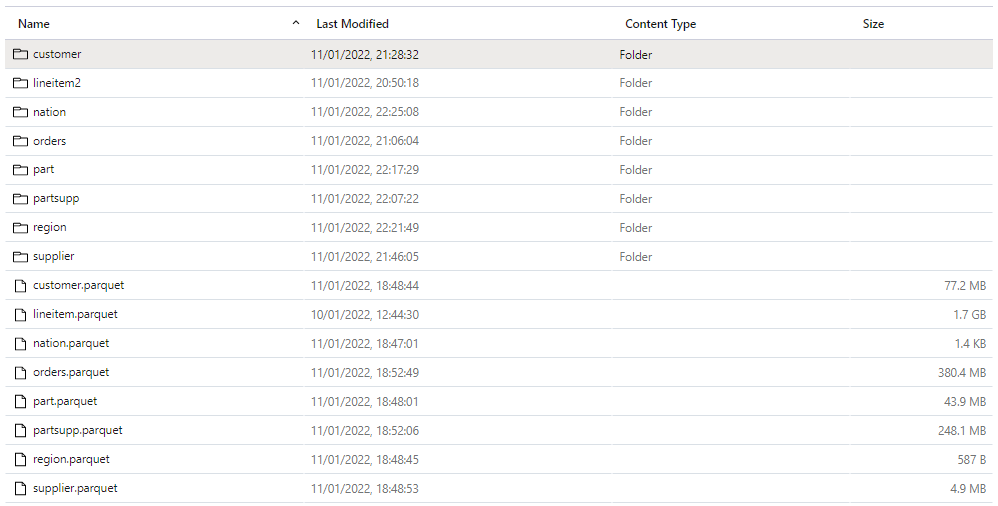
Load the Data Again
Ideally I would have generated the Data myself and load it into Snowflake, generating 600 Million records in my laptop is not trivial, my tool of choice, DuckDB has an utility for that but it is currently single threaded, instead
I exported the data from Snowflake to Azure Storage as parquet files
Download it to my Laptop, generate new files using DuckDB as in Snowflake you can’t control the minimum size of files, you can control the max but not the Min
Snowflake Parquet External Table
My Plan was to run Queries directly on Parquet hosted on azure storage, the experience was not great at all, Snowflake got Query 5 join order wrong
Snowflake Internal Table
I loaded the parquet files generated by duckdb, Snowflake getting extremely good results. what I learnt, whatever Snowflake magic is doing, it is related to their proprietary file format.
BigQuery External Table
I have no frame of reference for this kind of workload, so I loaded the the data to BigQuery using external table in Google Cloud, Google got 5 minutes, one Run, 2.5 $ !!!!
BigQuery Internal Table
Loaded Data to BigQuery internal format, notice, BigQuery don’t charge for this operation , 2 Minutes 16 second, 1 Cold Run.
BigQuery Standard Edition
BigQuery added new pricing model where you pay by second, after the first minutes, I used the Standard Edition with a small size, I run the same query two time, unfortunately the new distributed disk cache don’t seems to be working, same result 5 minutes, that’s was disappointing
Redshift Serverless
Imported the same Parquet files into Redshift serverless, The schema was defined without Distribution keys, The results are for 3 Runs, the first run was a bit slower as it is fetching the data from the managed storage to the compute SSD the other 2 runs are substantially faster, I thought it is fair to have an average, Using the lowest Tier 8 RPU (2.88 $/Hour)
Redshift Serverless hot run was maybe the fastest performance I have seen so far, but they need still to improve on their cold Run.
I was surprised by the system overall performance, from my reading, it seems AWS basically rewrite the whole thing including separating compute from storage, Overall I think it is a good DWH.
Trino
Trino did not run Query 15, had to run a modified syntax but same results, 1 Run from Cold Storage, I am using the excellent service from Starburst Data
Synapse Serverless
Honestly, I was quite surprised by the performance of synapse serverless, initially I tested with the smaller file size generated by Snowflake and it did work, the first run failed but the second works just fine, I did like it, it did failed quickly, notice that Synapse run statistics on parquet files, so you would expect a more stable performance, not the fastest, but rather resilient.
Anyway , it took from 8-11 minutes, to be clear that’s not Synapse from two years ago.
Not related to the benchmark but I did enjoyed the lake database experience
Databricks External Table
I had not a great experience with Databricks, I could not simply pass authentication to Databricks SQL, you need a service principal and registering an App, and the documentation keep talking about Unity, which is not installed by default, This is a new install why Unity is not embedded if it is such a big deal ?
Anyway, First I created an external Table in databricks using the excellent passthrough technique in the Single Node Cluster, Databricks got 12 minutes,
Databricks Delta table
let’s try again with Delta, I created a new managed table, run optimize and analyse , (I always thought delta has already the stats), but it didn’t seems to make a big difference, still around 11 minutes, and this running from the disk, so no network bottleneck
DuckDB
My Plan was to run DuckDB on Azure ML, but I need a bigger VM than the one provided by default, I could not find a way to increase my Quota , I know it sounds silly, and I am just relating my experience, turn out Azure ML VM Quota is different from Azure VM, it did drive me crazy why I could get any VM in Databricks but Azure ML keep complaining I don’t have enough CPU.
Unfortunately I hit two bugs, first the native DuckDB file format seems to generate double the size of Parquet, the dev was very quick to identify the issue, the workaround is to define the table schema and then load the data using insert, the file became 24 GB compared to the original 40GB parquet files.
I End Up going with parquet files, I was not really excited by loading a 24 GB file in a storage account.
I run the Queries in Azure Databricks VM E8ds_v4 (8 cores and 64 GM of RAM)
As I am using fsspec with disk cache, the remote storage is used only the first run, after 4 tries, Query 21 keep crashing the VM 😦
Tableau Hyper
Tableau hyper was one of the biggest surprise, unfortunately, I hit a bug with Query 18, otherwise, it would have being the cheapest option.
Some Observations
Initially I was worried I made a mistake in Snowflake results, the numbers are just impressive for a single node tier, one explanation is the Execution Engine is mostly operating on compressed data with little materialization , but whatever they are doing, it has to do with the internal table format, which bring a whole discussion of performance vs openness, personally in a BI scenarios, I want the best performance possible, and wonder if they can get the same speed using Apache Iceberg.
Synapse Serverless improved a lot from last year, it did work well regardless of the data size of individual parquet files that I throw at it, and in my short testing it was faster than databricks and you pay by data scanned, so strictly speaking pure speed is not such a big deal but without a free result cache like BigQuery, it is still a hard sell.
Azure ML Quota policy was very confusing to me, and honestly I don’t want to deal with support ticket.
Databricks; may well be the fastest to run 100 TB, but for 100 GB workload, color me unimpressed.
DuckDB is impressive for an open source project that did not even reach version 1. I am sure those issues will be fixed soon.
Everything I heard about Redshift from twitter was wrong, it is a very good DWH, with Excellent performance.
BigQuery as I expected has excellent performance both for parquet and the native table format, The challenge is to keep the same using the new auto scale offering. added Auto scale performance, I think Google should do better.
Summary Results
You can find the results here, if you are a vendor and you don’t like the results feel free to host a TPCH-SF100 dataset in your service and let people test it themselves.
Note : Using SQL Query History : Bigquery one Cold Run , Synapse Serverless , Redshift Serverless and Snowflake a mix of cold and warm
(Note : Synapse Serverless always read from remote storage)
Databricks I am showing the best run from Disk, there is no system table, so I had to copy paste the results from the console.
Pricing
I did not kept the durations for Data load, it is just the cost for Read, obviously it is a theoretical exercise, and does not reflect real life usage which depends on other factors like concurrency performance , how you can share a pool of resources to multiple departement,free results cache, the performance of your ODBC drivers etc.
it is extremely important to understand what’s included in the basic price, for example.
Results cache:
BigQuery, Snowflake, Redshift results cache are free and you don’t need a running cluster, in Databricks you pay for it, Synapse don’t offer result cache at all.
Data loading :
BigQuery data loading is a free operation and other service like sorting and partitioning, in other DB you needs to pay.
Egress Fees :
Snowflake/BigQuery offer free egress fees, Other vendors you may pay, you need to check
Note :
BigQuery : for This workload make more sense to pay by compute not data scanned, either using auto scale, reserved pricing etc, I will try to test Auto scaling later.
Snowflake : I used the standard edition of Snowflake
Edit : I used a Google Colab notebook with a bigger VM for Hyper and DuckDB, see full reproducible notebook
Final Thoughts
Cloud DWH are amazing tech and only competition can drive innovation, not FUD and dishonesty, regardless of what platform you use, keep an eye on what other vendors are doing, and test using your own workload, you may be surprised by what you find.
Edit : February 2023 , Synapse serverless has substantially improved the Query performance for TPCH-SF10, first run which include calculating the statistics take around 2 minutes, but the second run is around 62 second.
In a previous blog, I did a benchmark for a couple of Database Engine, although it was not a rigorous test, pretty much the results were in the expected range, except for Synapse serverless, I got some weird results, and not sure if it is by design or I am doing something very wrong, so I thought it worth showing the steps I took hoping to find what’s exactly going on. The test was done in January 2022.
First Check : Same region
I am using an azure storage in Southeast Asia
My synapse Instance is in the same region
Ok both are in the same region, first best practice.
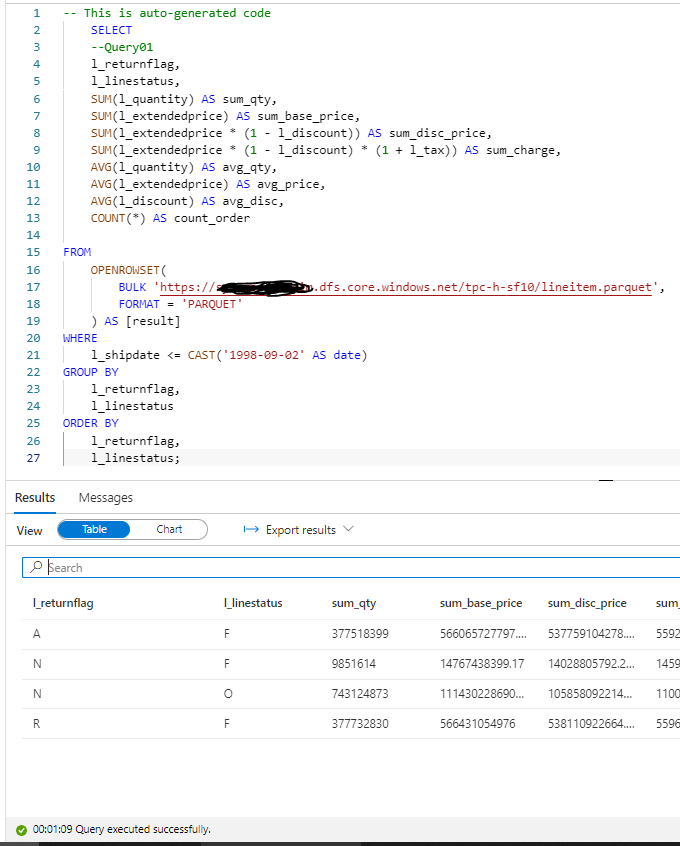
In Synapse, you can directly start querying a file without defining anything, using Openrowset, I thought I can test TPC-H Query 1 as it uses only 1 table, which did not work , some kind of case sensitive issue, when writing this blog I run the same Query and it worked just fine, ( no idea what changed)
1 minute on a second run, hmm not good, let’s try a proper external table , the data_source and File_format were already defined, so need to recreate it again.
ok 2 minute for the first run, let’s try another run which will use statistics, it should be faster, 56 second ( btw, you pay for those statistics too)
Not happy with the results I asked Andy ( Our Synapse expert) and he was kind enough to download and test it, he suggested splitting the file give better performance , he got 16 second.
CETAS to the rescue
Create External Table as Select is a very powerful functionality in Serverless, The code is straightforward
CREATE EXTERNAL TABLE lineitem
	WITH (
	LOCATION = '/lineitem',
	DATA_SOURCE = [xxxx_core_windows_net],
	FILE_FORMAT = [SynapseParquetFormat]
	)
as
SELECT * FROM dbo.lineitem_temp
Synapse will create a new table Lineitem with the same data type and a folder that contain multiple parquet files.
That’s all what you can do, you can’t partition the table, you can’t sort the table, but what’s really annoying you can’t delete the table, you have first to delete the table from the database then delete the folder
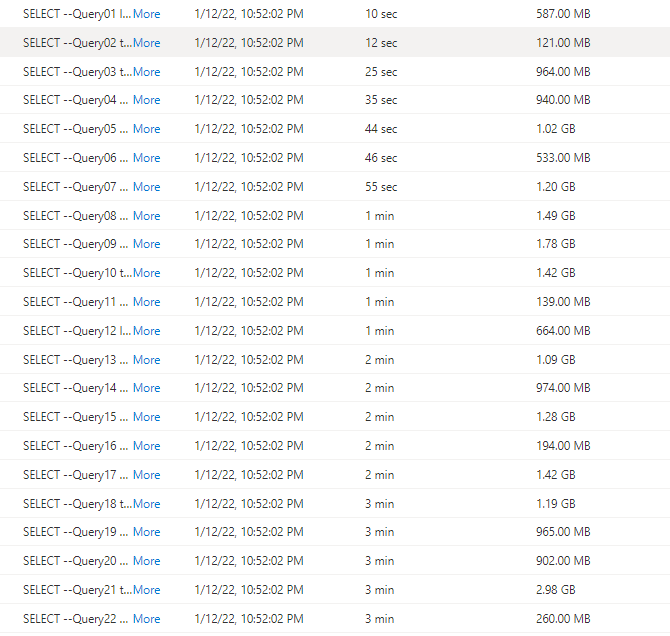
Not bad at all, 10 second and only 587 MB scanned compared to 50 second and 1.2 GB.
Now that I know that CETAS has better performance, I have done the same for remaning 7 tables.
Define all the tables
First Create an external Table to define the type then a CETAS, Synapse has done a great job guessing the type, I know it is parquet after all, but varchart is annoying by default it is 4000, you have to manually adjust the correct length.
The 22 Queries are saved here, I had to do some change to the SQL, changing limit to Top and extract year from x to Year (x), Query 15 did not run, I asked the Question on Stackoverflow and Wbob kindly answer it very quickly
The first run, I find some unexpected results
I thought I was doing something terribly wrong, the Query duration seems to increase substantially, after that I start messing around, what I found is, if you run just one Query at the time, or even 4, the results are fine, more than that, and the performance deteriorate quickly.
I imported the Query History to PowerBI and here is the results
There is no clear indication in the documentation that there is a very strict concurrency limitation, I tried to run the Script in SSMS and it is the same behavior, that seems to me the Engine is adding the Queries to a queue, there is a bottleneck somewhere.
Synapse serverless show the duration between when the Job was submitted until it is completed, there is no way to know the actual Duration of each Query, so basically the Overall Duration is the duration of the Last Query, in our Case Q22, which is around 3 Minutes.
Takeway
The Good news, the product team made it very clear, Synapse Serverless is not an Interactive Query Engine
Realistically speaking, reading from Azure storage will always be slower compared to a local SSD Storage, so no I am not comparing it to other DWH offering, having said that even for exploring files on azure storage, the performance is very problematic.
Edit 18 May 2022: Microsoft released Datamart which has excellent performance for this type of Workload.
Another blog on my favorite topic, interactive Live BI Workload with low latency and high concurrency, but this time, hopefully with numbers to compare.
The most widely used Benchmark to test BI workload is TPC-DS and TPC-H produced by the independent Organization TPC, unfortunately most of the available benchmark are for big dataset starting from 1 TB, as I said before I more interested in smaller Workload for a simple reason, after nearly 5 years of doing Business intelligence for different companies, most of the data model are really small, ( my biggest was 70 Million rows with 4 small dimension tables).
Benchmarking is a very complex process, and I am not claiming that my results are correct, all I wanted to know as a user is an order of magnitude and a benchmark can give you a high level impression of a database performance.
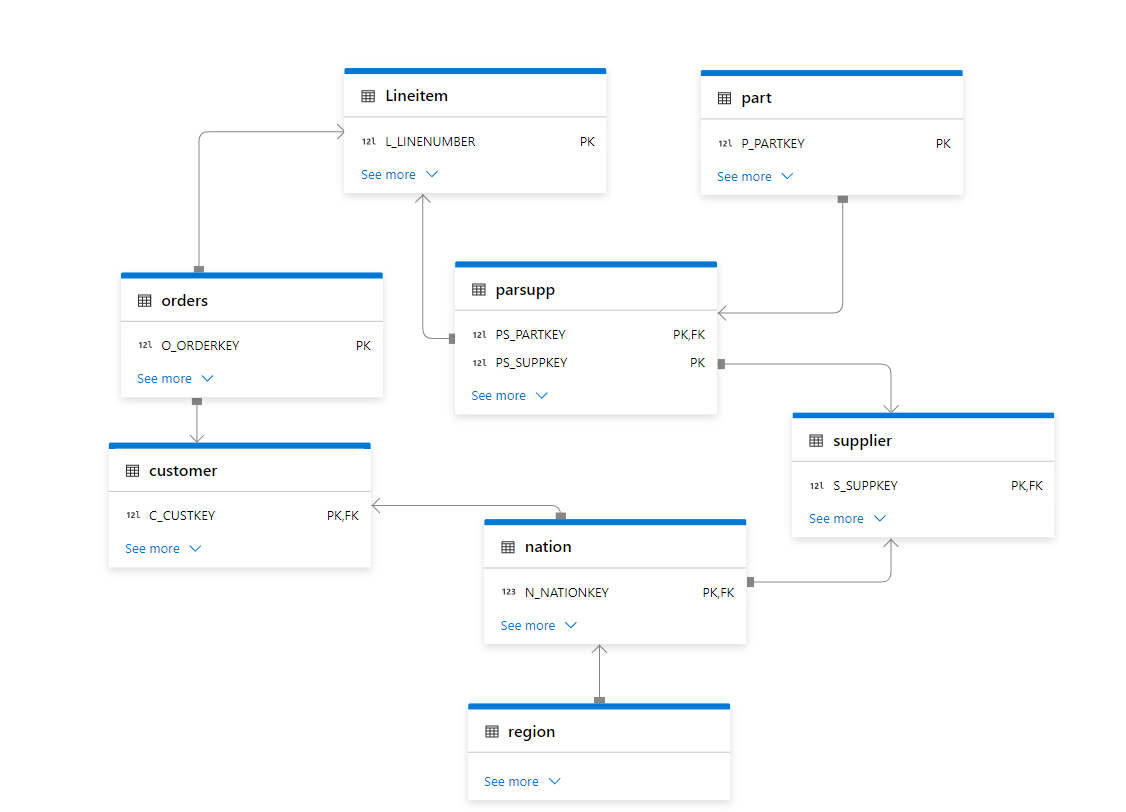
Schema
I Like TPC-H as it has a simpler schema 8 tables and only 22 Queries compared to TPC-DS which require 99 Queries.
Some Considerations
Result Cache is not counted.
The results are using warm cache and at least one cold run, I run the 22 Queries multiple times.
Databricks by default provide a sample Database TPC-SF05, the main Table Lineitem is 30 Millions rows, I don’t know enough to import the data and apply the proper sorting etc , so I preferred to use the smaller dataset. I did create a local copy by using create table as select ( Loaded SF10 Data)
Snowflake and SingleStore have SF10 and other scale by default.
BigQuery, I imported the data from Snowflake , I sorted the tables for better performance, it is a bit odd that BigQuery don’t provide such an important public dataset by default
Microsoft Datamart no sorting or partitioned was applied , the data was imported from Biguery.
No Results Cache
Most DWH support results cache, basically if you run the same Query and the base tables did not change the Engine will return the same results very quickly, obviously in any benchmark, you need to filter out those queries.
In Snowflake you can use this statement to turn the results cache off
ALTER SESSION SET USE_CACHED_RESULT = FALSE;
In Databrick
SET use_cached_result = false
BigQuery, just add an option in the UI
SingleStore and Datamart, does not have a result cache per se, the engine just keep a copy of the Query Plan, but it scan The Data every time.
Warm Cache
Snowflake, SingleStore and Databricks leverage the local SSD cache, when you run a Query the first time, it scan the data from the cloud storage which is a slow operation, then when you run it again the Query will try to use the data already copied in the local disk which is substantially faster, specially with Snowflake if you want to keep the local warm cache it make sense to keep your Cluster running a bit longer.
BigQuery is a different beast there is no VM, the data is read straight from the Google Cloud Storage, yes google Cloud Network is famous for being very fast, but I guess it can not compete with a local SSD Disk, anyway that’s why we have BI Engine which basically cache the data in RAM, but not all Queries are supported, actually only 6 are fully accelerated as of this writing. ( see Limitations )
Query History
Getting Query results is very straightforward using information_Schema, except for databricks, it seems it is only supported using an API, I just copied one warm run and paste it to excel and load it from there.
Engine Used
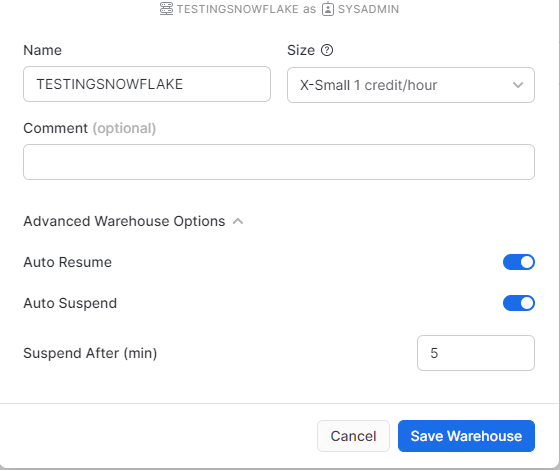
Snowflake : X-Small (Lowest tier)
Databricks : 2X-Small (Lowest tier)
Single Store : S-0
BigQuery : on Demand + 1 GB Reservation of BI Engine
Datamart : included with PowerBI Premium, official spec not disclosed.
DuckDB : my laptop, 16GB RAM 🙂
Results
The 22 Queries are saved in this repo, I am using PowerBI to combine all the results
let’s start with
Snowflake VS BigQuery
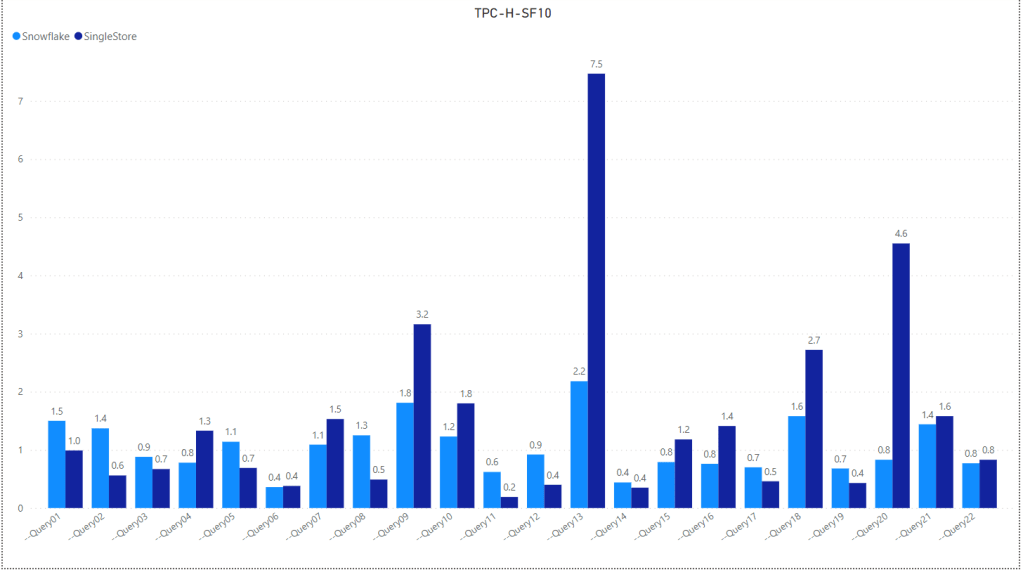
Snowflake Vs SingleStore
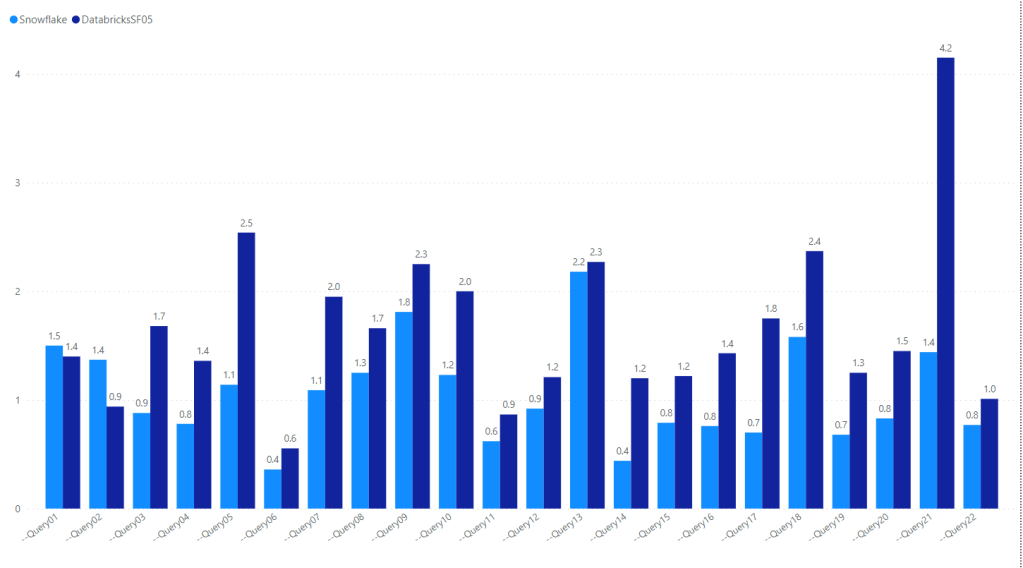
Snowflakes VS Databricks
Notice Databricks is using the smaller Dataset SF05, 30 million rows and still Snowflake show better performance
Overall
Edit : due to feedback, I am adding the sum of all Queries, You can download the results here
Edit : 26-Jan-2022, I Updated the results for Databricks SF10, I Uploaded the same data used for BigQuery, then created Delta Table and applied optimize Z Order
Take away
Snowflake is very fast and has consistent results for all the 22 Queries, Except Query 13 is a bit odd
SingleStore is remarkable but Query 13 is not good at all and skew the overall performance.
BigQuery is fantastic when BI Engine works ( only 11 Queries are supported from the total of 22)
Databricks performance in TPC-H-SF05 is problematic, I just hope they release a proper TPC-H-SF10 dataset and information schema like other DWH
Datamart has the best user experience, the only Data Platform where you can load the data without writing any Code,The same as Singlestore; Query 13 has a very Big Cost on the overall performance.
DuckDB : Query 9 skew the overall performance and probably I need a new laptop 🙂