BigQuery BI Engine behavior under Heavy Load

Note : if you are using flat price, nothing to see here 🙂

TL; DR : This blog is about a particular use case, assume a customer is using on demand pricing for BigQuery ( 5 $/ TB scanned) and bought some BI Engine reservation (1 $/1 GB compressed/Day), Currently under heavy load, BI Engine fallback to BigQuery, I think it is a problematic behavior and the customer should have the option.

  • Add the Queries to a Queue, slower but an order of magnitude cheaper
  • At least have an option to define the behavior.

The Use Case

Let’s say you have a relatively small table and you expect around 20 concurrent users Querying it, using a Live connection from Tableau or Data Studio.

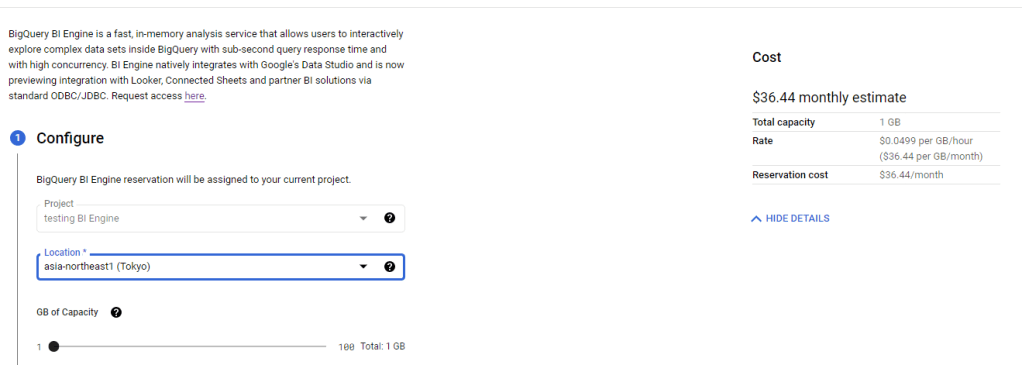
First let’s create 1 GB reservation. ( 36.44 $/Month)

Simulate Query Load

In a previous blog, I got complains that my benchmark is not reproducible, this time, I am using a different Approach, although it is the same base Table ( 74 Million records with new data every 5 minutes) , I am using a SQL Script that run 100 time, every time it generate 5 sequential Queries, and to avoid any cache the date filter is random, something like this

SELECT
    StationName,
    DAY as date,
    sum( Mwh ) AS Mwh
  FROM
    `test-187010.ReportingDataset.Nem_View`
  where DAY >= date_add(DATE "2016-12-25",INTERVAL cast(floor(rand()*100)+1 as INT64) DAY)
  GROUP BY
    1,
    2
  ORDER BY
    date ASC 
    Limit 1000

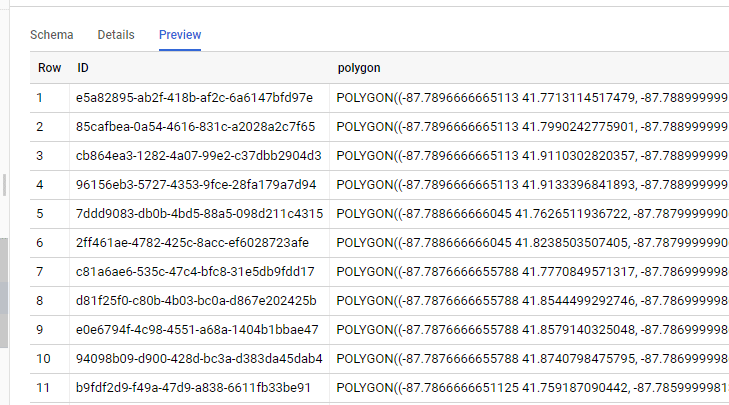
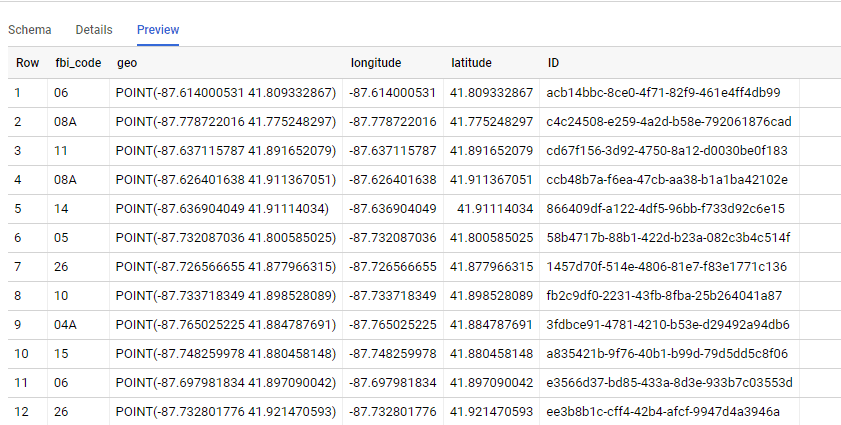
The data is public you can test it yourself, notice it is saved in Tokyo Region, BI Engine should be in the same Region.

The test Load is simple, run the first script and then slowly increasing the number of script running in parallel, the idea is to simulate an increase in concurrency

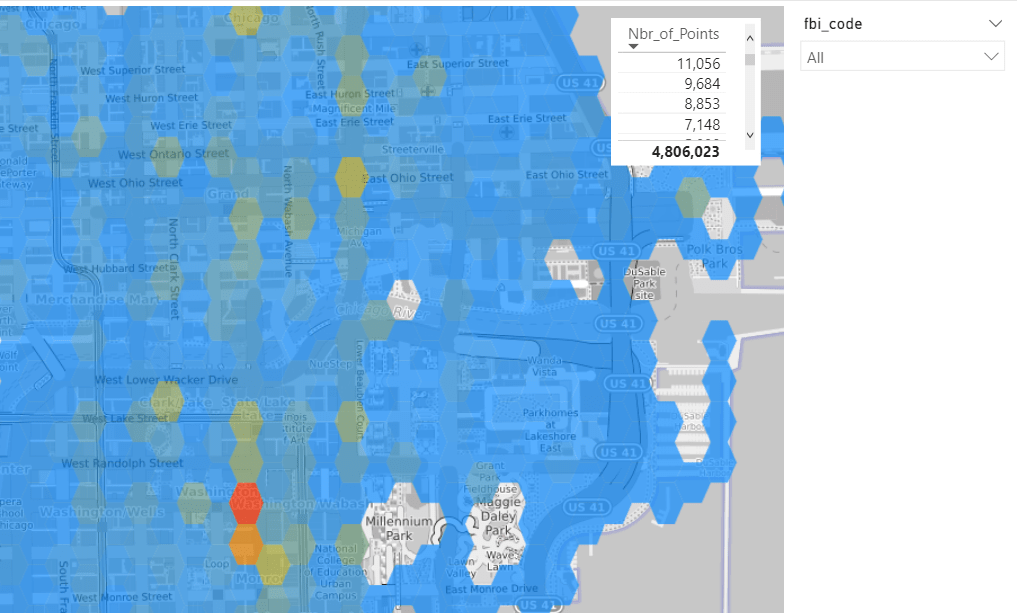
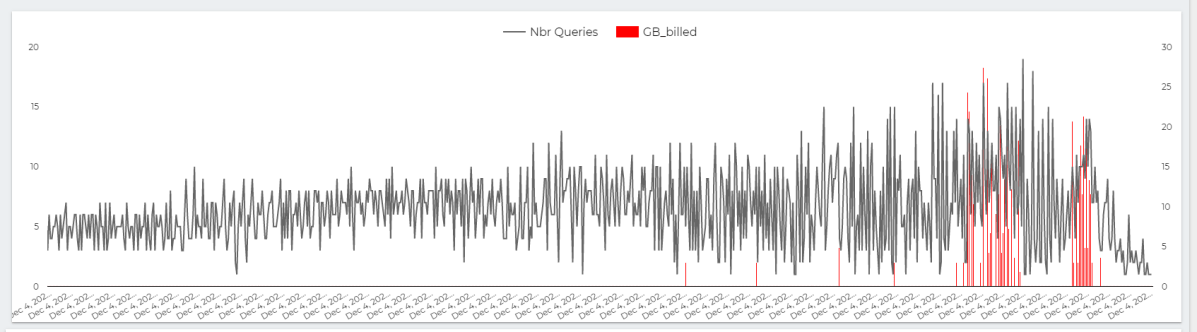
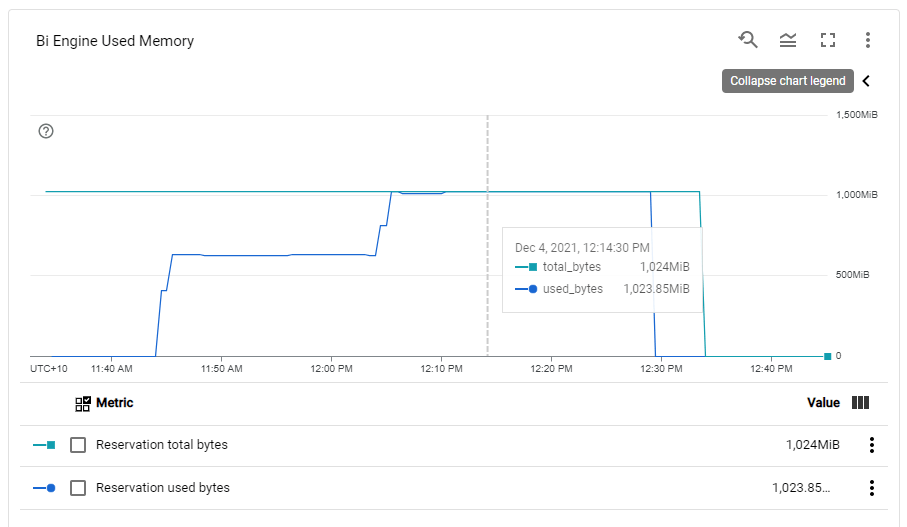
BI Engine consume more memory when the load increase, Very Nice 🙂

This chart show the number of Queries per second , The Red Line is GB Billed, The red Line is something that worry me a lot.

The whole value proposition of BI engine is the cost, yes it is fast and all but as far as I am concerned, it make Interactive Live BI workload very cost effective, on demanding Pricing is useful for ETL workload, not serving Queries.

Note : you can’t use BI Engine for transformation, saving Query results to a permanent table is not supported.

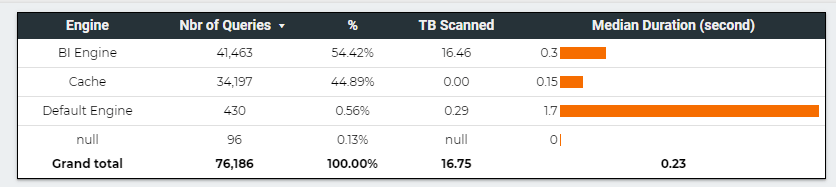
Here is The Workload Breakdown.

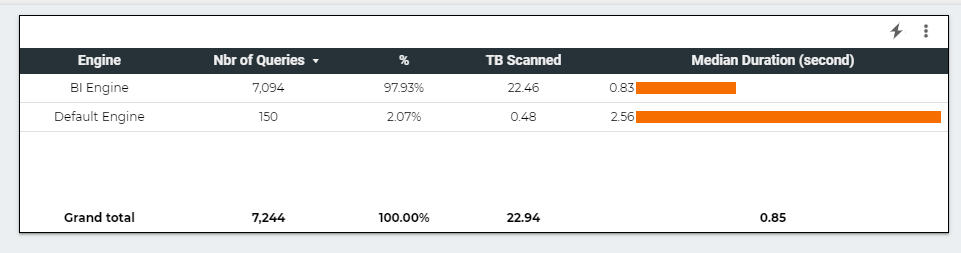
let’s admit the obvious here, BI Engine scanned 22 TB of data in less than an Hour for the cost of 5 cents, it handled the load gracefully, till we start getting 17 concurrent Queries ( your mileage will vary based on the query complexity, volume of data etc etc )

but when BI Engine got overloaded with Queries, it fall back to BigQuery on demanding pricing which in no time consumed the daily Quota ( 500 GB) for a cost of 2.5 $. ( always set up a quota per day)

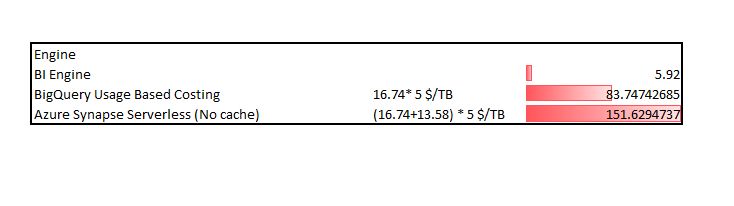
The Math is very simple, 22 TB for 5 cents versus 0.5 TB for 2.5 $

What‘s the solution

I really would like that BigQuery behavior change, if BI engine is overload, just added the Queries to a Queue to slow down things, or at least make this behavior optional, let the customer decide, if we need more concurrency we can by more memory, but don’t make the decision on our behalf.

PowerBI Vertipaq, which is in the same tech category, handle it differently, if you reach a limit, the Engine will simply throttle the Queries, I think BI Engine should behave the same 🙂

Takeway

For the Previous workload, and to support high level concurrency, and keep a Low cost, the Reserved memory Should be 2 GB, The Good news, the Product Team is working on Auto Scaling, No ETA though.

A vote on this feature request will be appreciated.

Synapse Serverless vs BigQuery BI Engine using a dataset under 10 GB

Disclaimer : this is not a scientific reproducible benchmark.

Edit : TL;DR, don’t use Synapse Serverless with Direct Query mode in PowerBI, it is an extremely bad idea.

One aspect that bother me about technical blogs nowadays, it seems cost is rarely considered, when the subject is about a fixed cost Product like PowerBI Pro license ( 1/user/10$/Month) then it is fine, we know what to expect, but when we talk about usage based Pricing, the cost structure is extremely important, a solution may be great for certain usage load, but it became just exorbitant when the load increases.

One particular architecture that some people start promoting as some kind of magical solution is the use of Synapse Serverless as a logical Data-warehouse, and somehow it can be used too as a live Query layer to PowerBI, I will argue in this blog that this setup is simple too expensive.

Testing Synapse Serverless Indirectly

My thinking is very simple, I was not very excited by the prospect of paying 200 dollars just to test Synapse Serverless, Instead I will test it indirectly, BigQuery BI Engine has a nice functionality that show how much data was scanned, it is for information only, we don’t pay by data scanned but instead in-memory reserved ( 1$/GB compressed/Day, minimum 1 hour).

The approach here is to get the volume of Data scanned and multiply it by 5$/TB (Synapse serverless Pricing) , I appreciate it is not 100 % accurate, but I hope will show a general pattern.

Load test using a PowerBI report

The Fact table is 12 GB, 72 Millions rows that get data add every 5 minutes, the Model is a simple Star Schema, I am using dual mode for the dimension Tables

The test consist of using play Axis to loop on some dimension values every 5 second, I launched multiple copy of the same reports to generate more SQL Queries.

The Results

This table summarize the test results , more details in the report , please keep the filter between 22 Nov and 27 Nov 2021, as testing was done in that period.

BigQuery BI engine is very fast, but that’s not the subject of the current blog, what’s interesting here is the volume of data scanned 16,75 TB, that’s a lot of data, which does not count for the cache.

For simplification purpose we estimate the cache to be the same ratio as scanned TB (16.46 * 44.89 %/54.42 %) = 13.58 TB

Synapse Serverless is 25 X more expensive than BigQuery BI Engine, and even if they add the result set cache it will be still 14 X more expensive ( Same as BigQuery without reservation)

Key findings

Interactive BI reports generate a massive number of SQL Queries, in our example, it was 76K Queries, which simply make SQL Engine that are cost based on data scanned too Much expensive.( Synapase Serverless and BigQuery default mode)

This scenario will be better served by a dedicated capacity, but as of this writing Synapse does not support auto suspense and auto resume which make it too expensive , and in any case, Synapse dedicated pool does not scale down well for small data ( hopefully Gen3 will fix that)

BigQuery BI Engine make Direct Query on PowerBI a viable solution, which is a great achievement and still with very competitive pricing.

Synapse Serverless is an interesting SQL Query Engine, but it not designed for heavy interactive BI load, I just hope people stop suggesting otherwise.

I think next year the battle for 100 GB interactive sub second BI workload will be an interesting space to watch, let’s see what Dedicated Pool Gen 3 , Databricks, Snowflake and Firebolt will bring to the table 🙂

Analyse Big Spatial Dataset using hex bin maps in PowerBI

Come across this blog post in Twitter and I thought this approach can be very useful in PowerBI to deal with Big GIS dataset.

The idea is simple, let’s say you have a big spatial dataset with million of coordinates, so instead of plotting all the individual points which is unfeasible for performance reason, you simply do this,

– First generate a grid for the area you want to analyse using something like QGIS.

– Then count how my point belong to every cell in the grid and color the results accordingly, you need a spatial Join for that, either using QGIS , SQL Server etc

– Drill down to individual points using WKT multi point

Publish to web here and pbix

Generate a Grid System

After a lot of googling as I did not even know what to look for, turn out QGIS can very easily generate a Grid, here is a good tutorial I found

and here is a results for Chicago area as I am using it as an example for this blog, Please notice, the grid should have less than 30K polygons which is the maximum number of rows that PowerBI can plot.

Spatial Join

I could have used QGIS to do the spatial join, but my data is from BigQuery public dataset (bigquery-public-data.chicago_crime.crime) and for convenience, it is easier to do the join there, the previous link show how to do the join in QGIS.

After loading the grid geometry to BigQuery, I am using this Query to join the two dataset, Grid and my current example, Crime data in Chicago

CREATE OR REPLACE TABLE
  XXXXXX.GIS.crime AS
WITH
  crime AS (
  SELECT
    fbi_code,
    ST_GEOGPOINT(longitude,
      latitude) AS geo,
    longitude,
    latitude
  FROM
    `bigquery-public-data.chicago_crime.crime`)
SELECT
  fbi_code,
  geo,polygon,
  longitude,
  latitude,
  ID
FROM
  crime
JOIN
  XXXX.GIS.Grid AS Grid
ON
  ST_INTERSECTS(geo,
    polygon)

The Query is checking every coordinates and looking up which polygons it belong to, so the Grid table is something like this

And the Query results is like this, we go the ID from the Grid Dataset, Any DB that support geometry can be used SQL Server, PostgreSQL etc

PowerBI

Let’s import those two table to PowerBI, the two tables are joined by the field ID

Luckily PowerBI support WKT format using Icon Map, show the grid with the count of number of coordinates is straightforward

Ok, it is great we have an aggregation of 4 Millions points and we can see the areas with the highest Number of recorded crime, you can filter by FBI code which classify the crime gravity (I have zero knowledge about this dataset, I just used as an example)

Drill Down to individual Cell

because we have the individual points, all I need to do is to generate Multi point geometry using DAX , that’s why I love Icon Map so flexible , The measure will simply detect if the cell ID is filtered or not and then switch between Polygons and Multi point

Geometry =
VAR polygon =
    MIN ( Grid_View[polygon] )
VAR concat =
    CONCATENATEX ( VALUES ( crime[geo] ), crime[geo], "," )
VAR Multi_point = "MULTIPOINT (" & concat & ")"
RETURN
    IF ( ISFILTERED ( dummy_id[id] ), Multi_point, polygon )

Notice Here, as a PowerBI Visual can not filter itseelf, I had to add a dummy dimension

and here is the final result

Take Away

PowerBI Icon map and QGIS is a very powerful combination, and the fact that DAX can generate a geometry on the fly is very interesting Pattern.

Building Complex Data Model using Nested Data in BigQuery

was talking to someone I know on twitter, and got this cryptic reply

I have a vague idea of how to nest two tables, specially Header/Details, it is very easy to conceptualize but I never really understood Json format or how to get multiple levels.

Building a Nested Table

Just for fun I tried to convert this Data Model, a typical Multi fact Star Schema ( apparently it is called galaxy Schema)

I am not going to share the SQL Query that converted those 3 facts Table to 1 Nested Table ( because it is probably horrible), it took me some time to get a mental image how to stack the common dimensions first, and started nesting the common values at lower level, anyway I end up with this schema

And here is a Preview

Querying Nested Table

Front end tools don’t support nested Data by default, you have to flattened it first using SQL , Exception Data Studio but you have to be careful of this bug

A recent interesting development, Looker out of nowhere introduced a New Open Source Analytics Language called “Malloy” , and it has a first class support for nested Data, see example here

It is just a fun exercise, BigQuery support Star Schema just fine, but according to people who work with Big Data, let’s say 2 billion rows and such, not doing join is extremely Faster and cheaper, and apparently it is easier to transfer Data, after all moving one Table is easier than moving three.

Now even if all what you do is Star Schema, it is fruitful to learn other approaches, turn out Json format is useful aft all 🙂