A quick post on a nice functionality in BigQuery, if you create a Materialized view based on Table X, and you run a Query on that Table, the Query Optimizer is smart enough to reroute the Query plan to use the materialized View instead of the base Table, it is faster and substantially cheaper.
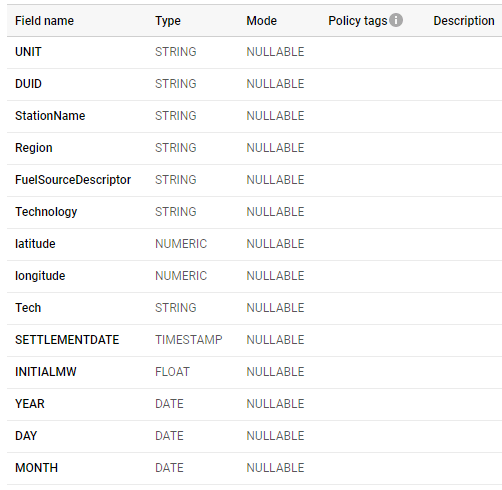
for example, let’s take this table which has a granularity of 5 minute ( 75 Million Records)
let’s create a Materialized view that aggregate at the day Level
CREATE MATERIALIZED VIEW
  XXXXX.ReportingDataset.UNITARCHIVE_Summary AS
SELECT
  StationName,
  DUID,
  DAY,
  SUM(Mwh) AS Mwh
FROM
  `XXXXXX.ReportingDataset.UNITARCHIVE`
GROUP BY
  1,
  2,
  3
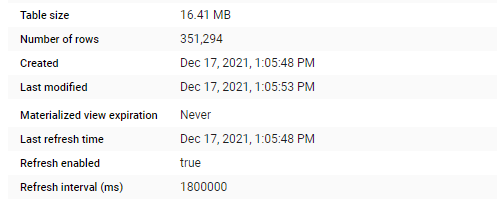
The resulting MV is 16 MB, and 350K rows , notice once you create a MV, you can forget about it, BigQuery make sure it is updated, and for whatever reason if the MV was not updated the Query planner will default back to the base Table, please see documentation for further details
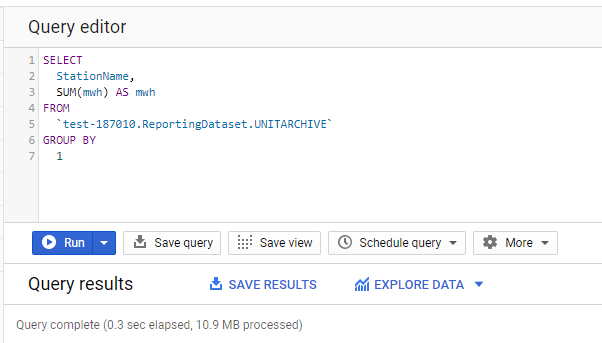
Now here is the interesting Part, let’s make a Query that target the Base Table
because the fields used in the Query exist already in the MV, the Query optimizer change the Query plan to use the MV, instead of scanning GB of data, it end up scanning 10 MB.
How About BI Engine
When Using BigQuery BI Engine performance wise both Queries either Base table or MV will return results in millisecond, but I suspect using Materialized view is beneficial as it uses less resources which means potential even more concurrency.
Edit: March 2022, I am keeping the blog post as it was my first impression at the time, but I have to admit I was wrong, Dedicated Pool is designed for Big Data Workload, Starting from TB, it does not work well at all for small dataset, basically I was testing it for a load that was not design for it.
for Data size in the 100 GB , SQL Server with columnstore index is probably a better option.
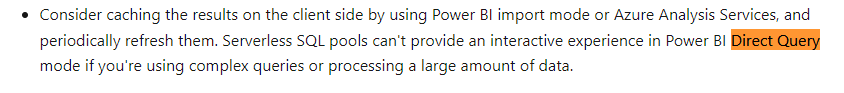
in a previous blog, I showed that Synapse Serverless is not great for interactive BI workload, which is rather obvious as even Microsoft don’t recommend it as a best practice
The logical next step is to have a look at Dedicated Pool ( ex SQL DW), where you don’t pay by data scanned but rather resource reserved, this model make more sense for a steady interactive Workload.
To be very clear, this is a real first impressed, I did not tried any optimization (to be honest I don’t even know how to do it), all I wanted is to get a feeling of the product.
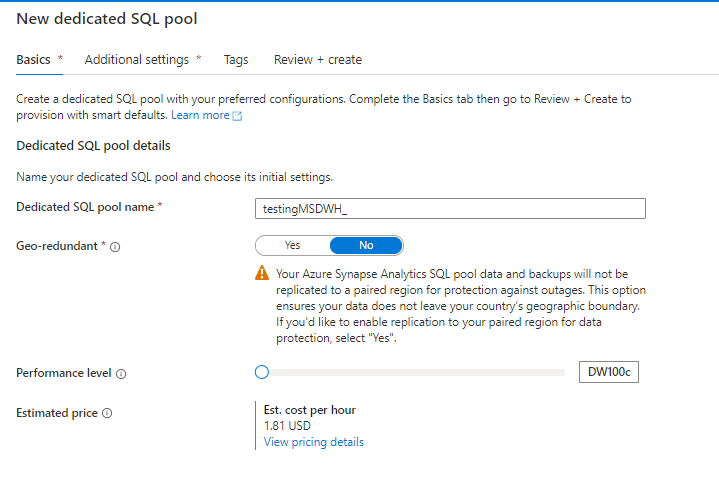
Creating a new cluster is trivial, notice, I have already a Synapse analytics Workspace, Microsoft is very good in creating integrated solution
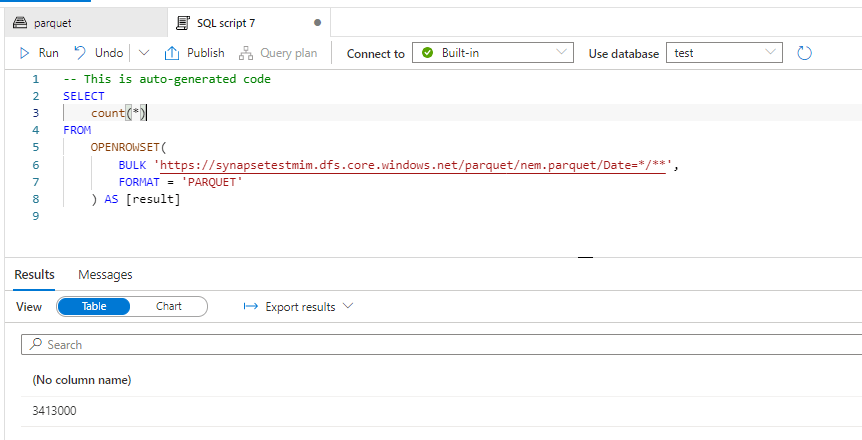
You can directly start running Queries from data store in Azure storage, see example here,in this example , I am selecting serverless here.
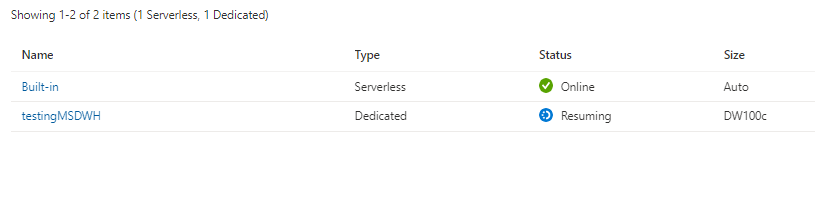
Now using dedicated Pool, I had first to start the cluster as it was suspended, you need to wait a couple of minutes
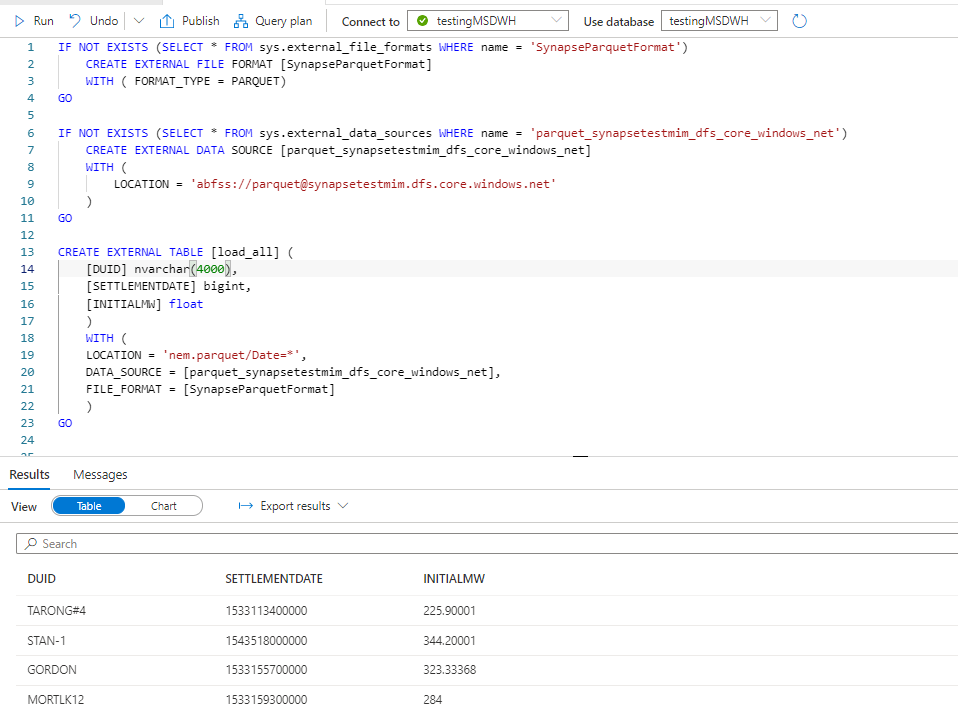
And for some reason, openrowset did not work, instead, I need to create External Table, still very easy
The GUI generate the SQL Script, very nice
DUID is a short string, but I will leave the default value as nvarchart(4000), for some reason the column SETTLEMENTDATE is recognized as a number, it is should be a datetime ( maybe the issue is with parquet file itself), but that’s not a big issue for this blog. the point is you can Query your data lake files either using dedicated pool or Serverless
Native Storage
Dedicated Gen2 does not support a real separation between storage and compute, when you load a table, it has to be allocated to a specific DWH, and cross Query between DWH is not supported ( it is planned since 5 years).
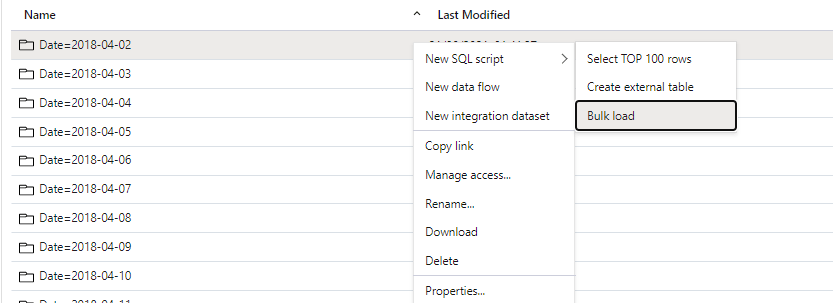
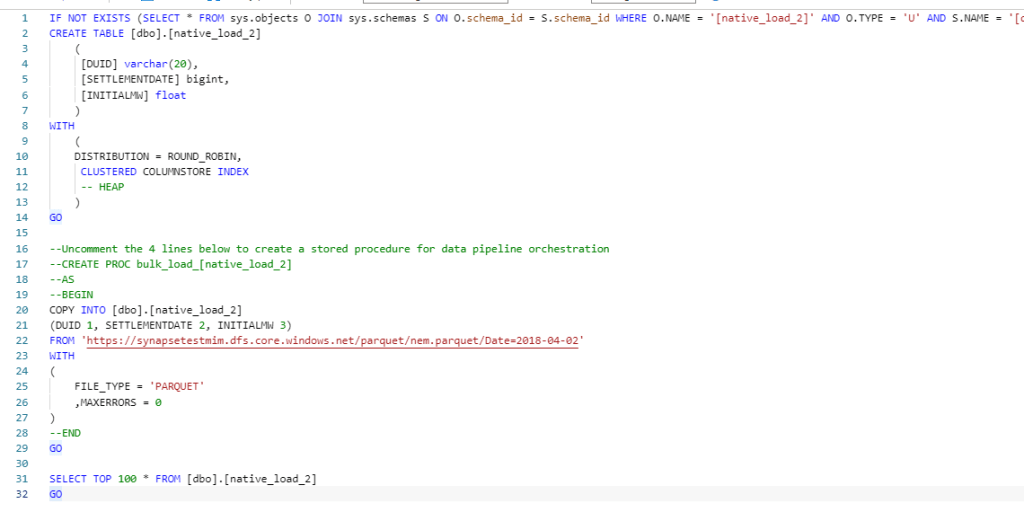
Loading data is very easy, same approach, a GUI will generate a script
and here is the Script generated, I changed the text column to varchar(20)
Now instead of loading only 1 file, I loaded 536 files, it took 8 minutes, that’s seems very slow
Performance
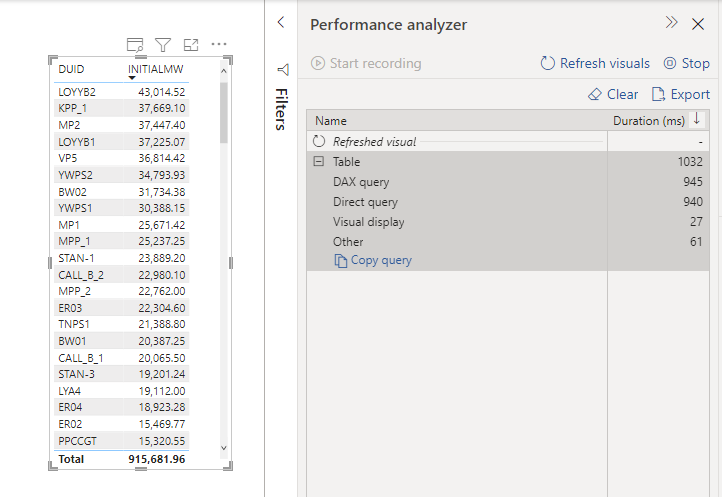
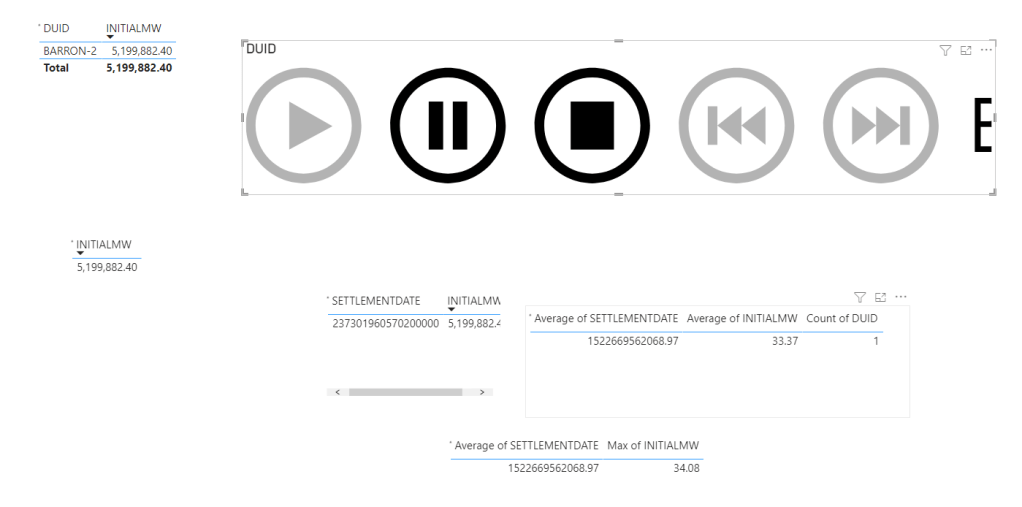
Obviously, it is not a benchmark, but just to get a general feeling, when I test it with a very small table, I did like the results in PowerBI (Direct Query took 940 ms and DAX literally 5 ms)
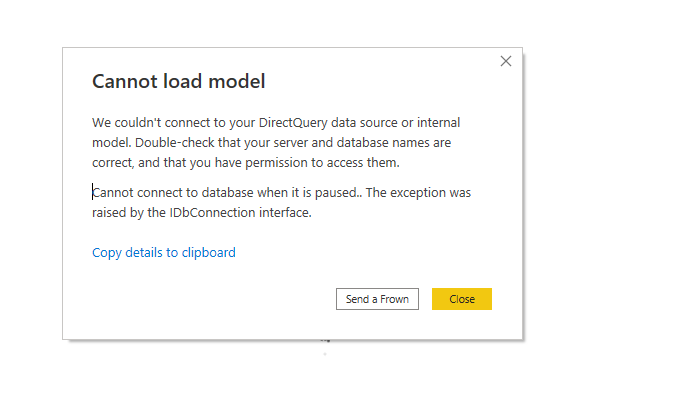
A bit latter, I try it with Another again , first I got this error
it was my fault, when a cluster is suspended, it will not wake up automatically when it receive Queries, you need to manually start it.
The PowerBI report is a simple Direct Query with some table, just to generate multiple SQL Queries
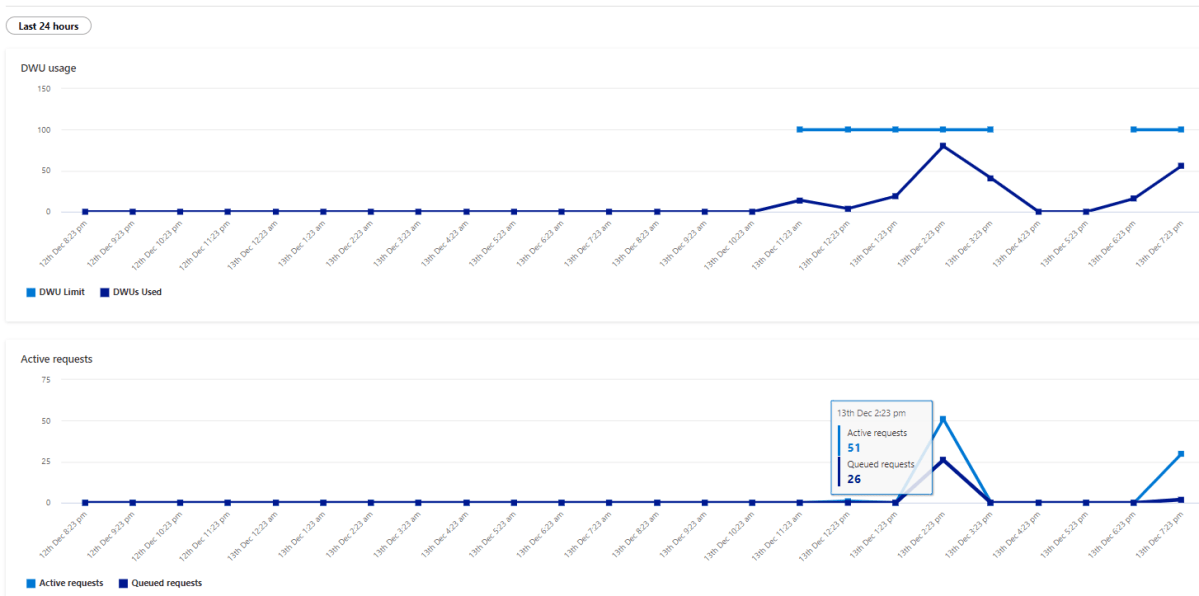
Initially it felt alright, but when I added another instance of the report, things start to feel slow, had a look at the service and SQL Pool has already started adding SQL Queries to the Queue !!!!
Take Away
The Good :
Integration with Azure Storage
The Bad :
1.181 $/Hour is far from being cheap for an entry level tier specially that auto suspend does not Work.
Dedicated Pool is the only major DWH that does not separate Storage from compute, you can’t simply spin up a compute and Cross Query another dataset.
The Ugly :
Performance and concurrency seems particularly poor out of the box.
I am sure there are some optimization that can be done ; for example switch on result cache ( why it is not on by Default ?) maybe partition etc but I wanted just to give a first impression, and honestly color me unimpressed, Better Gen3 be Good.
TL;DR : Random observations after using Snowflake for a couple of hours, there is a lot to likes but mixed feeling about the cost.
For no obvious reason, I felt an urge to try Snowflake, The setup was trivial, you get 30 days trial with $400, no Credit card required.
Snowflake is multi cloud product, first I had to choose the cloud provider and the region, My Personal PowerBI instance is in Melbourne, unfortunately as of this writing it is Only Available in Azure Sydney Region, it make sense to choose the same region for two reasons
Latency, inter region Transfer take more time
Egress Cost, Cloud Provider charge for Inter Region Transfer
For the record my personal data is in GCP Tokyo , but Snowflake is not available there.
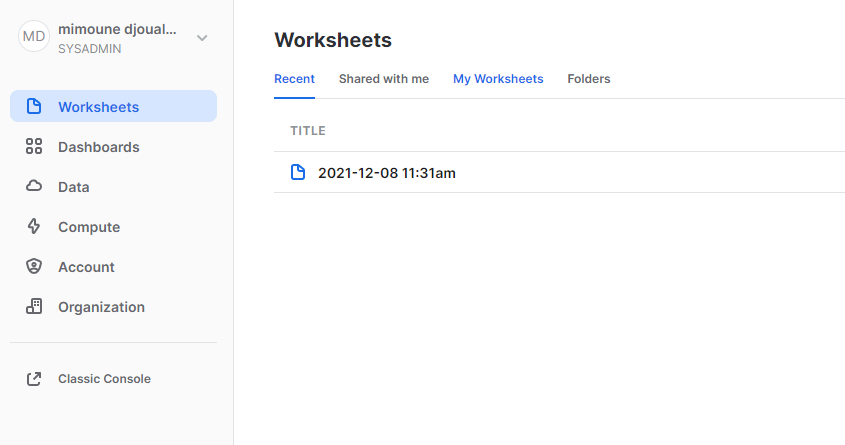
User interface
The User interface is very neat and simplistic ( Good thing), I did not need to check any documentation
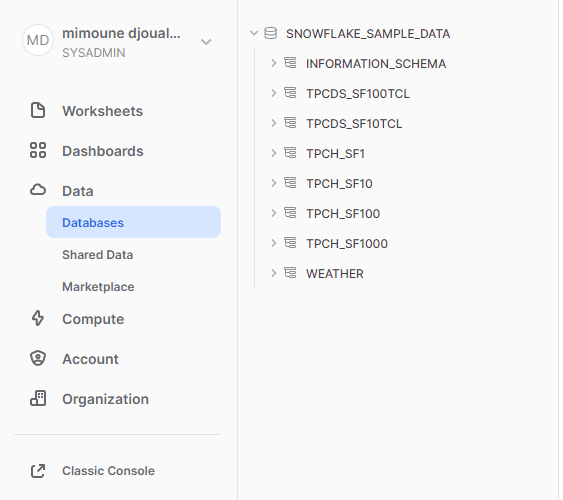
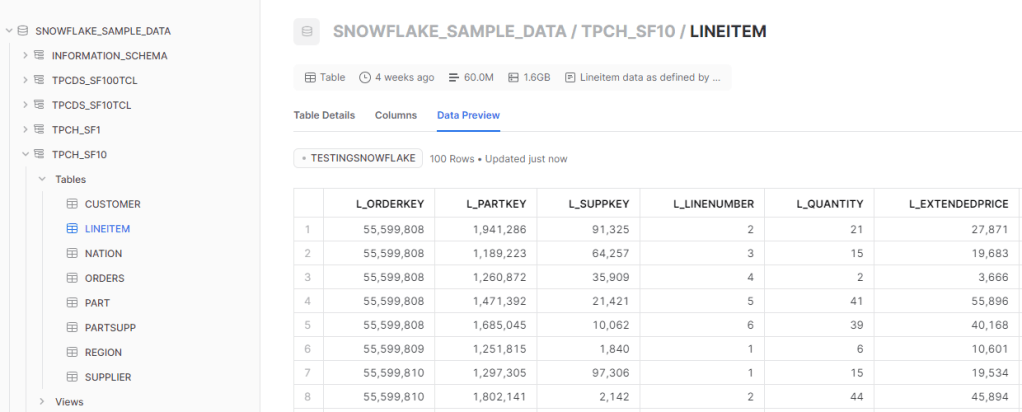
Snowflake provide free sample data by default
and Obviously, you can browser all kind of data from the Marketplace , it is very well integrated and seems trivial to use, as you have noticed already, Snowflake like BigQuery has a total separation between Storage and Compute, so far so good.
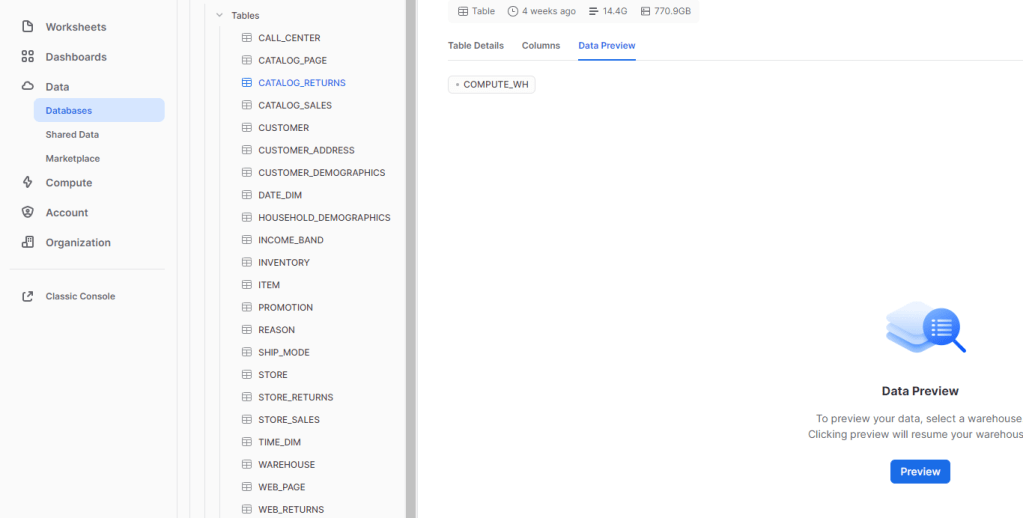
Preview Data
I click on Data Preview, and I got this message
Yes Unlike BigQuery, Data Preview is a paid operation and require a Cluster running.
Create a new Cluster
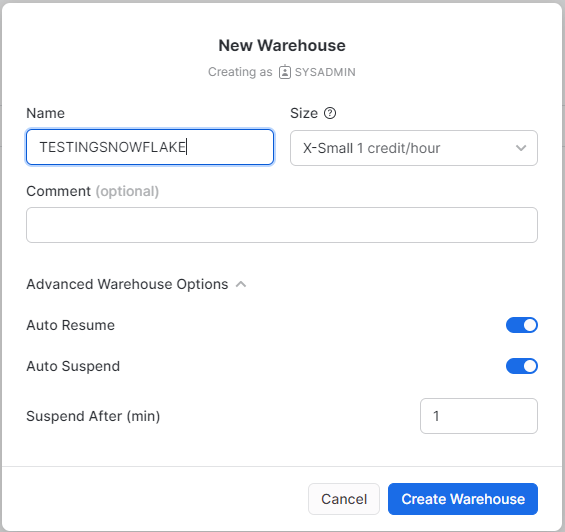
This is the core feature of Snowflake, creating a new cluster is trivial, as a test, I create the smallest possible Cluster.
The Cluster was up and running in a couple of seconds, very Impressive, and the way it works is very simple.
if there is no Query Running, it will shut down after 1 minute ( or whatever you choose), When a new Query showed up for example from a BI tool, the Engine very quickly wake up !!!!
The Minimum Cluster, I could setup was X-Small and it cost 1 credit/Hour ( 2,75 $/Hour), but you pay per second with a 1 minute minimum , I am using Standard Edition, Enterprise edition cost more.
Note : As a BigQuery enthusiast, I hope Google release the auto flex slot
Notice here, Snowflake is not simply a cluster to Run some Queries, but it does have a Service Layer which do a lot of operations behind the scene, personally I am mainly interested in free Results cache, which is freaking fast , as low as a 50 ms !!!!
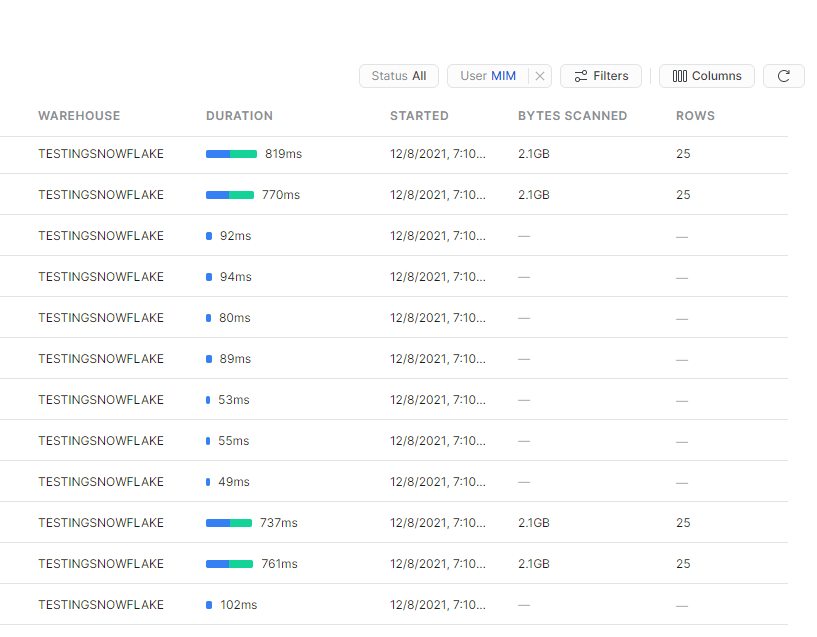
Query History Log
A nice Query history log, I really liked the Client Driver, you can easily tell, if the Queries are coming from an external BI tools or Query from the Console, one very very annoying thing, if you change that view and you came back, you lose the selection and you have to select the columns again, I wish Snowflake could save the customization of the columns.
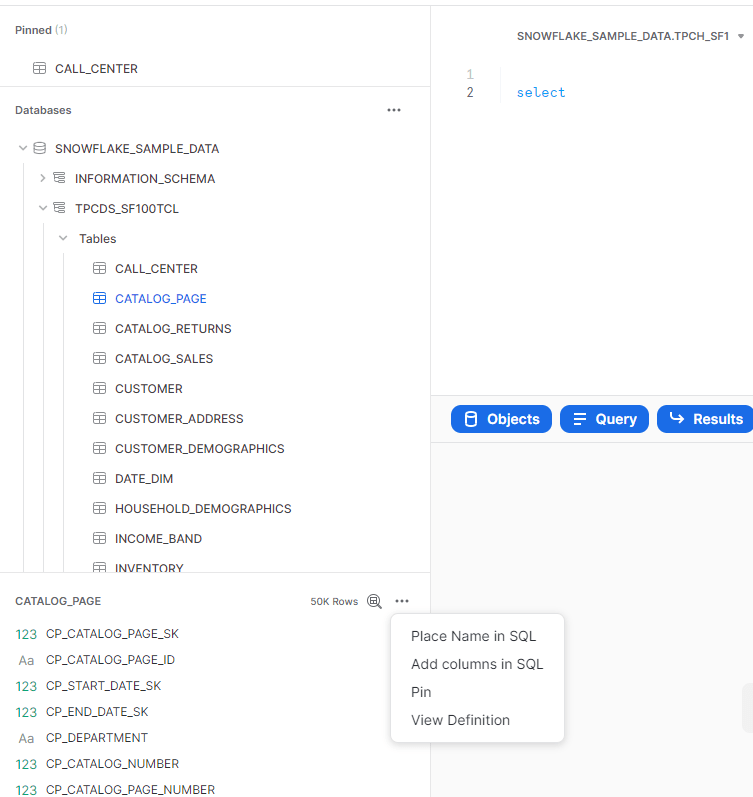
Query Console
it was not very obvious, but to select columns name, you need first to click on a table which open a panel then Click on those three little dot, (it is obvious once you know it) , there is no multi tab support, new Query open a new Window, but honestly seeing the new BigQuery UI, maybe it is not a bad idea after all 🙂
Performance
My initial plan was to use a copy a SQL Script from BigQuery that uses Loops, but turn out Snowflake don’t support DO while ( it is coming for SQL ), there is a workaround using javascript which I may use later, but instead, and just to have a first impression, I used a PowerBI report in DirectQuery mode and see how it goes.
Snowflake Driver for PowerBI is amazing, I never saw a sub second Direct Query in PowerBI before, even when returning 1 row from cache, ( BigQuery Driver for PowerBI is not optimized, I don’t really knows who to blame, Google or Microsoft or probably both, turn out it is Google responsability)
I am using TPCH_SF10 dataset, the main fact Table contains 60 Million records
And here is the Snowflake data Model ( pun intended) in PowerBI using DirectQuery.
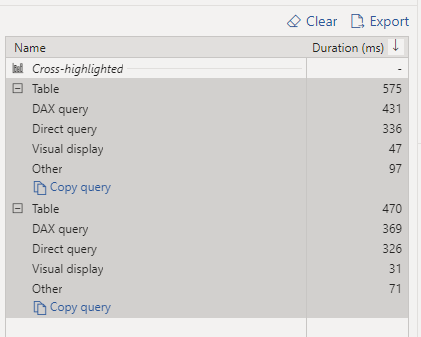
Some results a really intriguing, The ones that don’t have Bytes scanned are cached, but look at this Query that scanned 2.1 GB and returned in 770ms, that’s a BigQuery BI Engine territory right there !!!
The Reason, the Query is in the subsecond, is again because of another type of cache, Snwoflake cache the raw data in the local SSD drive of the cluster, hence it make sense for better performance to keep the Cluster running for a bit longer, if you suspend a Cluster, there is no guarantee that Snowflake will resume the same one.
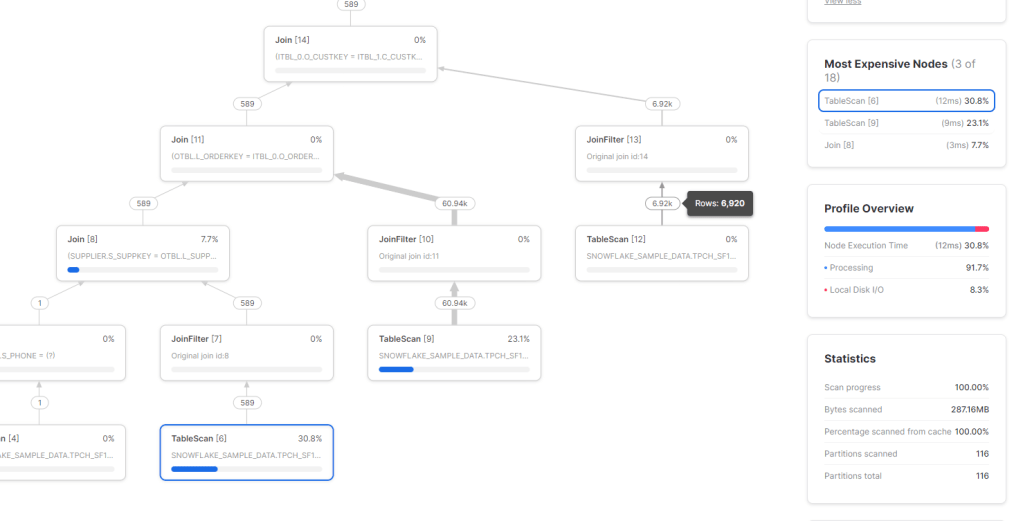
Btw, the Query plan visual is very detailed and explain every step, very nice.
Takeaway
The Quick Auto suspend and resume of Clusters, Global Query result cache and the fact it is a Multi Cloud offering are the key strength of Snowflake.
I was really surprised by the experience of using Snowflake Direct Query with PowerBI, and the data marketplace was a very polished experience.
I will show my bias here , for 2.75 $/Hour I can reserved a BigQuery BI Engine instance with 50 GB in-memory RAM, it will be interesting to compare the performance and concurrency of Both Engine.
Note : if you are using flat price, nothing to see here 🙂
TL; DR : This blog is about a particular use case, assume a customer is using on demand pricing for BigQuery ( 5 $/ TB scanned) and bought some BI Engine reservation (1 $/1 GB compressed/Day), Currently under heavy load, BI Engine fallback to BigQuery, I think it is a problematic behavior and the customer should have the option.
Add the Queries to a Queue, slower but an order of magnitude cheaper
At least have an option to define the behavior.
The Use Case
Let’s say you have a relatively small table and you expect around 20 concurrent users Querying it, using a Live connection from Tableau or Data Studio.
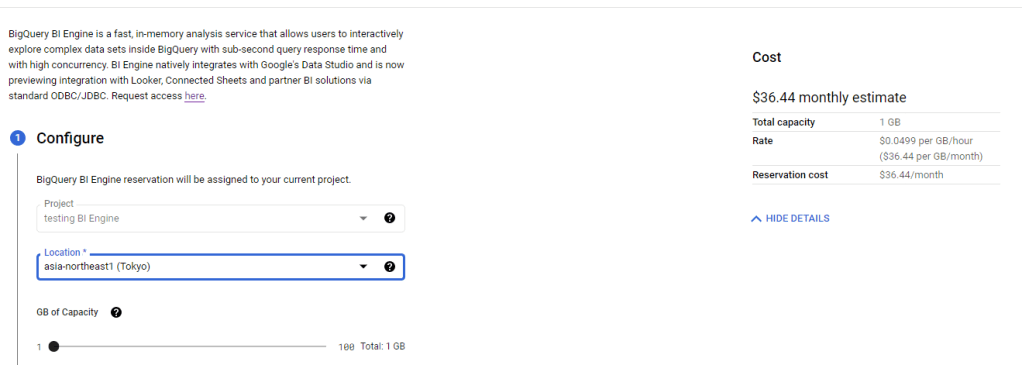
First let’s create 1 GB reservation. ( 36.44 $/Month)
Simulate Query Load
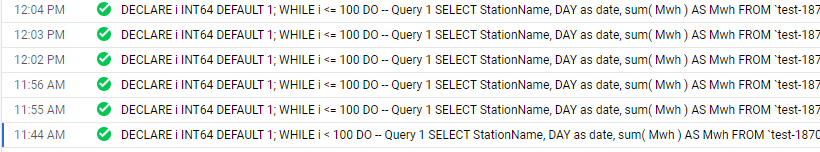
In a previous blog, I got complains that my benchmark is not reproducible, this time, I am using a different Approach, although it is the same base Table ( 74 Million records with new data every 5 minutes) , I am using a SQL Script that run 100 time, every time it generate 5 sequential Queries, and to avoid any cache the date filter is random, something like this
SELECT
    StationName,
    DAY as date,
    sum( Mwh ) AS Mwh
  FROM
    `test-187010.ReportingDataset.Nem_View`
  where DAY >= date_add(DATE "2016-12-25",INTERVAL cast(floor(rand()*100)+1 as INT64) DAY)
  GROUP BY
    1,
    2
  ORDER BY
    date ASC
    Limit 1000
The data is public you can test it yourself, notice it is saved in Tokyo Region, BI Engine should be in the same Region.
The test Load is simple, run the first script and then slowly increasing the number of script running in parallel, the idea is to simulate an increase in concurrency
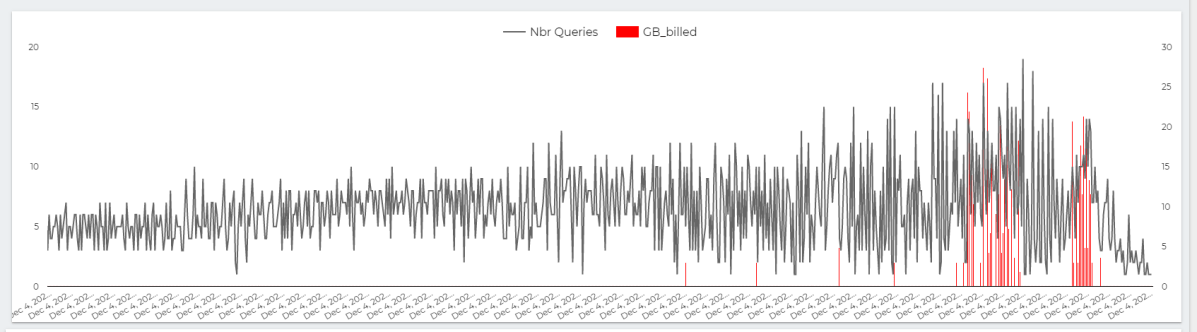
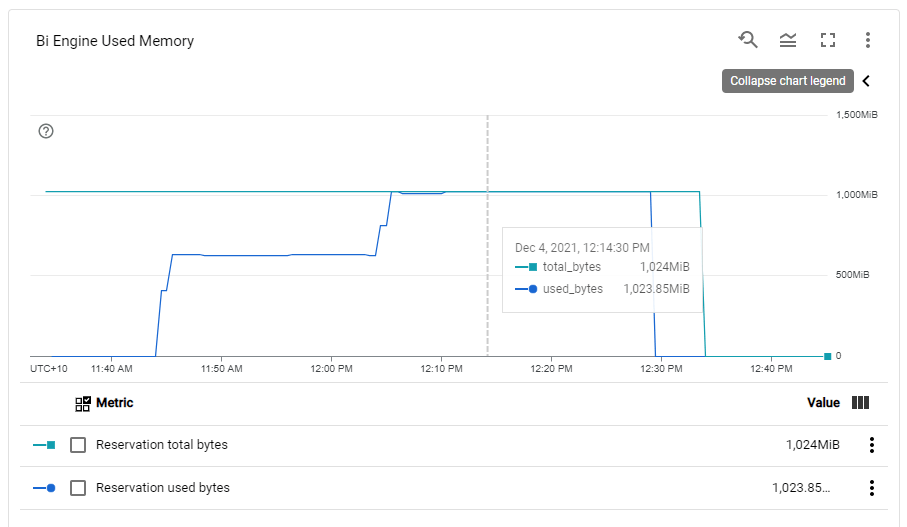
BI Engine consume more memory when the load increase, Very Nice 🙂
This chart show the number of Queries per second , The Red Line is GB Billed, The red Line is something that worry me a lot.
The whole value proposition of BI engine is the cost, yes it is fast and all but as far as I am concerned, it make Interactive Live BI workload very cost effective, on demanding Pricing is useful for ETL workload, not serving Queries.
Note : you can’t use BI Engine for transformation, saving Query results to a permanent table is not supported.
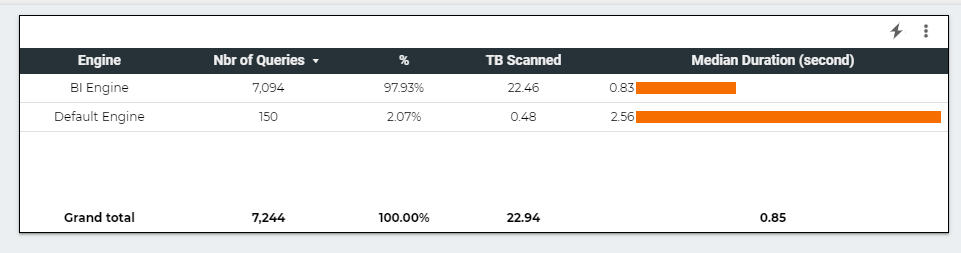
Here is The Workload Breakdown.
let’s admit the obvious here, BI Engine scanned 22 TB of data in less than an Hour for the cost of 5 cents, it handled the load gracefully, till we start getting 17 concurrent Queries ( your mileage will vary based on the query complexity, volume of data etc etc )
but when BI Engine got overloaded with Queries, it fall back to BigQuery on demanding pricing which in no time consumed the daily Quota ( 500 GB) for a cost of 2.5 $. ( always set up a quota per day)
The Math is very simple, 22 TB for 5 cents versus 0.5 TB for 2.5 $
What‘s the solution
I really would like that BigQuery behavior change, if BI engine is overload, just added the Queries to a Queue to slow down things, or at least make this behavior optional, let the customer decide, if we need more concurrency we can by more memory, but don’t make the decision on our behalf.
PowerBI Vertipaq, which is in the same tech category, handle it differently, if you reach a limit, the Engine will simply throttle the Queries, I think BI Engine should behave the same 🙂
Takeway
For the Previous workload, and to support high level concurrency, and keep a Low cost, the Reserved memory Should be 2 GB, The Good news, the Product Team is working on Auto Scaling, No ETA though.