
in 2017, at my previous job, we were using PowerBI Desktop as our reporting solution, but there was a big limitation, we couldn’t use the service, so sharing the reports was either in Excel or pdf.
I remember I did try different solutions (Rstudio, Qlik, SSRS), they were great Products, but you need some kind of server to share the reports. At that time all I wanted is a simple web app where people can click on a slicer and get a fancy charts.
At that time Google made their reporting solution free, I was really excited about Data Studio, a free product, extremely easy to share but unfortunately a bit slow and lacked some basic functionality, I still managed to build something but it was not really good
It is all history now, moved to another job, we have PowerBI service ( and Tableau), but still for some reason, I felt like a missed opportunity, what if Data Studio became a good enough to be used as a free report tool.
If I remember correctly 2017 and 2018, there was no major progress but then they released custom viz, which basically means you can port any javacript library relatively easily , I managed to build a custom viz see example here

and in sept 2019, BI Engine showed up !!

It was really a big Deal, BI Engine is an analytics in-memory Database , and it is fast and they gave away 1 GB for free, it means you can connect your data from BigQuery and pay nothing ( with a fair limit of course), this made this report possible

In May 2020, they finally released Google Map Integration , although with a limit of 10K points, it was not useful for my use cases ( Solar farm needs a lot of point around 40k to 60K)

That was great and all, but still I couldn’t write complex measures easily ( or maybe did not know how), but something changed in August 2020

At last we have Proper support for parameter, that changed everything, now you can write any complex business logic using SQL in BigQuery and visualize the results using Google Data Studio, and you can do a lot of fancy stuff see those examples
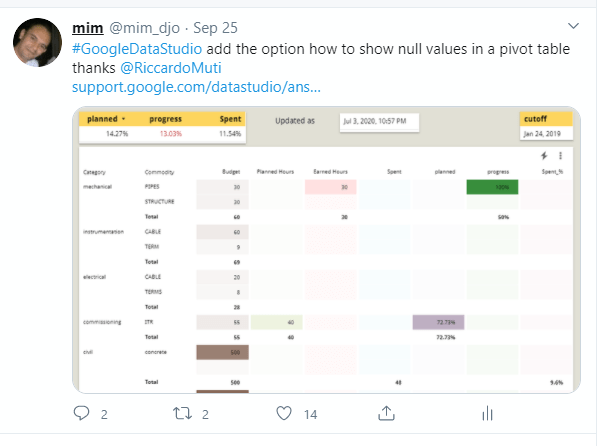
Still there was still a major bug, Pivot table in Data Studio show 0 for null values needless to say, it is extremely annoying although you can build workaround, it was a hack and not sustainable.
That was fixed last week
So yes, it took me three years to finish this report, BI Engine + Parameter + Custom Viz and a bug fix in the Pivot Table to make this report possible
I added a workflow explanation in the report, but basically create a reporting dataset as large flat fact table and show the results in BigQuery with further control by SQL Parameter, if the native visual are not satisfying, you can show pretty much anything using Vega-lite custom viz.
One aspect was impossible to do without Parameter is the dynamic grouping of dates, in the time series, the weekend update dynamically based on the cut off selected.

Please don’t get me wrong, there is still a lot of work to be done, but the foundation of the product is already there, I can see clearly the vision of the product team, hopefully they keep investing but faster this time ( Parameter Action, support for BigQuery geography field, analytics functions, Tiles for Custom Viz ……)
Take away:
– If you need near real time reports
– You want a reporting solution and don’t have a decent budget.
– Used Data Studio in 2017 and dismiss it.
I have a good news for you, BigQuery/Data Studio is a viable option now, and you get 1 TB free for BigQuery and 1 GB compressed in -memory for BI Engine, that’s a lot of free resources, and there is no catch, you can share securely with anyone, again totally free.
Although I am a PowerBI developer and I love it, I think it is very healthy for the industry to have more choices, 2021 will be exciting !!!

Mimo your creative as usual and dedcated to advancing in your career
Really always looking forward to see your inventions in plannng
Think of giving a course on this integration
Waiting for more my friend
Rami
LikeLike
Cheers Rami
LikeLike