PowerBI Hybrid Table, you can have your cake and Eat it too.

Hybrid table is a Clever technical solution to a very fundamental problem in Data Analytics, How to keep Data fresh and at the same time fast, PowerBI , Tableau, Qlik solved this problem by importing data to a local Cache, this solution work for most of the use cases, but as with any solution it has limitation.

  • If the Data Source is too big, you can’t simply keep importing to the local cache.
  • If the Data Source change very frequently, like every couple of minutes or second, importing become just not practical or very hard.

PowerBI Engine team came up with a very simple Idea, you can have both Mode in the same table, Historical data that don’t change is cached and today data is queried live as it changed very quickly, Patrick from Guy in the Cube has a great video , Andy has another Video but specific to Synapse Serverless

This functionality was released in the December 2021 edition of PowerBI , but unfortunately when I test it with BigQuery, it did not work, I reported the issue and I have to say, I was really impressed by the Product team, (Kudos to Christian Wade and Krystian Sakowski ), yesterday they released an updated version and it fixed the issue. (it works with Snowflake, Databricks etc)
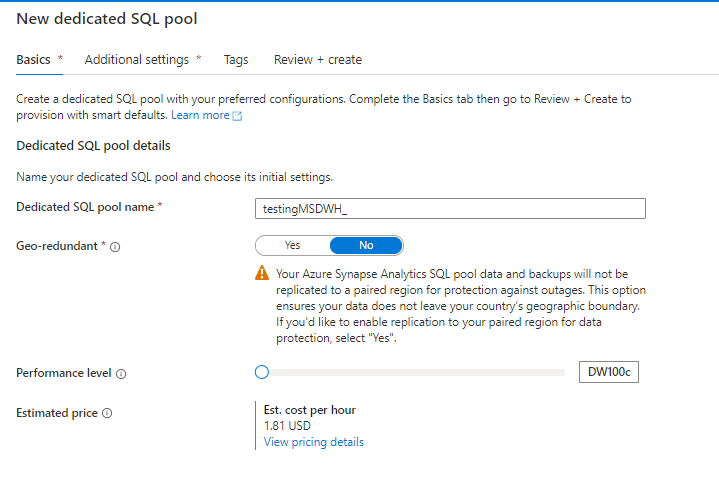
Setup

it is literary just an extra box to click compared to the Previous incremental refresh User interface

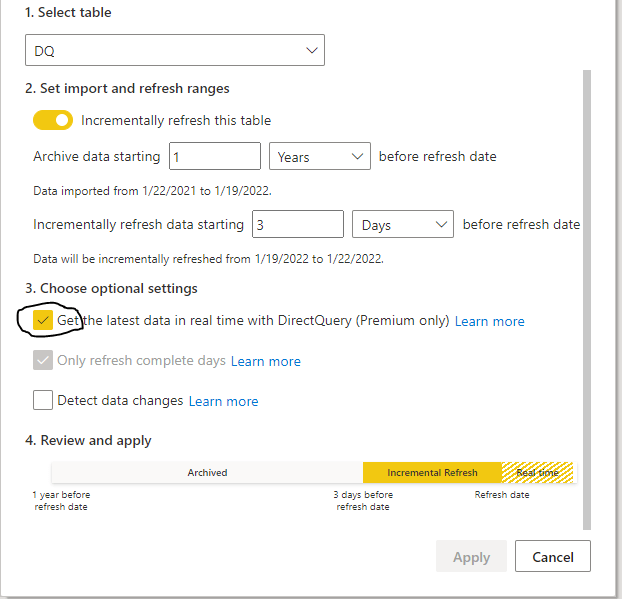
Yes, Just like that, The Engine will generate table partitions behind the scene, if you want to know why PowerBI is so successful, it is because of stuff like this, take a very hard problem and make it extremely easy for Non Tech people to use.

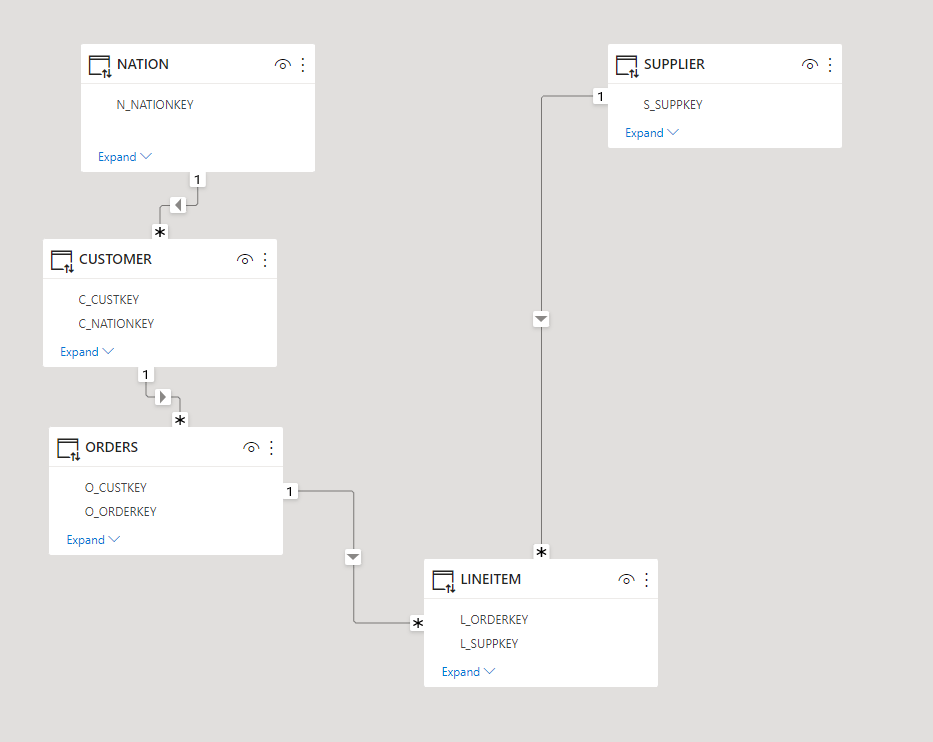
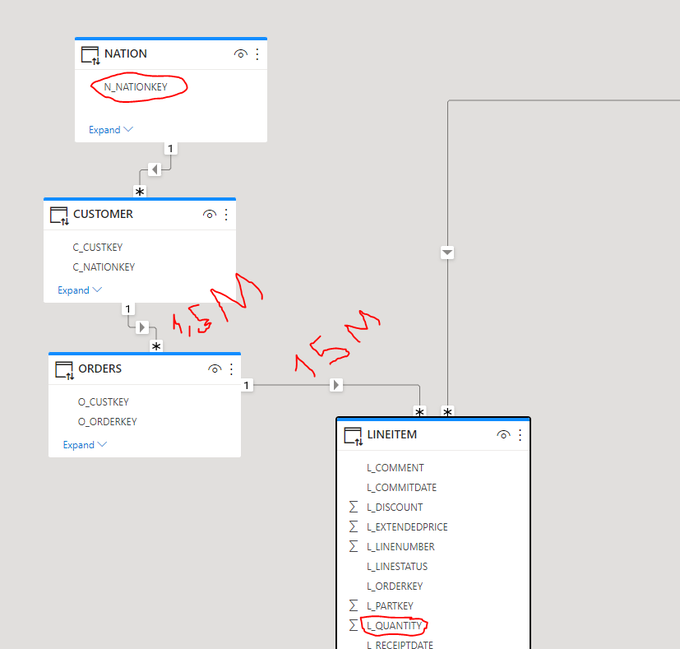
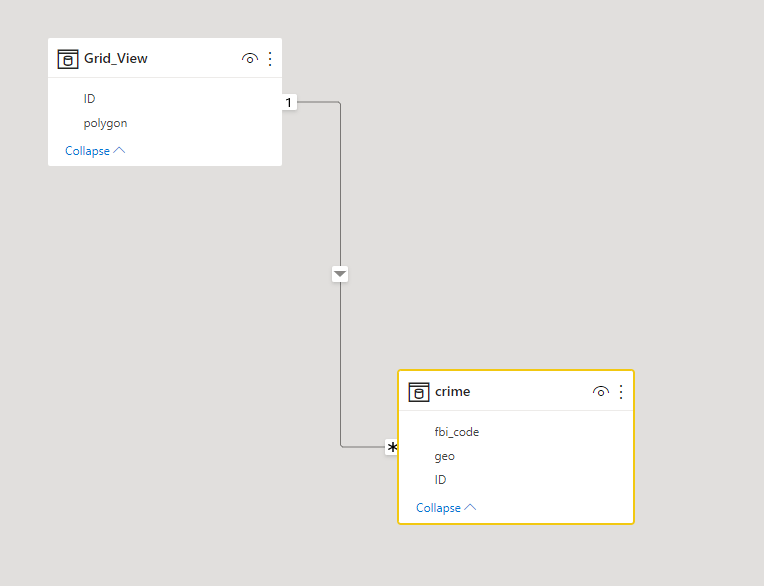
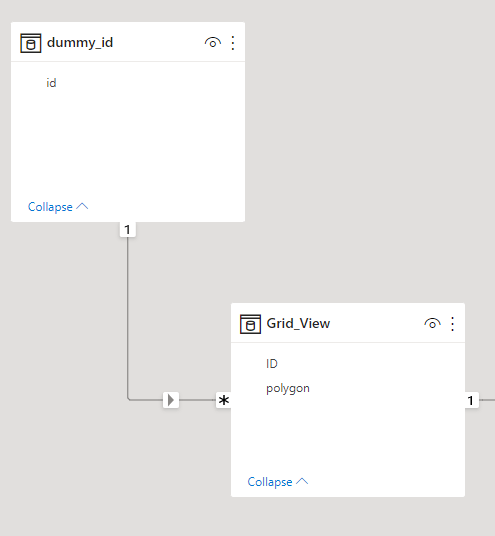
The Data Model is very simple; one fact table with Data that change every couple of minutes, and a Date dimension in a Mixed mode, ( watch Patrick Video, he explain why)

Premium Only

Yes, it is a premium only feature, and obviously it works with Premium per User, I am not going to complain, someone needs to pay for those R&D cost, but it will be really nice if they release it to the PRO license too, it just feels Odd that a core feature of the Engine is tied to a particular license, we had this situation before with incremental refresh and they did release it even for the free license, I hope the same will happen with Hybrid Table.
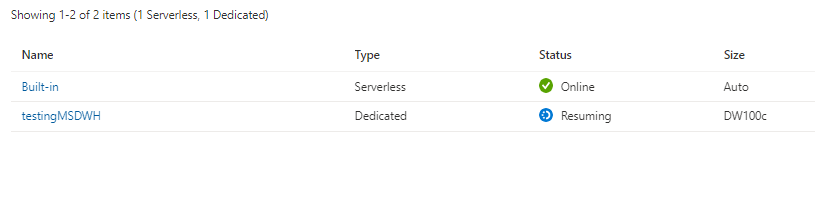
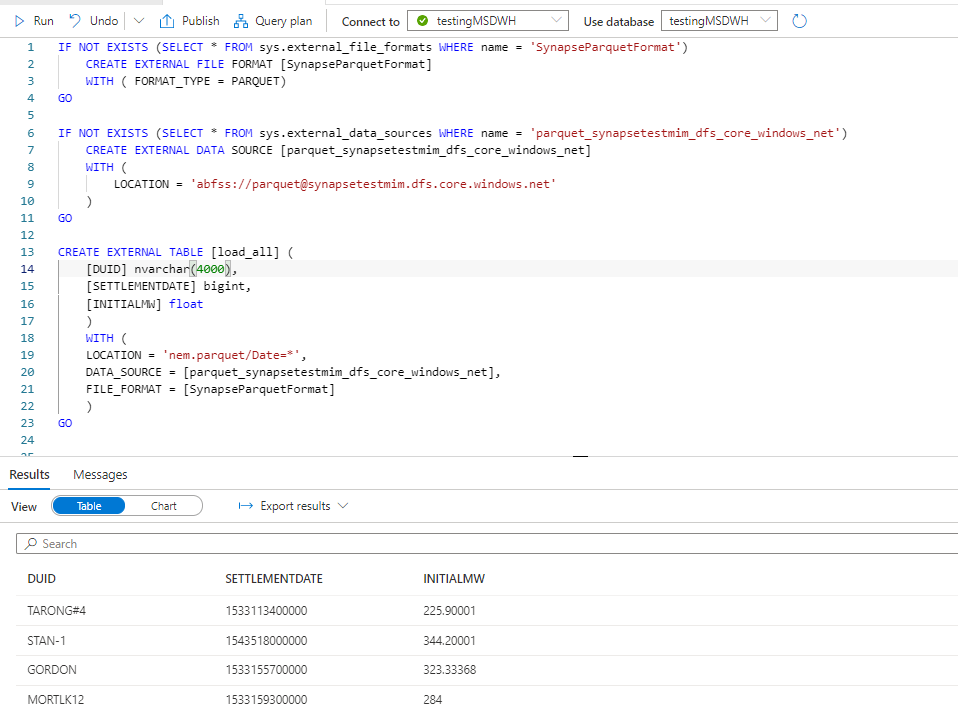
Mixed Partitions

I published the report to the service, and used Tabular Editor to see what’s going on behind the scene (make sure you download the latest version of Tabular Editor, works with the free version too)

Image

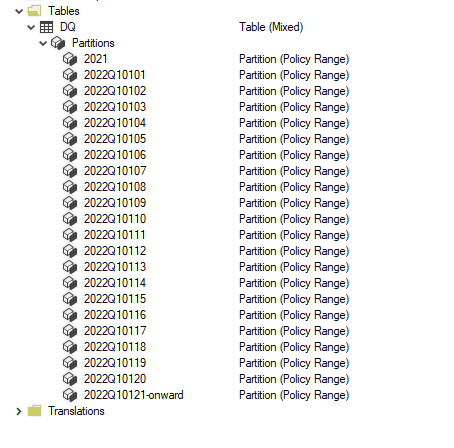
As expected the Last Partition is Live Mode, and everything else is cached in PowerBI.

How it Works

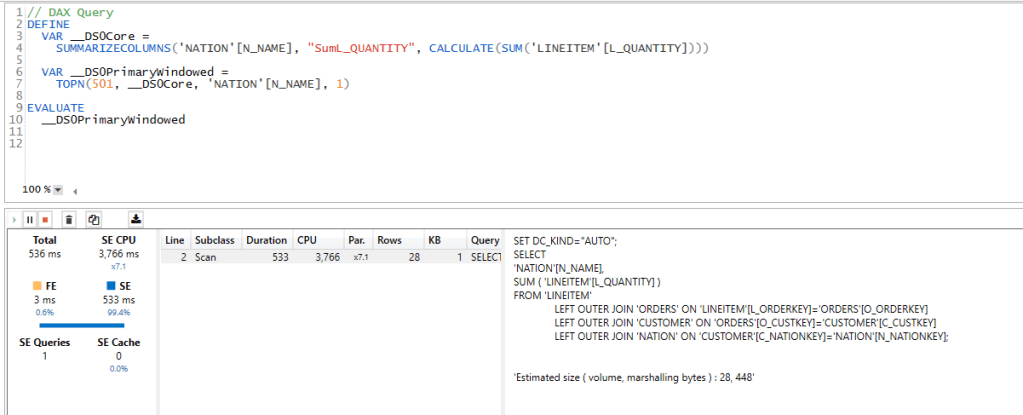
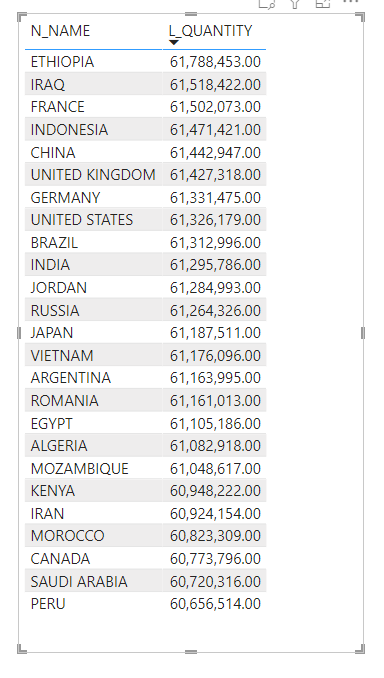
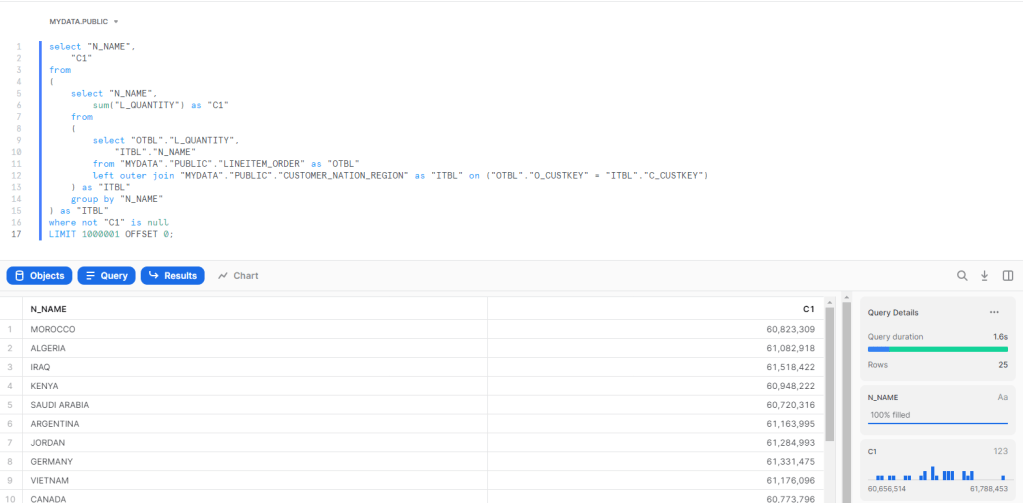
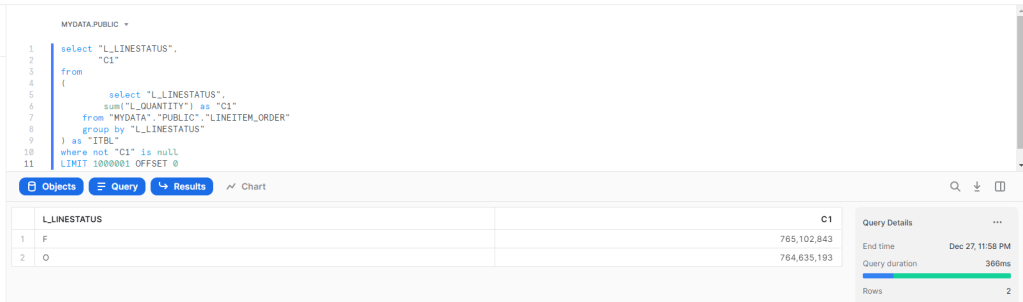
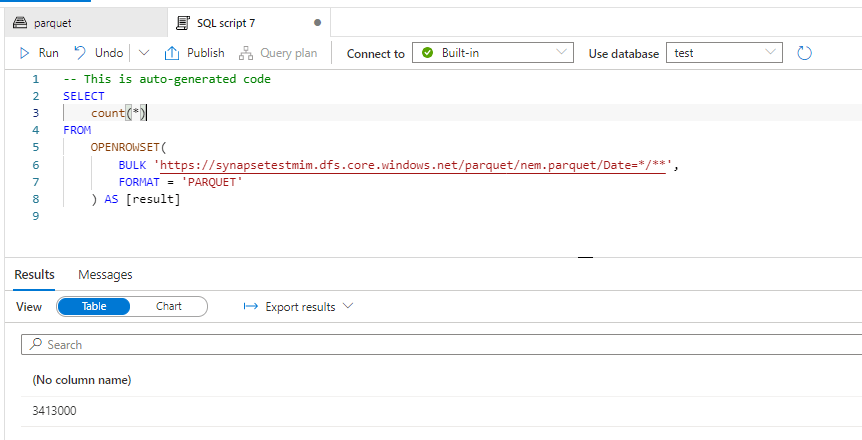
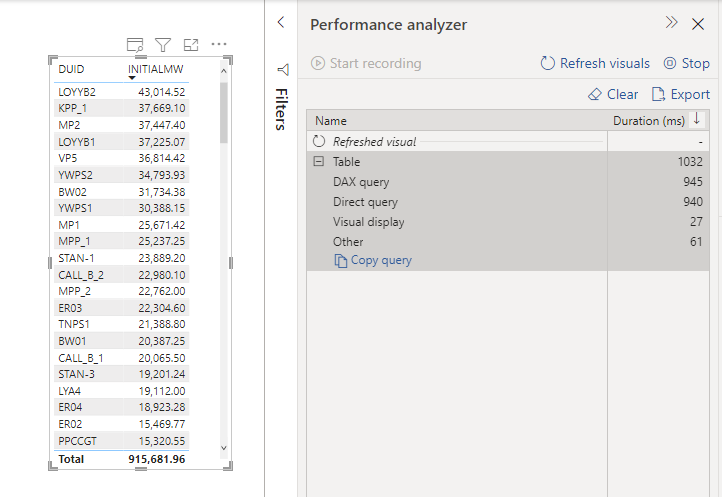
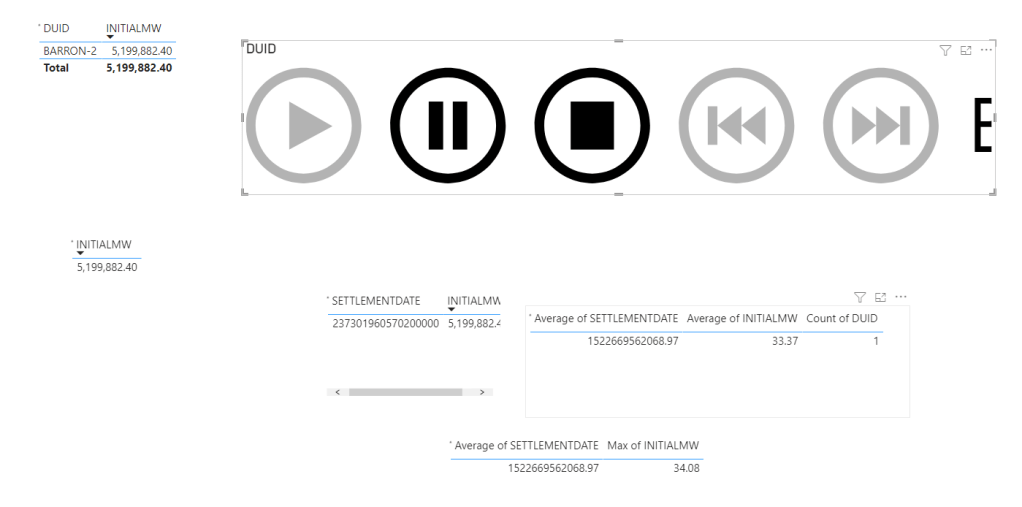
I used DAX Studio to capture what the engine is doing when you run a Query

Image

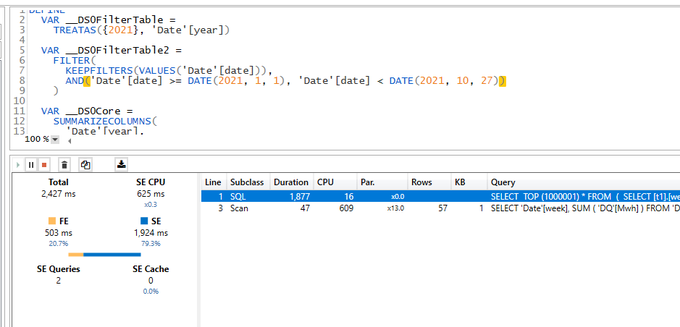
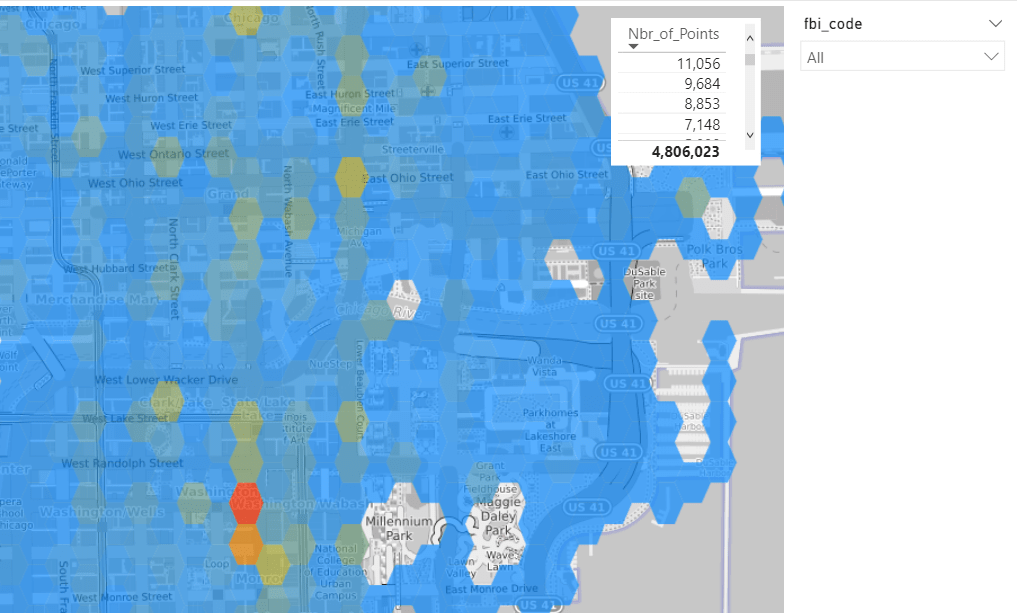
PowerBI formula engine send two Queries one to the remote DB in my case BigQuery and the local Storage, you can clearly see the difference in speed

1 Day using DQ : 2 second ( the Query take 400 ms at the end point, But BigQuery has a very substandard ODBC driver)

13 Months worth of Data Cached : 47 ms

The Point is, if you can just import, do it, you will get the best performance and user experience

( At Work we have a sub 5 minute pipeline end to end from the Source DB to PowerBI).

The Devil is in the details

As far as I can tell, Formula Engine keep sending two Queries every time, even when the required data is cached already, obviously the Query from the external DB will return null results, in Theory , it should not be a big deal, Modern DW are fast specially with partitioning pruning.

Unfortunately no, only some Database can return a sub second null result set to PowerBI ( yes the Quality of the Driver is as important as the DB Engine itself)

Take Away

It is a very interesting solution worth testing for specific scenarios, but if you can get away with Importing data only, then it is still the best way, yes Hybrid Table reduce the Workload on the remote Database, but still you need a solid Database, getting a sub second Query from end to end is still a hard problem even for 1 day worth of data ( just test it, don’t forget concurrency )

I heard a different use cases, which I find very intriguing, some users want the other way around, recent Data as Import and historical Data as Direct Query, I guess it is useful if you have a real big fact Table.

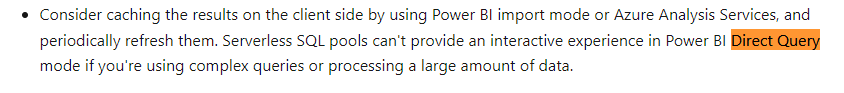
A Surprising side effect of PowerBI Hybrid table,( maybe it was planned, who knows) Synapse Serverless in Direct Query mode looks now like a very good candidate to use, scanning one day of data is faster and an order of magnitude cheaper !!!

I still Hope that the Vetipaq Engine team surprise us in a future update and somehow let the Formula engine generate only 1 Query when all Data needed is in the Local cache.

PowerBI Vertipaq Vs Snowflake Vs BigQuery BI Engine

Another Short blog on my favorite topic, High Concurrency, Low latency Interactive BI Workload, I can’t test everything, but so far, I am impressed by BigQuery BI Engine and Snowflake on Azure, a reader may thinks, I have an anti-Microsoft bias which is nonsense, I think Microsoft has a different approach, Data warehouse is for storage and Transformation but as a serving layer, you load your reporting tables into a Tabular Model (PowerBI, Analysis Services)

PowerBI tabular model, at a very highly level consists of an analytical Database and a semantic Model, for the purpose of this blog , I am only interested in The Vertipaq database order of magnitude performance, it is not a benchmark, I am just asking a lot of questions, and hopefully start a conversation.

Just a note for readers not familiar with PowerBI, when PowerBI uses Direct Query Mode, it means The tabular Model using the existing semantic Model will send the Queries to the resource system directly and Vertipaq is not used.

What’s the difference between the Three Engines

Although all the three are Columnars Database, They use different tech and implement different assumption, it is a very technical subject and I am afraid there is not enough literature, but from my perspective as a user,I have notice the following.

  • BigQuery BI Engine : The Data is loaded from BigQuery Storage to Memory, if the base tables changes, the data is reloaded nearly in near time, Only Column and partition needed for the Query are loaded, it does implement in-Memory compression , but , according to the dev, the engine may leave some columns without Compression for performance reason, I think it is a balance between compression overhead and loading data from the storage as soon as possible (This is my own speculation, I am sure it is much more complex), if the Query is not supported or the data scanned is too Big, it fall back to BigQuery, Mosha has a nice technical Video about the Engine

  • Snowflake : I Notice the data can be cached in the local SSD drive, the performance became substantially faster, Although it is not an in-memory Database, I was genuinely Impressed by the performance. ( To honest I don’t know much about Snowflake)

Vertipaq : When the data is loaded from the Disk Storage to memory, all the Model is loaded, it means all the tables and columns, unlike the previous two engine, you can’t load only a subset of the data or only columns needed for the Queries, you have to manually make that selection either by importing only the columns you think you will need initially and the same by filtering a subset of the rows.

Basically, it is another independant copy of the data, and you need ETL process to make sure the data is synchronized between the source Data Storage and Vertipaq Storage, Marco Russo has a detailed Video about the Engine

Note regarding relationship

Since I start using PowerBI, I was always mystified by the performance of Vertipaq joins, it is well known, joins are expensive in all Databases, Vertipaq seems to be the exception, initially I started with this Model

Image

I asked a simple Question, what’s the total Quantity by Country, to get the answer the filter has to traverse some non trivial relationship ( Customer to order, 1.5 Millions distinct value, and then orders to Lineitem 15 Million distinct value)

  • Vertipaq gave the results in 536ms !!!!
  • Snowflake 2.9 Second.
  • BI Engine did fall back to BigQuery (4 second), BI engine has a limitation of 5 Million Dim Table

Vertipaq Materialized the joins, I don’t know how an analytical Database can compete with this implementation, but I read that firebolt has something called Join Index ( to be verified, I have not test it myself), anyway here the duration using DAX Studio, it is very fast

Star Schema Model

As BI Engine does not support yet a join with more than 5 millions rows, I changed the Semantic Model to a Star Schema, I did join the table order and Lineitem and create 1 wide fact Table, Notice I am using the sample Data provided by Snowflake TPC-H with a factor of 10, the main fact is 60 Millions rows. The supplier is 100K rows and Customer is 1.5 Millions rows.

Snowflake is using the x-Small, cost $2.75 /Hour

BigQuery : 1 GB cost 5 cents/Hour

Vertipaq : Using my PowerBI Desktop.

Joins Performance

Using the Start Schema Model, and the same Question, total Quantity sold by country ( I know the metric is not very useful, but I am interested only in performance)

BI Engine : Around 1.8 Sec, I had to Cluster the Table by Custkey.

Snowflake : 1.6 S

Vertipaq, using Materialized relationship average 52 ms

Vertipaq using runtime joins : Average 8 S

I used TREATAS to simulate a join without a physical relationship ( I hope my DAX is not wrong)

sum_Quantity_Virtual = 
CALCULATE (
    SUM ( lineitem_orders[L_QUANTITY] ),
    TREATAS (
        VALUES ( customer_nation_region[C_CUSTKEY] ),
        lineitem_orders[O_CUSTKEY]
    )
)

and here is the results using DAX Studio

Group by using Same Table

A simple Query, total Quantity by Line Status

BI Engine : 200 ms

Vertipaq : 6.8 ms , yeah, it is not a mistake, and it is not a result cache, honestly I have no idea how it is even possible to get this result.

Snowflake : 366 ms

Takeway

  • It is a no surprise, Vertipaq is extremely fast, at least for a small dataset, Analytical Database can’t really compete, Materialized relationship are awesome, but you need to make a copy of your data, usually it is not an issue, until your data is too big or too volatile, Microsoft is aware of this and added feature like Hybrid Table will help

  • Another interesting Question, at what Data Size Analytical DWH become faster than PowerBI Vertipaq ?

  • This one is my own speculation, Maybe Analytical DWH don’t need to be as fast as Vertipaq, maybe not having to copy data is a bigger advantage than having a response time in less than 100 ms.
  • I write only about Tech that I have used personally, but it seems, Firebolt and SingleStore serve the same workload too, my experience with Databricks SQL was a mixed feeling, I don’t think it is fast enough for this workload.

For the kind of work I do, Vertipaq is a Godsend, it is very fast, it tolerate wrong design choices, and for the majority of my workload it is the best solution in the market, and it was battle tested for 10 years, with a lot of real life optimization.

Having said that, it is just a Database competing indirectly with other technology for the same Workload, and some competitors are getting dangerously good.

First Look at Synapse Dedicated Pool

Edit: March 2022, I am keeping the blog post as it was my first impression at the time, but I have to admit I was wrong, Dedicated Pool is designed for Big Data Workload, Starting from TB, it does not work well at all for small dataset, basically I was testing it for a load that was not design for it.

for Data size in the 100 GB , SQL Server with columnstore index is probably a better option.

in a previous blog, I showed that Synapse Serverless is not great for interactive BI workload, which is rather obvious as even Microsoft don’t recommend it as a best practice

The logical next step is to have a look at Dedicated Pool ( ex SQL DW), where you don’t pay by data scanned but rather resource reserved, this model make more sense for a steady interactive Workload.

To be very clear, this is a real first impressed, I did not tried any optimization (to be honest I don’t even know how to do it), all I wanted is to get a feeling of the product.

Creating a new cluster is trivial, notice, I have already a Synapse analytics Workspace, Microsoft is very good in creating integrated solution

You can directly start running Queries from data store in Azure storage, see example here,in this example , I am selecting serverless here.

Now using dedicated Pool, I had first to start the cluster as it was suspended, you need to wait a couple of minutes

And for some reason, openrowset did not work, instead, I need to create External Table, still very easy

The GUI generate the SQL Script, very nice

DUID is a short string, but I will leave the default value as nvarchart(4000), for some reason the column SETTLEMENTDATE is recognized as a number, it is should be a datetime ( maybe the issue is with parquet file itself), but that’s not a big issue for this blog. the point is you can Query your data lake files either using dedicated pool or Serverless

Native Storage

Dedicated Gen2 does not support a real separation between storage and compute, when you load a table, it has to be allocated to a specific DWH, and cross Query between DWH is not supported ( it is planned since 5 years).

Loading data is very easy, same approach, a GUI will generate a script

and here is the Script generated, I changed the text column to varchar(20)

Now instead of loading only 1 file, I loaded 536 files, it took 8 minutes, that’s seems very slow

Performance

Obviously, it is not a benchmark, but just to get a general feeling, when I test it with a very small table, I did like the results in PowerBI (Direct Query took 940 ms and DAX literally 5 ms)

Image

A bit latter, I try it with Another again , first I got this error

Image

it was my fault, when a cluster is suspended, it will not wake up automatically when it receive Queries, you need to manually start it.

The PowerBI report is a simple Direct Query with some table, just to generate multiple SQL Queries

Initially it felt alright, but when I added another instance of the report, things start to feel slow, had a look at the service and SQL Pool has already started adding SQL Queries to the Queue !!!!

Take Away

The Good :

  • Integration with Azure Storage

The Bad :

  • 1.181 $/Hour is far from being cheap for an entry level tier specially that auto suspend does not Work.
  • Dedicated Pool is the only major DWH that does not separate Storage from compute, you can’t simply spin up a compute and Cross Query another dataset.

The Ugly :

  • Performance and concurrency seems particularly poor out of the box.

I am sure there are some optimization that can be done ; for example switch on result cache ( why it is not on by Default ?) maybe partition etc but I wanted just to give a first impression, and honestly color me unimpressed, Better Gen3 be Good.

Edit : got this feedback from Andy that DW100c is limited to 4 Concurrent Queries

Analyse Big Spatial Dataset using hex bin maps in PowerBI

Come across this blog post in Twitter and I thought this approach can be very useful in PowerBI to deal with Big GIS dataset.

The idea is simple, let’s say you have a big spatial dataset with million of coordinates, so instead of plotting all the individual points which is unfeasible for performance reason, you simply do this,

– First generate a grid for the area you want to analyse using something like QGIS.

– Then count how my point belong to every cell in the grid and color the results accordingly, you need a spatial Join for that, either using QGIS , SQL Server etc

– Drill down to individual points using WKT multi point

Publish to web here and pbix

Generate a Grid System

After a lot of googling as I did not even know what to look for, turn out QGIS can very easily generate a Grid, here is a good tutorial I found

and here is a results for Chicago area as I am using it as an example for this blog, Please notice, the grid should have less than 30K polygons which is the maximum number of rows that PowerBI can plot.

Spatial Join

I could have used QGIS to do the spatial join, but my data is from BigQuery public dataset (bigquery-public-data.chicago_crime.crime) and for convenience, it is easier to do the join there, the previous link show how to do the join in QGIS.

After loading the grid geometry to BigQuery, I am using this Query to join the two dataset, Grid and my current example, Crime data in Chicago

CREATE OR REPLACE TABLE
  XXXXXX.GIS.crime AS
WITH
  crime AS (
  SELECT
    fbi_code,
    ST_GEOGPOINT(longitude,
      latitude) AS geo,
    longitude,
    latitude
  FROM
    `bigquery-public-data.chicago_crime.crime`)
SELECT
  fbi_code,
  geo,polygon,
  longitude,
  latitude,
  ID
FROM
  crime
JOIN
  XXXX.GIS.Grid AS Grid
ON
  ST_INTERSECTS(geo,
    polygon)

The Query is checking every coordinates and looking up which polygons it belong to, so the Grid table is something like this

And the Query results is like this, we go the ID from the Grid Dataset, Any DB that support geometry can be used SQL Server, PostgreSQL etc

PowerBI

Let’s import those two table to PowerBI, the two tables are joined by the field ID

Luckily PowerBI support WKT format using Icon Map, show the grid with the count of number of coordinates is straightforward

Ok, it is great we have an aggregation of 4 Millions points and we can see the areas with the highest Number of recorded crime, you can filter by FBI code which classify the crime gravity (I have zero knowledge about this dataset, I just used as an example)

Drill Down to individual Cell

because we have the individual points, all I need to do is to generate Multi point geometry using DAX , that’s why I love Icon Map so flexible , The measure will simply detect if the cell ID is filtered or not and then switch between Polygons and Multi point

Geometry =
VAR polygon =
    MIN ( Grid_View[polygon] )
VAR concat =
    CONCATENATEX ( VALUES ( crime[geo] ), crime[geo], "," )
VAR Multi_point = "MULTIPOINT (" & concat & ")"
RETURN
    IF ( ISFILTERED ( dummy_id[id] ), Multi_point, polygon )

Notice Here, as a PowerBI Visual can not filter itseelf, I had to add a dummy dimension

and here is the final result

Take Away

PowerBI Icon map and QGIS is a very powerful combination, and the fact that DAX can generate a geometry on the fly is very interesting Pattern.