AI is Coming for Us

There are moments in life when you know things will never be the same. I remember distinctly when Gary showed me PowerPivot 10 years ago, and I knew that working with data would become as easy as playing with Excel. Another such moment was two days ago when I connected Claude Desktop to a database and asked, “What do you think?”

It was a strange experience. It wasn’t your typical “chat with your data and give me a nice chart” interaction. It was more like talking to a human and asking them to create a report. The LLM started by listing all the tables, examining the data, and making sense of what the dataset was about. Somehow, it figured out that the power generation figures were in MW and that to convert them to MWh, you need to divide by 12.

There’s a simple reason why this approach is so powerful compared to a typical chat with your data workflow: the LLM has read access to the data. It’s still secure and can only read what you’re authorized to access. As far as I know, these LLMs don’t auto-learn and don’t use the data for training, at least when you use an enterprise API.

Another interesting observation: as a non-programmer, I watched AI’s progress in coding with great excitement and never felt much sympathy for human coders. I thought they were exaggerating the threat. Somehow, my reaction changed when I noticed that AI will get very good at analytics too.

Note: I’ll refer to LLMs as AI for simplicity. Kurt has an excellent blog post worth reading, and thanks to Pawel for telling me about this whole MCP thing.

Typical “Chat with Your Data” Workflow

The important thing here is that AI doesn’t have access to your data at all. You collect the maximum knowledge about your data and send your questions with that knowledge. You get back SQL or DAX statements that you send to your server to get answers. if the question is not clear enough then they will ask for clarification, for example, what is the biggest country in the world, AI will reply, is it per size, by GDP etc, It’s much more complex in real life, but that’s the core idea.

Basically, we spend a lot of effort making sure AI can’t see your data. Sometimes, as a user, you wonder why this AI can’t answer some very obvious questions. Just imagine: as a data analyst, if someone asked you to give them a report without even seeing any numbers!

Using MCP

In this setup, the AI is unleashed. It can read the data directly (again, using only what you’re allowed to access and ideally read only), basically AI acts like an agent and has more autonomy, it is not limited only to your metadata.

Example Using Data from OneLake

I have this data in OneLake, and it’s cleansed data:

Because we don’t have an MCP server yet for Fabric DWH, I used the DuckDB MCP server to read the data from OneLake. For convenience, instead of using direct query, I imported the data into a local DuckDB file:

import duckdb

con = duckdb.connect()
con.sql("ATTACH 'aemo_delta.duckdb' AS db; USE db")

for tbl in ['duid', 'summary', 'calendar', 'mstdatetime']:
    con.sql(f"""
        CREATE OR REPLACE TABLE {tbl} AS 
        FROM delta_scan('abfss://serving@onelake.dfs.fabric.microsoft.com/datamart.Lakehouse/Tables/aemo/{tbl}')
    """)

con.close()

You need to install MCP and configure the connection with Claude Desktop. To be clear, it should work with any MCP client, but so far, that’s the best I could find. Who knows, maybe one day Power BI Desktop will act as an MCP client (I literally made up this idea; this is not a hint or anything).

Then you add this config to Claude Desktop:

{
  "mcpServers": {
    "mcp-server-motherduck": {
      "command": "uvx",
      "args": [
        "mcp-server-motherduck",
        "--db-path",
        "/tmp/llm/aemo_delta.duckdb"
      ]
    }
  }
}

For me, it feels like ODBC for AI. The protocol is getting adopted by everyone.

The Experience

Since the data is public, I shared the whole chat. What I really like is how AI approaches the problem, first by looking at the tables. This is very human-like behavior.

If you read the chat, you’ll see it’s not perfect. It casually skipped hydro from the renewable conversation and didn’t calculate MWh correctly, although it did yesterday.

Some Observations

  • Even for a simple use case, you still need a semantic model. If I had a measure MWh = MW/12, the AI would always use it, at least in theory. For a complex model, it’s even more critical, Having said that, AI can do modeling just fine 🙂 do we need human for that ?
  • surprisingly in that simple workflow, i can replace every compute , what’s really critical is storage !!!
  • All my data is publicly available, so I wasn’t worried about security. For any enterprise work, you can’t really use something like Claude Desktop, but rather solutions like Azure AI Foundry.
  • For now, most models don’t acquire new knowledge during serving, but who knows what will happen in the next 10 years? You can imagine an AI that learns just from interaction with users and data, which opens all kinds of new questions. Do you need specific models for every tenant, for every user ? We’re not there yet, it is something we will have to deal with it.
  • Never give MCP write access to anything

Does a Single-Node Python Notebook Scale?

I was giving a presentation about Microsoft Fabric Python notebooks and someone asked if they scale. The short answer is yes. You can download the notebook and try it for yourself. For the long answer, keep reading.

The dataset I used contains the last seven years of Australian electricity market data. Although it’s public, the government agency only keeps archives for two months. I had saved the data during a previous job and kept it around as a hobby. It’s a great real-world workload with realistic data distribution. The CSV files are messy. Technically, they’re more like reports, with different sections stacked on top of each other and varying numbers of columns. That’s often what you encounter in real projects, not the neat, well-structured datasets you see in demos.

For example, being able to read a CSV file with a variable number of columns is a critical feature. Yet this rarely gets mentioned in synthetic benchmarks.

To create a clean environment for testing, I copied the data from one Lakehouse in onelake to a brand-new workspace. I could have used a shortcut, but I wanted to start from scratch. The binary copy took just 2 minutes, with no transformations, which gives a throughput of 1.4 GB per second. That’s pretty good for a 150 GB uncompressed dataset.

The default configuration for Fabric Python notebooks includes 2 cores and 16 GB of RAM. That’s roughly the same size as Google Colab. But you can easily increase the number of cores to 4, 8, 16, 32, or even 64. At 64 cores, you get nearly half a terabyte of RAM. That’s a serious machine.

The job itself is simple. Ingest and process the data using several Python engines, then save the result as a Delta table. The raw data has around one billion records, and you end up extracting 311 million. If your engine cannot push down filters to the CSV level, you’re going to have a hard time. The trick here is not to be fast, but to avoid doing unnecessary work.

I used the following engines: DuckDB, Daft, Polars, CHDB (basically ClickHouse for Python), DataFusion, PyArrow, and Pandas. Technically, Pandas is not ideal here because you can’t pass a list of files without using a loop. But I had used it for nearly seven years, so I kept it for sentimental reasons.

I’m fairly confident using all of these engines except PyArrow and DataFusion. Their syntax is very intimidating, and I probably missed some configuration settings. I couldn’t get them to use more than a single thread, so CPU utilization stayed very low.

Results

  • Polars support streaming writes, but doesn’t allow exporting a record batch. This means the Delta writer has to load all data into memory. It works fine with 32 cores and 256 GB of RAM, but you’ll run into out-of-memory issues with 16 cores and below.
  • Chdb 3.5 added a user friendly way to export arrow record batch, it is the first release so still some bugs, for example got an error with 2 cores, I am sure it will get fixed soon
  • Daft is the only engine that supports native writing to Delta. It uses the Deltalake package only to commit the transaction log. The actual Parquet write is handled by the engine itself.
  • DuckDB preserves the sort order of the input files. it is trick to appeal to Pandas users who care about index ordering. For best performance though, you should turn this off. (Honestly, I think it should be off by default)
  • DuckDB exports Arrow tables by default. You need to explicitly use record_batch(). I’ve lost count of how many out-of-memory issues I’ve solved just by changing the export format.
  • Overall, DuckDB delivered the best performance, especially considering it’s not even writing Parquet files directly. It simply streams Arrow data to the writer.

When I first ran the test with DuckDB and saw it finish in under 4 minutes, I thought I made a mistake. It wasn’t until CHDB finished in under 5 minutes that I realized these engines are seriously impressive.

We’re talking about 625 MB per second for processing and ingestion on a single node.

Another key observation: using DuckDB and Daft, even with just 16 GB of RAM, the data was processed correctly. It took about an hour, but it worked without errors, that’s 10 X the size of the RAM

To verify correctness, I simply checked the total sum of a column and the number of records. Everything checked out.

Choosing the Right Size

Now that I know these notebooks work, choosing the right size becomes more nuanced. Surprisingly, the cheapest configuration in term of capacity usage was the 2 cores 🙂

In practice though, using more compute makes sense. A single node has no concept of fault tolerance. If something goes wrong, you need to restart the entire job. Personally, I’m not a fan of long-running jobs. Too many things can go wrong. I used 2 cores just to make a point. That said, using 64 cores doesn’t make much sense either. You’re doubling your compute cost to save 30 seconds.

One more thing: while Daft scales down very well, it doesn’t seem to scale up as efficiently as I had hoped. Ideally, you want a flat performance curve. The total amount of work is fixed, so adding more cores should just reduce execution time. I know the reality is more complex. It’s not easy to keep all processors busy at higher scales.

What This Means

As you may have guessed, I’m a big fan of single-node setups and DuckDB. But I don’t want just one engine to dominate every benchmark or deliver results that no other engine in its class can match. That’s why I was genuinely excited by Daft’s performance. I’m also looking forward to seeing Polars and CHDB add Arrow streaming support.

To be honest, I look at the world from a storage perspective. More competition between engines is a good thing. All of these tools are open source under the MIT license. Most of them can write to Delta in one form or another. and as a user you can choose any engine you want, I think that’s a fantastic thing to have.

So yes, Python notebooks do scale. The experience is far from being perfect, and there’s still room for improvement. But scalability is not something you should worry about, unless of course you are really doing real big data, then you go distributed 🙂 DWH and Spark are robust options in Fabric.

Edit : tested with chdb 3.5 which has support for arrow streaming

Some Observations on Running TPCH 1 TB on Microsoft Fabric

This is not an official Microsoft benchmark, just my personal experience.

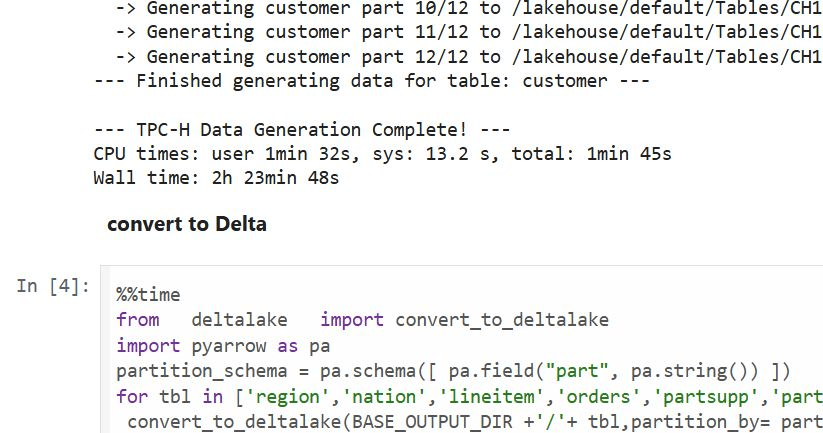
Last week, I came across a new TPCH generator written in Rust. Luckily, someone ported it to Python, which makes generating large datasets possible even with a small amount of RAM. For example, it took 2 hours and 30 minutes to generate a 1 TB scale dataset using the smallest Fabric Python notebook (2 cores and 16 GB of RAM).

Having the data handy, I tested Fabric DWH and SQL Endpoint. I also tested DuckDB as a sanity check. To be honest, I wasn’t sure what to expect.

I shared all the notebooks used and results here

I ran the test 30 times over three days, I think I have enough data to say something useful,In this blog, I will focus only on the results for the cold and warm runs, along with some observations.

For readers unfamiliar with Fabric, DWH and SQL Endpoint refer to the same distributed SQL engine. With DWH, you ingest data that is stored as a Delta table (which can be read by any Delta reader). With SQL Endpoint, you query external Delta tables written by Spark and other writers (this is called a Lakehouse table). Both use Delta tables.

Notes:

  • All the runs are using a Python notebook
  • to send queries to DWH/SQL Endpoint, all you need is
    conn = notebookutils.data.connect_to_artifact("data")
    conn.query("select 42")
  • I did not include the cost of ingestion for the DWH
  • The cost include compute and storage transaction and assume pay as you go rate of 0.18 $/Cu(hour)
  • For extracting Capacity usage, I used this excellent blog

Cold Run

  • The first-ever run on SQL Endpoint incurs an overhead, apparently the system build statistics. This overhead happened only once across all tests.
  • Point 2 is an outlier but an interesting one 🙂
  • The number of dots displayed is less than the number of tests runs as some tests perfectly match, which is a good sign that the system is predictable !!!
  • vorder improves performance for both SQL Endpoint and DuckDB. The data was generated by Rust and rewritten using Spark; it seems to be worth the effort.
  • Costs are roughly the same for DWH and SQL Endpoint when the Delta is optimized by vorder, but DWH is still faster.
  • DuckDB, running in a Python notebook with 64 cores, is the cheapest (but the slowest). Query 17 did not run , so that result is moot. ,Still, it’s a testament to the OneLake architecture: third-party engines can perform well without any additional Microsoft integration. Lakehouse for the win.

Warm Run

  • vorder is better than vanilla Parquet.
  • DWH is faster and a bit cheaper than SQL Endpoint.
  • DuckDB behavior is a bit surprising, was expecting better performance , considering the data is already loaded into RAM.

Impact on the Parquet Writer

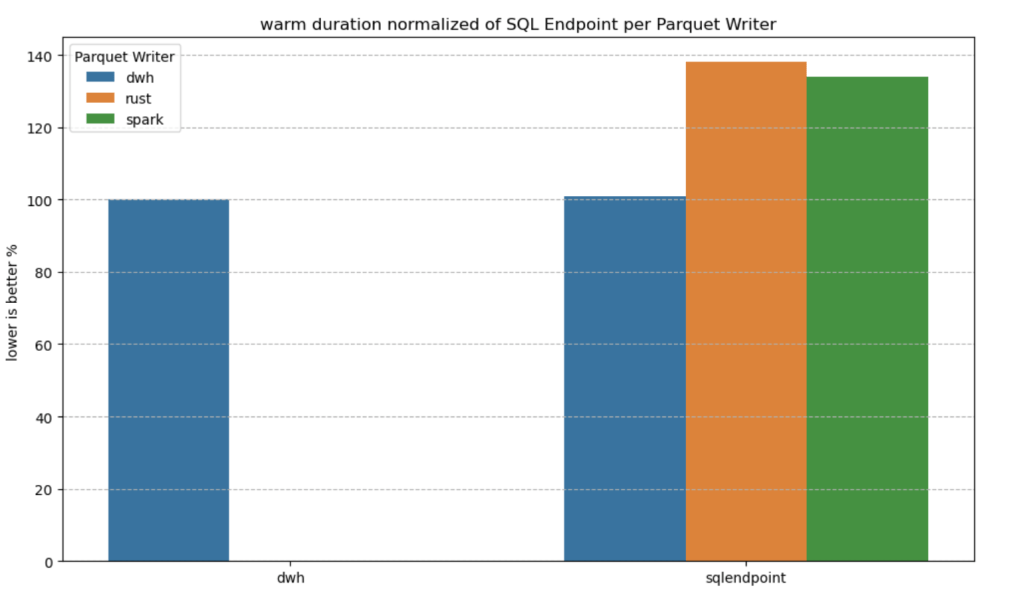
I added a chat showing the impact of using different writers on the read performance, I use only warm run to remove the impact of the first run ever as it does not happen in the DWH ( as the data was ingested)

  • given the same table layout, DWH and SQL Endpoint perform the same, it is expected as it is the same engine
  • surprisingly using the initial raw delta table vs spark optimize write gave more or less the same performance at least for this particular workload.

Final Thoughts

Running the test was a very enjoyable experience, and for me, that’s the most important thing. I particularly enjoyed using Python notebooks to interact with Fabric DWH. It makes a lot of sense to combine a client-server distributed system with a lightweight client that costs very little.

There are new features coming that will make the experience working with DWH even more streamlined.

Edit :

  • update the figures for Dcukdb as Query 17 runs but you need to limit the memory manually set memory_limit='500GB'
  • added a graph on the impact of the parquet layout.

Optimizing Fabric Capacity Consumption: A Practical Approach

If you’re utilizing Microsoft Fabric and notice consistently high usage—perhaps averaging 90%—or experience occasional throttling, it’s a clear indication that you’re nearing your capacity limit. This situation could pose challenges as you scale your workload. To address this, you have three primary options to consider:

  1. Upgrade to a Higher SKU
    Increasing your capacity by upgrading to a higher SKU is a straightforward solution, though it comes with additional costs. This option ensures your infrastructure can handle increased demand without requiring immediate changes to your workflows.
  2. Optimize Your Workflows
    Workflow optimization can reduce capacity consumption, though it’s not always a simple task. Achieving meaningful improvements often demands a higher level of expertise than merely maintaining functional operations. This approach requires a detailed analysis of your processes to identify inefficiencies and implement refinements.
  3. Reduce Data Refresh Frequency
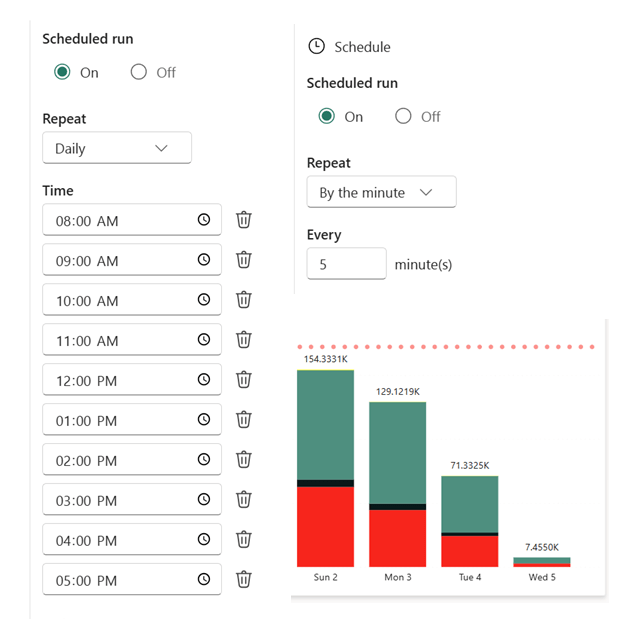
    A practical and often overlooked option is to adjust the freshness of your data. Review the workflows consuming the most capacity and assess whether the current refresh rate is truly necessary. For instance, if a process runs continuously or frequently throughout the day, consider scheduling it to operate within a specific window—say, from 9 AM to 5 PM—or at reduced intervals. As an example, I adjusted a Python notebook that previously refreshed every 5 minutes to run hourly, limiting it to 10 executions per day. The results demonstrated a significant reduction in capacity usage without compromising core business needs.

8000 CU(s) total usage for a whole solution is just a bargain !!! Python Notebook and Onelake are just too good !!!  the red bar is the limit of F2

Choosing the Right Path

If your organization has a genuine requirement for frequent data refreshes, reducing freshness may not suffice. In such cases, you’ll need to weigh the benefits of optimization against the simplicity of upgrading your SKU.