Build a Dashboard using Data Studio

Google Data Studio is a new reporting service from google, it is still in beta, has rudimentary capabilities compared to established players ( PowerBI, Tableau and Qlik) and can be very slow, yet it has two killer features, it is free, with amazing sharing options.

Google business model for this product is very simple, the visualisation layer is free, but the preferred data source is BigQuery which is a paid product, but other source usage are free.

In the last two months, I have been experimenting with the product, I never managed to make it produces any meaningful charts, that was my mistake as I was thinking from a semantic model background, which is not valid here.

Data studio do not support multiple datasets, you can use multiple datasets in the same reports but not in the same chart, but you can filter multiple datasets using a common dimension, when solution is to create a master datasets that combine all the tables, if is the same concatenate table used in Qlik.

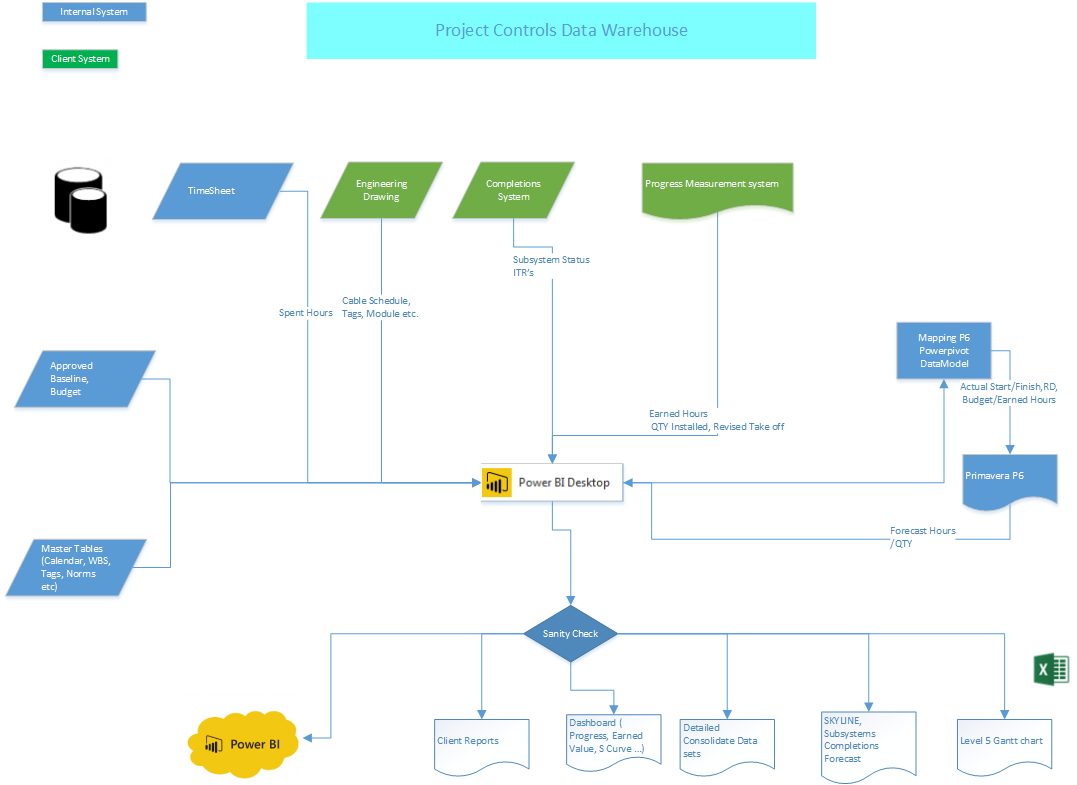
Now if you have a data workhouse you could simply write an SQL query to combined all the dimensions you want to report on, I don’t, so I will use what I have PowerBI desktop !! You can use R studio too, or any data management solution you are familiar with.

So the approach is build a data model in PowerBI desktop,  Query the model using Dax and export the result to CSV,  then load the CSV to Data Studio and share the report, Data Studio is only used as reporting service.

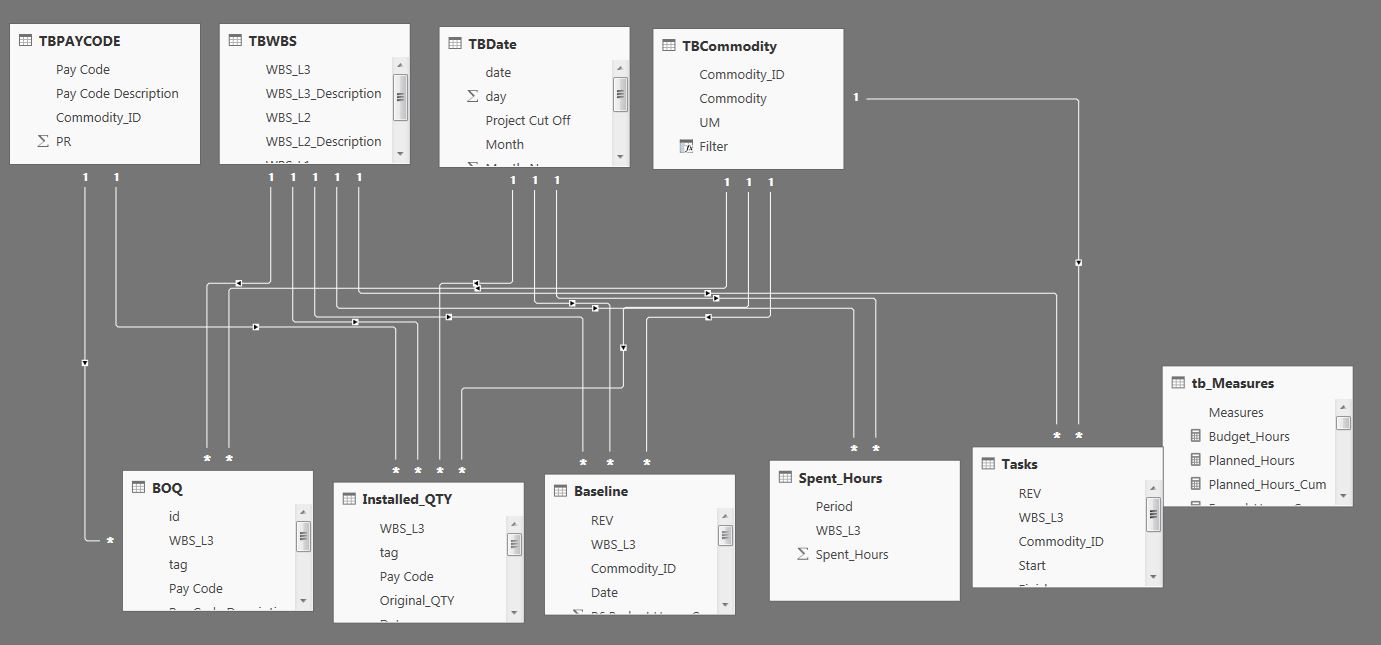
1- I will use this datamodel.

Data_Studio_1

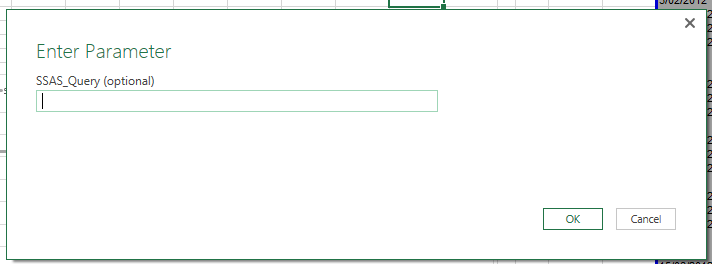
2- And use this query to extract the dimensions and measures I want to report on


EVALUATE
VAR Earned_Table =
FILTER (
ADDCOLUMNS (
SUMMARIZECOLUMNS (
TBPAYCODE[Commodity_ID],
TBCommodity[Commodity],
TBWBS[WBS_L3],
TBDate[Project Cut Off],
"Budget", tb_Measures[budget_hours],
"Period", tb_Measures[Earned_Hours_Period],
"Cumulative", tb_Measures[Earned_Hours_Cumulative]
),
"TYPE", "Earned"
),
MIN ( TBDate[date] ) <= [Cut off] && MIN ( TBDate[date] ) >= DATE ( 2012, 1, 1 )
)
VAR Plan_Table =
FILTER (
ADDCOLUMNS (
SUMMARIZECOLUMNS (
TBPAYCODE[Commodity_ID],
TBCommodity[Commodity],
TBWBS[WBS_L3],
TBDate[Project Cut Off],
"Budget Hours", tb_Measures[budget_hours],
"Planned Hours", tb_Measures[planned_Hours],
"planned Hours Cumulative", tb_Measures[planned_Hours_Cum]
),
"TYPE", "Planned"
),
MIN ( TBDate[date] ) >= DATE ( 2012, 1, 1 )
)
VAR Spent_Table =
SELECTCOLUMNS (
FILTER (
SUMMARIZECOLUMNS (
//TBPAYCODE[Commodity_ID],
//TBCommodity[Commodity],
TBWBS[WBS_L3],
TBDate[Project Cut Off],
"Budget", tb_Measures[budget_hours],
"Period", tb_Measures[spent_Hours_Period],
"Cumulative", tb_Measures[spent_Hours_Cum]
),
MIN ( TBDate[date] ) <= [Cut off] && MIN ( TBDate[date] ) >= DATE ( 2012, 1, 1 )
),
"Commodity_ID", BLANK (),
"Commodity", BLANK (),
"wbs_l3", [WBS_L3],
"TBDate", [Project Cut Off],
"Budget Hours", [budget_hours],
"Planned Hours", [planned_Hours],
"planned Hours Cumulative", [planned_Hours_Cum],
"Table", "Spent"
)
RETURN
ADDCOLUMNS (
UNION ( Earned_Table, plan_table, spent_table ),
"Data_Date", IF ( [Project Cut Off] = [Cut off], 1, 0 )
)

Basically I am using union to concatenate the values for Earned Hours, Planned Hours and spent Hours, I added a column type to distinguish between the different tables and in the case of spent, I assign the value blank for Commodity_ID and Commodity as the measures don’t have the same granularity.

I added a column ‘Data_Date” so I can filter only the dates where it is equal to the cut off.

3-Load the CSV

Data_Studio_2

If a field aggregation is none, then it is a dimension, otherwise it is a metric (measure), now, there are some functions to do calculations like sum, average but it is not DAX, it is really limited.

As an example for the measure Planned Hours = SUM(CASE WHEN REGEXP_MATCH(TYPE, ‘^Planned.*’) THEN Period ELSE 0 END)

4-build the report

Data_Studio_3

You can view the report here , and the datasets here , (sorry does not support internet Explorer, Only Chrome, Firefox, and Safari,  Internet Explorer works now, although not officially supported)

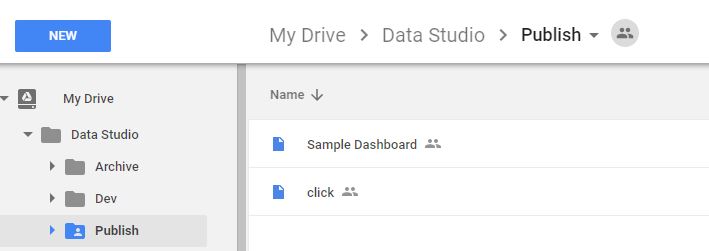
Personally the most interesting aspect of Data Studio is the integration with Google Drive, the reports you build will show in your Google drive and you can organize them in different folders, for example then you can group reports by departments, shop etc

Data_Studio_4

I think it has potential, they got the sharing right, now they need to add some basic features ( pivot table, controlled cache ….) , and more options in the calculated field formula, ( hint return null for example is not supported,  ok there is a workaround, Just create Metric*Metric/Metric, if it is 0 then it is an error, GDS return null in this case) and you will have data visualisation for the masses.

Integrated Project Control system using PowerBI

One of the most popular discussion in planning forum is how to have an integrated project control system, every practitioner has a different opinion how it must be done, and of course you get a lot of marketing from people trying to sells their systems

In this blog, we share high level description of a data warehouse built using PowerBI desktop.

Data warehouse are not widespread in the construction industry, because the reporting specifications are different from project to project, and every client has a different systems and tools, and trying to have a standard system works only if you are the main contractor but if you are a subcontractor you have to adopt the client system.

Another reason is; it required a specialised IT skills, we are just business users not programmers, we do understand data very well, but not necessarily having the skills and tools to manage it, The good news is, with the rise of self-service Business intelligence, we have exactly that, Powerful data management tools yet accessible (assuming you want to learn something else than Excel).

So at high level this is how it works.

 Project Controls Data Warehouse

  • The Data warehouse was built using PowerBI desktop, I know it should be called sematic model, (for me data model, data warehouse are fundamentally the same thing), initially it was using Excel PowerPivot but it did not scale well with the increase of the volume of data.
  • As the data is not always in the format we want, PowerQuery is very handy in this case, as virtually it can transform any source of data, example lookup the subsystem using the tag field, trying to do that if you have 8 Million rows using Excel or Access is not feasible.
  • We maintain Master tables to integrate all the different source of data (tags, WBS, subsystems etc)
  • Every week, we get new Export from the source systems (Cobra, proprietary database systems etc), we load the new data and keep the historical records, it took 15 minute to refresh, which is quite impressive, Cobra alone is a folder 60 Excel file, and nearly 2 Giga in size.
  • Usually you publish your reports into PowerBI.com service to end users once your refresh your data model, in our case we can’t use the cloud for privacy reason, instead we use Excel as a reporting tool that pull the data from PowerBI desktop, the advantage of this approach is that we have different reports for different users, Skyline, Gantt chart, Client reports (in their required format), management reports etc.

Some thoughts.

  • As you can see Primavera P6 is used only as a forecasting tool and to calculate the critical path, the earned value calculation is done in the data model, personally I think P6 should not be used as the centre of your project control system, I remember the first time I start learning Primavera P3 ( a long time ago:), we kept asking the trainer how it is possible to track the spent hours at the activity level, the answer is we don’t, actually deciding at which level you track you spent hours it is the most important decision to make when you start a new project.
  • the basic idea here is in order to have an integrated project controls system is stop trying to have one, data will be always in silo, don’t try to change other department how they manage their specific data, it will not work and they will not listen to you anyway, So instead of trying to have one system to rule them all, just use the existing systems and build a data warehouse for reporting and Integration with P6.

How to use Excel as a Front End to Power BI Desktop

You can download the data model, the excel frond ends and the data sets in this folder.

The techniques used in the spreadsheet for connecting to PowerBI Desktop are not officially supported by Microsoft,  ( as of  24 may 2018, Microsoft don’t mind people using this approach ) but I think are useful to understand how the MS BI stack works, especially if you are coming from an Excel Background, and Installing SQL server developer is either intimidating or not allowed.

I really appreciate if you vote for this idea to make this scenario offically supported by Microsoft

As far I am aware there are two approach to access PowerBI desktop, or more correctly the SSAS instance launched by Power BI Desktop.

  • Connecting using a live connection, detailed here
  • Connecting using PowerQuery, detailed here


The live connection is very interesting but it has the drawback that if you close PowerBI Desktop the pivot table stop working, so you can not share the spreadsheet, one solution is to use cube formula as they are persistent, if you don’t use know what a cube formula is then you are missing of the most powerful feature of Excel.

But what if you want to have a pivot chart, or a pivot table that you can keep using even if you lose the connection, or if you want to share the results with people that have not access to the data model,  turn out it is possible, welcome to Excel Pivot cache


  • Invoke the function SSAS_QUERY
  • 1
  • The Parameter is optional:
    • Either you write a DAX Query to retrieve the fields you want, MDX is supported too, personally I find MDX more suitable to import measures with different dimensions, I understand that DAX support this scenario too using crossjoin but I never manage to make it works correctly.
    • or Just click ok, than you can browse the SSAS cube, you can select any dimensions and measures you want, but mind that for a big cube, a query fetch the result faster.
  • Keep Powerquery as a connection only.
  • Insert a pivot table, use an external data source, choose connection, select the Powerquery Query, and voila

2


Excel cache the data in the Pivot, not only that it is extremely compressed.

Notice here PowerPivot is not used at all, Excel is acting as visualisation layer to PowerBI Desktop, leveraging two well known capabilities cube formula and Pivot cache.

Microsoft plan to release SQL server v.next this year, and then we can deploy the data model built with Power BI /Powerpivot /Powerquery into a production system, that’s what I call a natural growing path from self service to corporate BI.

Edit Dec-17 : i add a new file that use only VBA, so Powerquery is not required, it can be useful if you are still on Excel 2007, or you can’t install Powerquery.


Thin and Core workbook without Sharepoint or SSAS

edit : 1/1/2017, another option is described here, the thin workbook connect directly to Power BI desktop, very handy if: your client are still on Excel 2010, or you don’t want to share the data in the data model but just the results.


The concept of thin and core workbook was familiarized by the guys at PowerPivotPro, but they assume, either you have SharePoint installed or a connection to the cloud.

Let’s assume the only resource you have are:

  • Your PC.
  • A local server used for shared folders.

Backend and Front End approach

if you have small data sets then load everything to PowerPivot and do the reports in the same workbook, but if you are dealing with a lot of data sets, and you need to provide tailored reports to different people, typical example your client wants a particular format, the PM want a different format, the construction manager wants something different altogether, we all know what the commissioning guy wants 🙂

Then a sensible approach is to separate the data model from the reports itself, the backend will be used to store the data and a front end to report and visual the data.

Front End:

Excel: natural choice for many obvious reasons.

Tableau: has a killer feature in this scenario.

Backend:

There are many options, depending on the size and the complexity of your data.

1-MS Access:  is a solid option, but if you have tables that have more than 500 000 rows, then perhaps that’s not really a good solution, I know it depends on filed type, number of columns etc., the other issue there is no ETL for MS Access.

2- MS SQL SERVER EXPRESS: it is a free and a kick ass Database server, probably it will load all your data, but if your data is not well structured then it became a pain to load it, there is no free ETL for SQL express, and Powerquery does not natively load to SQL, you can vote for this idea here .

3- PowerBI Desktop: load the data in PowerBI Desktop and access the data from Excel using this hack. It is highly experimental but very promising, it is potentially a game changer.  You can vote here if you want Microsoft to officially support it.

4-PowerPivot: it is already there with Excel, Powerquery can literally load any data you have, it can clean transform with a simple click, and it is free, and don’t forget PowerPivot is a simple SSAS instance embedded in Excel, ok there is a problem 😦

We cannot access PowerPivot Model from another Excel workbook.

PowerPivot data can only be consumed from the same workbook :), I don’t know the reason but definitely it is not technical, all we can do is just to vote and hope Microsoft will listen

But fortunately there are some workaround.

1- Tableau: tableau can read data from a PowerPivot data model, and it has some very amazing visualisation, (not free)

2- PowerUpdate: Powerupdate can load the data directly from the PowerPivot Model to an SQL Server, and bonus point, it can refresh any workbook automatically no need for manual refresh (not free)

3- Reverse Linked Table: instead of using pivot table to read the data from the Pivot tables, we just used tables to get the same result, the Italians provided a detailed explanation here, and to avoid Excel limitation of 1 Million record, you can split the result in new tabs, you can even create summarized data that feed your different report, the only inconvenient here, the size of the workbook will increase with a lot of data.

Conclusion 

a simple option to deals with a lot of data is to load all the data source in one Master workbook, then write back the result in the same workbook using Reverse Linked Tables.

Now you can use that Master workbook as your backend for all your reports.

or use PowerBI Desktop as your backend, officially it is not support but Excel can perfectly connect to a local instance of  PowerBI desktop.