Digital Strategy for project controls is a tricky beast. We are bombarded by systems that all promise nirvana (and many can deliver nirvana for some projects). However, at the core, before we even discuss systems, we need to understand what our strategy is, and what key concepts we want to push. Below are some ideals of mine. With everything, this is a straw-man discussion. Every project will have its own culture, its own focus, its own needs. Your strategic approach has to cater to what you want from your project. Not to mention that the major companies all have quite rigorous project control plans and detailed procedures. These are great documents that do spell out our scope of services.
Project Controls is the heart of every major construction project. Our teams are the ones that typically wade through information that never stops and constantly changes. Although at the core, the fundamentals of our strategy are likely the same as what everyone who manages data will encounter.
The issues are not related to our knowledge of project controls (and project management) fundamentals. We know how to build schedule, track progress, build baselines, budgets, and track costs parsed into 1000s of potentials contracts and POs. We know how to calculate and track Earned Value, CPI, and SPI. We know change management, trends, change orders, etc. We know how to compile all the information into weekly and monthly reporting. We have the procedures and management plans.
We are the technical experts of our discipline.
However, too often, we are not able to step back and understand that the way in which we work can change, needs to change – and more importantly – the technology that is available now can be utilized to seriously disrupt the way in which we apply our technical knowledge and skills.
Below are some ideas, some concepts we can consider in everything we do to perhaps bring a more digital and smart way of operating in the new world we live in. These are not innovative in themselves, we live with these ideas already. My intent is to try to capture these ideas and through the tactical implementation of these ideas bring real innovation.
Strategy – Strategy is not Keywords
Too often, we write our strategy or integration documents and load them up with keywords and slick powerpoint. We have to embrace that we touch real things. Don’t use stick figures and cartoons – use real live examples, get your hands dirty using the systems on your job. Understand the details. Stop writing keywords on a white board and open the application!
The real idea is to be grounded in practical things, not abstract processes.
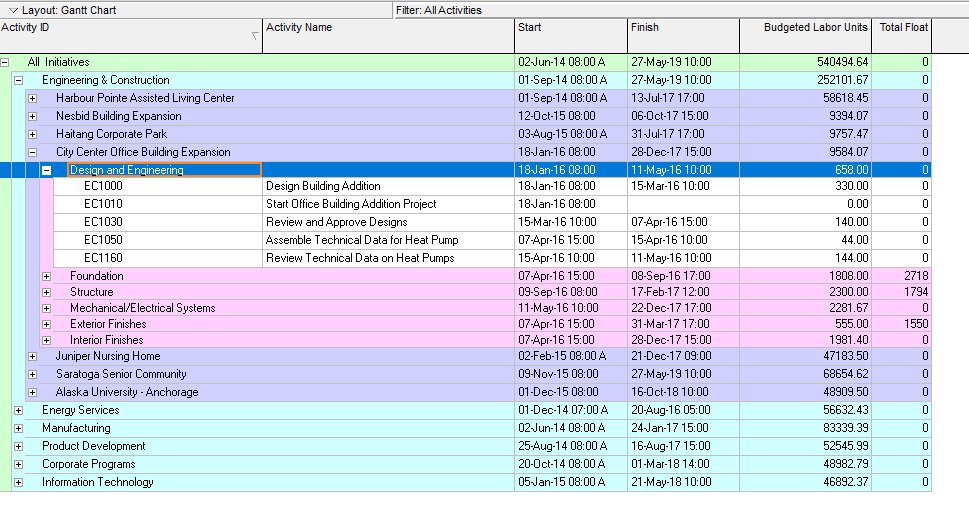
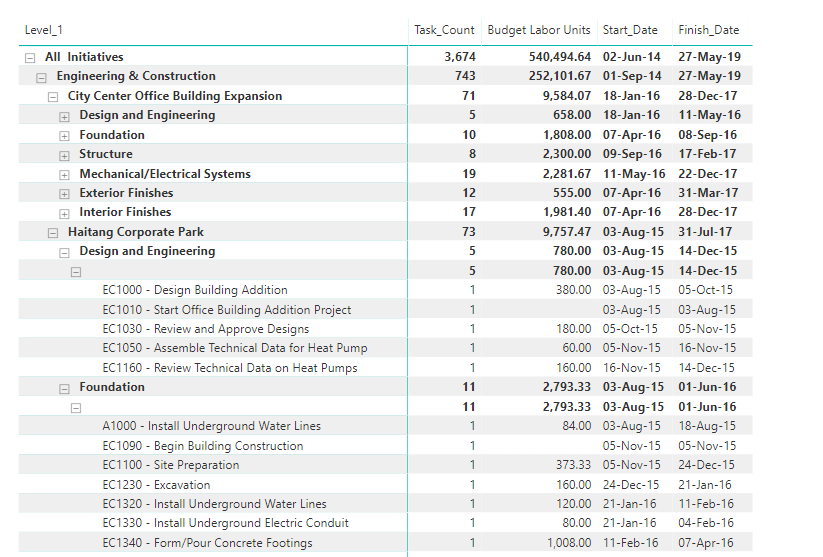
Open your schedule, look at the activity definition that exists. Open your material management system and see if the items can be tagged with schedule activities. Look into your progress measurement sheets and determine if you can insert scheduleID to smartly update the progress in your schedule (sound like a broken record!).
Strategy – Enter data once
This is talked about by everyone, although, we have all seen it – everyone has their own spreadsheet. Every group has their own systems: SAP, Contracts, Procurement, Engineering, Cost Control, Planning: I have illustrated in the past the issue with something as standard as “where is the master contract list”. Do we really have a strategy to enter data once? If so, really delve into the data people keep on their computers in their own spreadsheets. Try as best as we can to pull key reference data out of a source system
There exist systems that can facilitate this approach and allow for integration. Although be careful and understand that integration is not strategy. The implementations of strategy will likely require integration.
Data Integration vs Digital Strategy
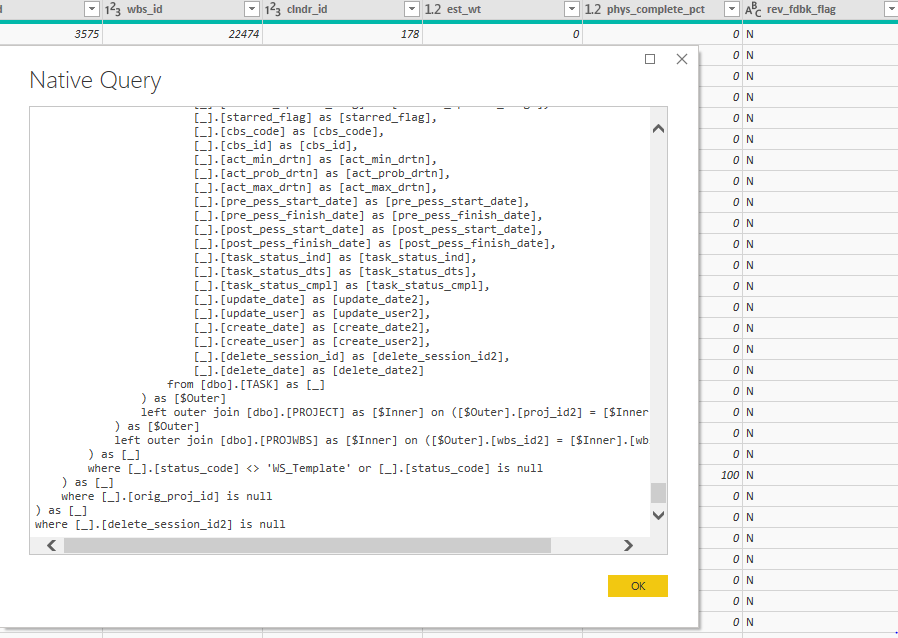
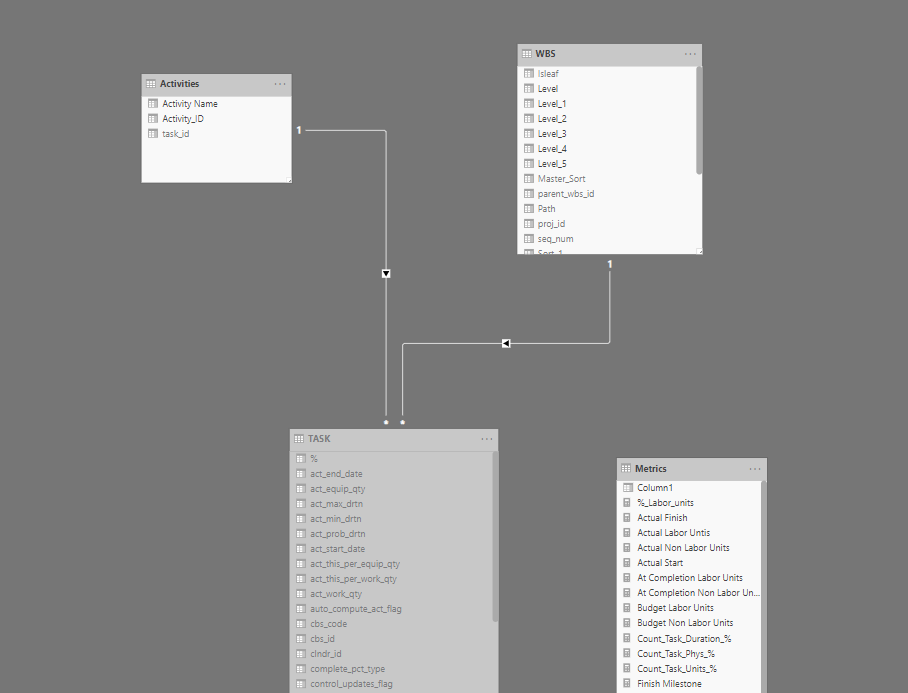
Enter data once is integrated into the concept of data integration. Integration is not specifically the idea that “systems talk to each other”, integration is the ability to just smartly manage your job. Unless common keys exist between systems, you can’t hope to build that integration inside a black box your digital team will build.
A good example of this is the implementation of a web based cash flow
Web Based Cashflows – Sharepoint
Strategy – Be Visual
Project Controls teams are the masters of reporting. Being visual is not about (only) creating dashboards or complex databases the feed our dashboards. Being visual is doing exactly what we already do. Stay away from data tables – Long Live Death by S-Curves!
The tabular data presentation methods we use are antiquated. Looking at an engineering progress report with 50 rows and 20 columns of various EV metrics – too often that doesn’t answer me the question of whether or not I am on plan or not. That is what I meant to be visual. Look at the questions be want answers for, the core underlying questions and FOCUS. If the question is infact “I was to see the productivity factor for 50 different areas both weekly and cum”. Perhaps choose a dot-plot. Place the values all on a graph, perhaps scale the size of the dot on the budget hours, use a horizontal axis for % and the vertical axis to show the PF. That is what I mean to “Be Visual”.

Strategy – Push processes and data ownership to the person actually responsible, not the “function” that is responsible
Payment certificates, progress measurement reports, monthly reports: the list is never ending. We have data that originates with contractors and a multitude of sources. However, too often, the sources of information do not have access to the real database or word/excel file used by the project. If possible, structure your data sources such that owner can manage their data.
I will likely post a few case studies about this to get people thinking of possibilities.
Strategy – Use Agile management
- Focus on Output not Documentation
- Respond to Change as opposed to fixation on Original Plan
- Focus on interactions between people, not underlying systems or tools
These topics can be very disruptive: Tell a company like Fluor or Bechtel to NOT focus on plans or procedures? Good luck. However, this is a disruptive day and age and we do need to take this approach. I have worked in this business for over 20 years and honestly, in general, project controls already (generally) follows these agile fundamentals. We have plans and systems and reams of documentation, but in the end, we do (informally) have to follow these simple strategic cultural elements
What is needed here is the firm support from the management team that a proactive view of the
“what is going to happen tomorrow”
is way more valuable that the concept of
“what was planned to happen tomorrow”
The concept that
“I need this new report now”
is more relevant than
“This is the report that is defined in the PPM”
AGILE management is not able sprints or standups. Its a culture to embrace a stance that while we have general goals and objectives, the focus needs to be on what are we doing today. The reason to have daily stand ups is to have clarity on what we are doing today. The reason to have sprints is to outline near term goals. The reason we have restrospectives is to analyze the difference between what we thought we were going to do, and what we did (and more importantly how to improve the next period). This is just good project management 101! The fact someone calls it AGILE, is not relevant.
Strategy – Allow users to LINK to key fundamental data
This is aligned with “enter data once”. But, this is a core strategic ideal that needs to be championed. We will have data housed in source systems, but have we enabled the wider project team to access this information. That is the primary idea here.
Is information shared by way of excel exports that are distributed via email to various people at various times? Or, do we have a project where information is open and accessible. The latter is what our strategic approach to everything should be.
Strategy – Facilitate live real time data
Ultimately you will need some sort of approach to cadence and integration. Will we be using real time data, will we instead focus on cutoffs.
This can if we really delve deeper into what this really means, be very disruptive. With real time data, the need for monthly reporting is useless, the need for weekly reporting – is useless. Reporting is a natural output 24/7 from the way we operate. This cultural approach to construction management is where I think we need to go to be hyper reactive to change.
Strategy – Be Hyper Reactive
As I mention above, we want to have a core ideal that allows us to change course immediately when required. We have submitted the same schedule and cost reports every month – WHY? Do not be afraid to change things up, support a workplace where the team can be hyper reactive to respond to everything.
For schedule management, this requires the approach to insert activities into the schedule with daily vigor to reflect what is happening today.
For cost management this requires detailed ticket management approach to our tasks to allow visibility into everything we do 24/7
Conclusion – Do not be afraid to push boundaries
This list above is again just a beginning of a discussion. These are discussion topics that are occurring in every company around the world.
As we head into the future, we have an entire generation of new employees who are not afraid of technology. Quite the contrary, the newer generations of people will feel more comfortable updating a web form vs updating a word file. They will feel more comfortable posting progress updates to a social media site vs writing a daily report. They will be more comfortable making mistakes, and fixing them.
The dashboard craze is here to stay. The use of dashboards and the approach needed to create PowerBI or other application based analytics tick many of the strategic elements I have outlined here.
In the end – do not be afraid to push boundaries with your approach to construction management.