This is not an official Microsoft benchmark, just my personal experience.
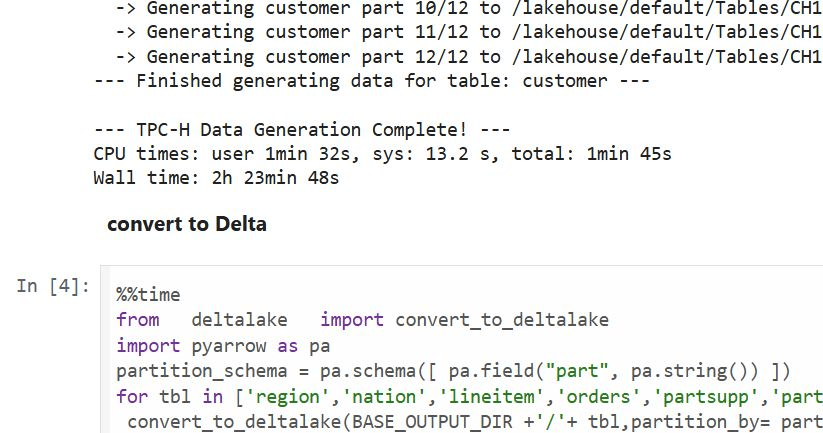
Last week, I came across a new TPCH generator written in Rust. Luckily, someone ported it to Python, which makes generating large datasets possible even with a small amount of RAM. For example, it took 2 hours and 30 minutes to generate a 1 TB scale dataset using the smallest Fabric Python notebook (2 cores and 16 GB of RAM).
Having the data handy, I tested Fabric DWH and SQL Endpoint. I also tested DuckDB as a sanity check. To be honest, I wasn’t sure what to expect.
I ran the test 30 times over three days, I think I have enough data to say something useful,In this blog, I will focus only on the results for the cold and warm runs, along with some observations.
For readers unfamiliar with Fabric, DWH and SQL Endpoint refer to the same distributed SQL engine. With DWH, you ingest data that is stored as a Delta table (which can be read by any Delta reader). With SQL Endpoint, you query external Delta tables written by Spark and other writers (this is called a Lakehouse table). Both use Delta tables.
Notes:
All the runs are using a Python notebook
to send queries to DWH/SQL Endpoint, all you need is conn = notebookutils.data.connect_to_artifact("data") conn.query("select 42")
I did not include the cost of ingestion for the DWH
The cost include compute and storage transaction and assume pay as you go rate of 0.18 $/Cu(hour)
For extracting Capacity usage, I used this excellent blog
Cold Run
The first-ever run on SQL Endpoint incurs an overhead, apparently the system build statistics. This overhead happened only once across all tests.
Point 2 is an outlier but an interesting one 🙂
The number of dots displayed is less than the number of tests runs as some tests perfectly match, which is a good sign that the system is predictable !!!
vorderimproves performance for both SQL Endpoint and DuckDB. The data was generated by Rust and rewritten using Spark; it seems to be worth the effort.
Costs are roughly the same for DWH and SQL Endpoint when the Delta is optimized by vorder, but DWH is still faster.
DuckDB, running in a Python notebook with 64 cores, is the cheapest (but the slowest). Query 17 did not run , so that result is moot. ,Still, it’s a testament to the OneLake architecture: third-party engines can perform well without any additional Microsoft integration. Lakehouse for the win.
Warm Run
vorder is better than vanilla Parquet.
DWH is faster and a bit cheaper than SQL Endpoint.
DuckDB behavior is a bit surprising, was expecting better performance , considering the data is already loaded into RAM.
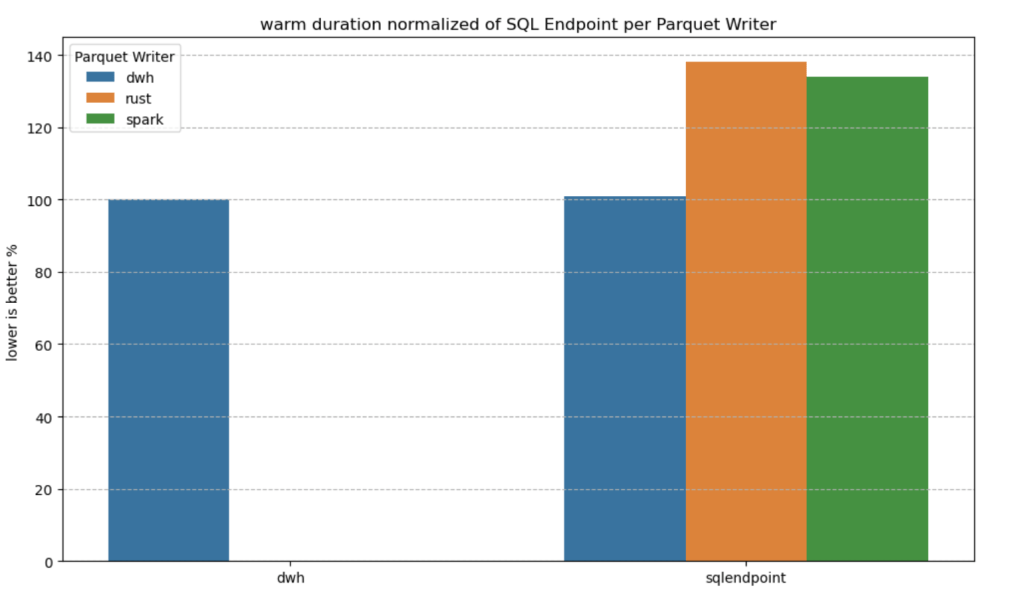
Impact on the Parquet Writer
I added a chat showing the impact of using different writers on the read performance, I use only warm run to remove the impact of the first run ever as it does not happen in the DWH ( as the data was ingested)
given the same table layout, DWH and SQL Endpoint perform the same, it is expected as it is the same engine
surprisingly using the initial raw delta table vs spark optimize write gave more or less the same performance at least for this particular workload.
Final Thoughts
Running the test was a very enjoyable experience, and for me, that’s the most important thing. I particularly enjoyed using Python notebooks to interact with Fabric DWH. It makes a lot of sense to combine a client-server distributed system with a lightweight client that costs very little.
There are new features coming that will make the experience working with DWH even more streamlined.
Edit :
update the figures for Dcukdb as Query 17 runs but you need to limit the memory manually set memory_limit='500GB'
added a graph on the impact of the parquet layout.
(Disclaimer : I use BigQuery for a personal project and it is virtually free for smaller workload, at work we use SQL Server as a Data Store, I will try my best to be objective )
TL:DR ;
Run TPCH-SF100 benchmark (base table 600 million rows) to understand how different Engine Behave in this workload using just the lowest tier offering, you can download the results here
Introduction
Was playing with Snowflake free trial ( maybe for the fifth time) and for no apparent reason, I just run Queries on TPCH-S100 Dataset, usually I am interested in smaller dataset, but I thought how Snowflake may behave with bigger data using the smallest cluster, long story short, I got 102 second, posted it in Linkedin and a common reaction was Snowflake is somehow cheating.
Obviously I did not buy the cheating explanation , as it is too risky and Databricks will make it international news.
Load the Data Again
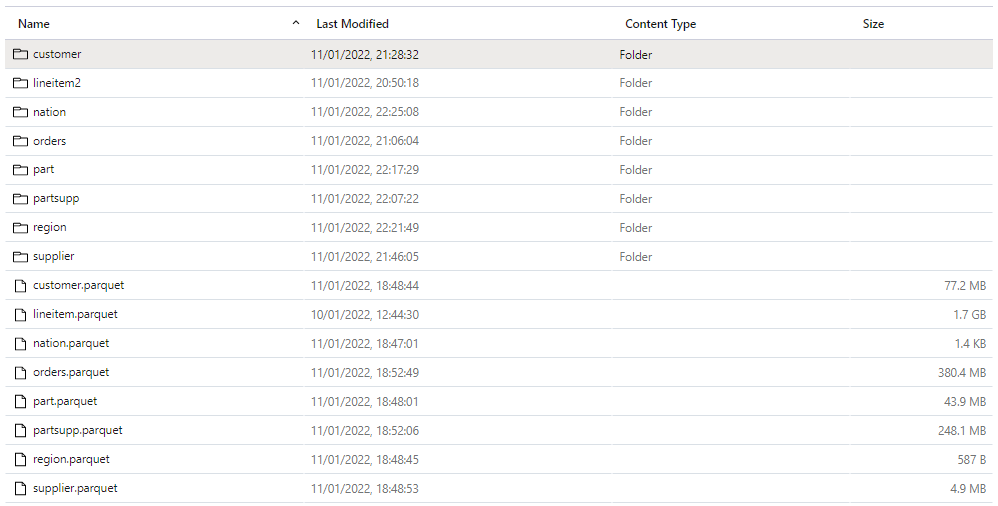
Ideally I would have generated the Data myself and load it into Snowflake, generating 600 Million records in my laptop is not trivial, my tool of choice, DuckDB has an utility for that but it is currently single threaded, instead
I exported the data from Snowflake to Azure Storage as parquet files
Download it to my Laptop, generate new files using DuckDB as in Snowflake you can’t control the minimum size of files, you can control the max but not the Min
Snowflake Parquet External Table
My Plan was to run Queries directly on Parquet hosted on azure storage, the experience was not great at all, Snowflake got Query 5 join order wrong
Snowflake Internal Table
I loaded the parquet files generated by duckdb, Snowflake getting extremely good results. what I learnt, whatever Snowflake magic is doing, it is related to their proprietary file format.
BigQuery External Table
I have no frame of reference for this kind of workload, so I loaded the the data to BigQuery using external table in Google Cloud, Google got 5 minutes, one Run, 2.5 $ !!!!
BigQuery Internal Table
Loaded Data to BigQuery internal format, notice, BigQuery don’t charge for this operation , 2 Minutes 16 second, 1 Cold Run.
BigQuery Standard Edition
BigQuery added new pricing model where you pay by second, after the first minutes, I used the Standard Edition with a small size, I run the same query two time, unfortunately the new distributed disk cache don’t seems to be working, same result 5 minutes, that’s was disappointing
Redshift Serverless
Imported the same Parquet files into Redshift serverless, The schema was defined without Distribution keys, The results are for 3 Runs, the first run was a bit slower as it is fetching the data from the managed storage to the compute SSD the other 2 runs are substantially faster, I thought it is fair to have an average, Using the lowest Tier 8 RPU (2.88 $/Hour)
Redshift Serverless hot run was maybe the fastest performance I have seen so far, but they need still to improve on their cold Run.
I was surprised by the system overall performance, from my reading, it seems AWS basically rewrite the whole thing including separating compute from storage, Overall I think it is a good DWH.
Trino
Trino did not run Query 15, had to run a modified syntax but same results, 1 Run from Cold Storage, I am using the excellent service from Starburst Data
Synapse Serverless
Honestly, I was quite surprised by the performance of synapse serverless, initially I tested with the smaller file size generated by Snowflake and it did work, the first run failed but the second works just fine, I did like it, it did failed quickly, notice that Synapse run statistics on parquet files, so you would expect a more stable performance, not the fastest, but rather resilient.
Anyway , it took from 8-11 minutes, to be clear that’s not Synapse from two years ago.
Not related to the benchmark but I did enjoyed the lake database experience
Databricks External Table
I had not a great experience with Databricks, I could not simply pass authentication to Databricks SQL, you need a service principal and registering an App, and the documentation keep talking about Unity, which is not installed by default, This is a new install why Unity is not embedded if it is such a big deal ?
Anyway, First I created an external Table in databricks using the excellent passthrough technique in the Single Node Cluster, Databricks got 12 minutes,
Databricks Delta table
let’s try again with Delta, I created a new managed table, run optimize and analyse , (I always thought delta has already the stats), but it didn’t seems to make a big difference, still around 11 minutes, and this running from the disk, so no network bottleneck
DuckDB
My Plan was to run DuckDB on Azure ML, but I need a bigger VM than the one provided by default, I could not find a way to increase my Quota , I know it sounds silly, and I am just relating my experience, turn out Azure ML VM Quota is different from Azure VM, it did drive me crazy why I could get any VM in Databricks but Azure ML keep complaining I don’t have enough CPU.
Unfortunately I hit two bugs, first the native DuckDB file format seems to generate double the size of Parquet, the dev was very quick to identify the issue, the workaround is to define the table schema and then load the data using insert, the file became 24 GB compared to the original 40GB parquet files.
I End Up going with parquet files, I was not really excited by loading a 24 GB file in a storage account.
I run the Queries in Azure Databricks VM E8ds_v4 (8 cores and 64 GM of RAM)
As I am using fsspec with disk cache, the remote storage is used only the first run, after 4 tries, Query 21 keep crashing the VM 😦
Tableau Hyper
Tableau hyper was one of the biggest surprise, unfortunately, I hit a bug with Query 18, otherwise, it would have being the cheapest option.
Some Observations
Initially I was worried I made a mistake in Snowflake results, the numbers are just impressive for a single node tier, one explanation is the Execution Engine is mostly operating on compressed data with little materialization , but whatever they are doing, it has to do with the internal table format, which bring a whole discussion of performance vs openness, personally in a BI scenarios, I want the best performance possible, and wonder if they can get the same speed using Apache Iceberg.
Synapse Serverless improved a lot from last year, it did work well regardless of the data size of individual parquet files that I throw at it, and in my short testing it was faster than databricks and you pay by data scanned, so strictly speaking pure speed is not such a big deal but without a free result cache like BigQuery, it is still a hard sell.
Azure ML Quota policy was very confusing to me, and honestly I don’t want to deal with support ticket.
Databricks; may well be the fastest to run 100 TB, but for 100 GB workload, color me unimpressed.
DuckDB is impressive for an open source project that did not even reach version 1. I am sure those issues will be fixed soon.
Everything I heard about Redshift from twitter was wrong, it is a very good DWH, with Excellent performance.
BigQuery as I expected has excellent performance both for parquet and the native table format, The challenge is to keep the same using the new auto scale offering. added Auto scale performance, I think Google should do better.
Summary Results
You can find the results here, if you are a vendor and you don’t like the results feel free to host a TPCH-SF100 dataset in your service and let people test it themselves.
Note : Using SQL Query History : Bigquery one Cold Run , Synapse Serverless , Redshift Serverless and Snowflake a mix of cold and warm
(Note : Synapse Serverless always read from remote storage)
Databricks I am showing the best run from Disk, there is no system table, so I had to copy paste the results from the console.
Pricing
I did not kept the durations for Data load, it is just the cost for Read, obviously it is a theoretical exercise, and does not reflect real life usage which depends on other factors like concurrency performance , how you can share a pool of resources to multiple departement,free results cache, the performance of your ODBC drivers etc.
it is extremely important to understand what’s included in the basic price, for example.
Results cache:
BigQuery, Snowflake, Redshift results cache are free and you don’t need a running cluster, in Databricks you pay for it, Synapse don’t offer result cache at all.
Data loading :
BigQuery data loading is a free operation and other service like sorting and partitioning, in other DB you needs to pay.
Egress Fees :
Snowflake/BigQuery offer free egress fees, Other vendors you may pay, you need to check
Note :
BigQuery : for This workload make more sense to pay by compute not data scanned, either using auto scale, reserved pricing etc, I will try to test Auto scaling later.
Snowflake : I used the standard edition of Snowflake
Edit : I used a Google Colab notebook with a bigger VM for Hyper and DuckDB, see full reproducible notebook
Final Thoughts
Cloud DWH are amazing tech and only competition can drive innovation, not FUD and dishonesty, regardless of what platform you use, keep an eye on what other vendors are doing, and test using your own workload, you may be surprised by what you find.
Hybrid table is a Clever technical solution to a very fundamental problem in Data Analytics, How to keep Data fresh and at the same time fast, PowerBI , Tableau, Qlik solved this problem by importing data to a local Cache, this solution work for most of the use cases, but as with any solution it has limitation.
If the Data Source is too big, you can’t simply keep importing to the local cache.
If the Data Source change very frequently, like every couple of minutes or second, importing become just not practical or very hard.
PowerBI Engine team came up with a very simple Idea, you can have both Mode in the same table, Historical data that don’t change is cached and today data is queried live as it changed very quickly, Patrick from Guy in the Cube has a great video , Andy has another Video but specific to Synapse Serverless
This functionality was released in the December 2021 edition of PowerBI , but unfortunately when I test it with BigQuery, it did not work, I reported the issue and I have to say, I was really impressed by the Product team, (Kudos to Christian Wade and Krystian Sakowski ), yesterday they released an updated version and it fixed the issue. (it works with Snowflake, Databricks etc)
Setup
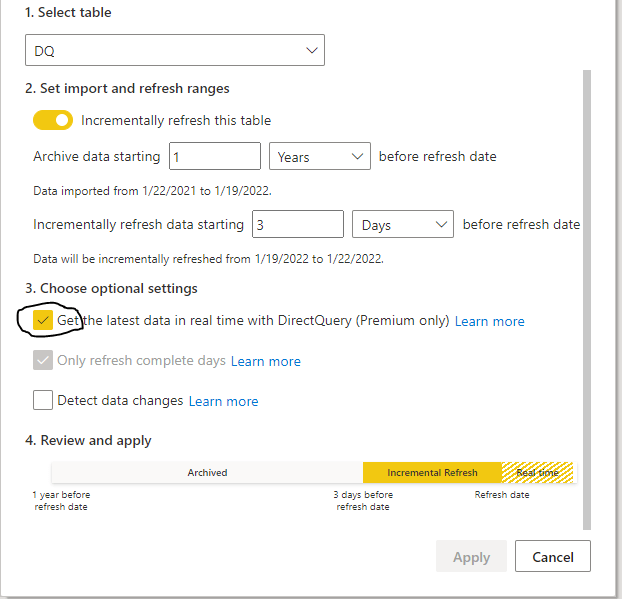
it is literary just an extra box to click compared to the Previous incremental refresh User interface
Yes, Just like that, The Engine will generate table partitions behind the scene, if you want to know why PowerBI is so successful, it is because of stuff like this, take a very hard problem and make it extremely easy for Non Tech people to use.
The Data Model is very simple; one fact table with Data that change every couple of minutes, and a Date dimension in a Mixed mode, ( watch Patrick Video, he explain why)
Premium Only
Yes, it is a premium only feature, and obviously it works with Premium per User, I am not going to complain, someone needs to pay for those R&D cost, but it will be really nice if they release it to the PRO license too, it just feels Odd that a core feature of the Engine is tied to a particular license, we had this situation before with incremental refresh and they did release it even for the free license, I hope the same will happen with Hybrid Table.
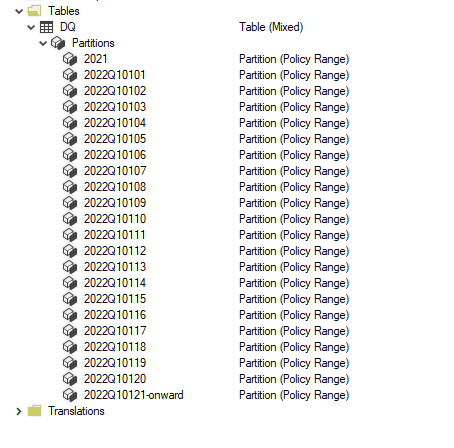
Mixed Partitions
I published the report to the service, and used Tabular Editor to see what’s going on behind the scene (make sure you download the latest version of Tabular Editor, works with the free version too)
As expected the Last Partition is Live Mode, and everything else is cached in PowerBI.
How it Works
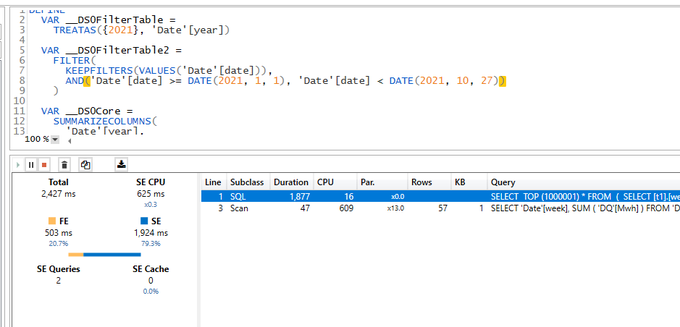
I used DAX Studio to capture what the engine is doing when you run a Query
PowerBI formula engine send two Queries one to the remote DB in my case BigQuery and the local Storage, you can clearly see the difference in speed
1 Day using DQ : 2 second ( the Query take 400 ms at the end point, But BigQuery has a very substandard ODBC driver)
13 Months worth of Data Cached : 47 ms
The Point is, if you can just import, do it, you will get the best performance and user experience
( At Work we have a sub 5 minute pipeline end to end from the Source DB to PowerBI).
The Devil is in the details
As far as I can tell, Formula Engine keep sending two Queries every time, even when the required data is cached already, obviously the Query from the external DB will return null results, in Theory , it should not be a big deal, Modern DW are fast specially with partitioning pruning.
Unfortunately no, only some Database can return a sub second null result set to PowerBI ( yes the Quality of the Driver is as important as the DB Engine itself)
Take Away
It is a very interesting solution worth testing for specific scenarios, but if you can get away with Importing data only, then it is still the best way, yes Hybrid Table reduce the Workload on the remote Database, but still you need a solid Database, getting a sub second Query from end to end is still a hard problem even for 1 day worth of data ( just test it, don’t forget concurrency )
I heard a different use cases, which I find very intriguing, some users want the other way around, recent Data as Import and historical Data as Direct Query, I guess it is useful if you have a real big fact Table.
A Surprising side effect of PowerBI Hybrid table,( maybe it was planned, who knows) Synapse Serverless in Direct Query mode looks now like a very good candidate to use, scanning one day of data is faster and an order of magnitude cheaper !!!
I still Hope that the Vetipaq Engine team surprise us in a future update and somehow let the Formula engine generate only 1 Query when all Data needed is in the Local cache.
Edit : February 2023 , Synapse serverless has substantially improved the Query performance for TPCH-SF10, first run which include calculating the statistics take around 2 minutes, but the second run is around 62 second.
In a previous blog, I did a benchmark for a couple of Database Engine, although it was not a rigorous test, pretty much the results were in the expected range, except for Synapse serverless, I got some weird results, and not sure if it is by design or I am doing something very wrong, so I thought it worth showing the steps I took hoping to find what’s exactly going on. The test was done in January 2022.
First Check : Same region
I am using an azure storage in Southeast Asia
My synapse Instance is in the same region
Ok both are in the same region, first best practice.
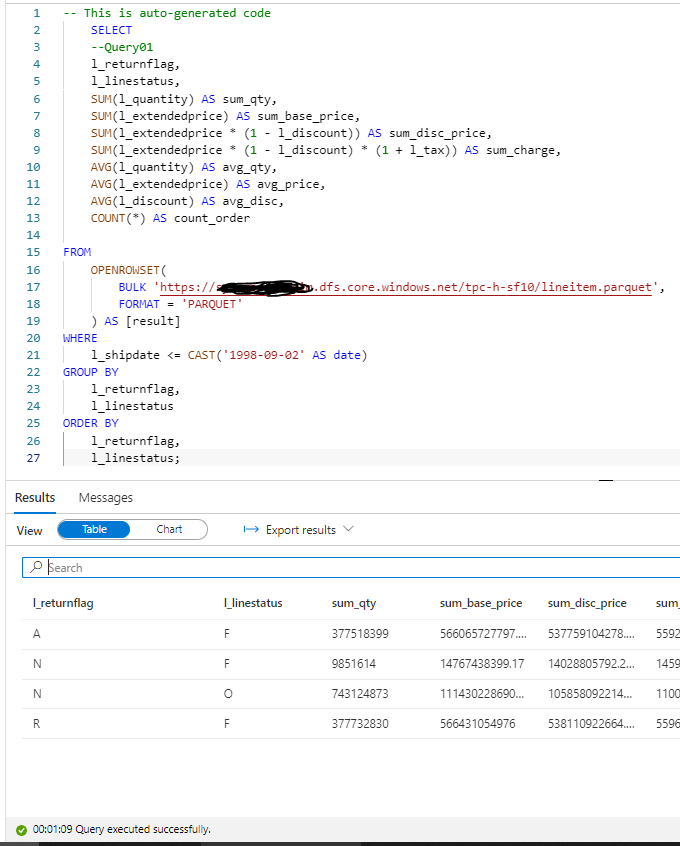
In Synapse, you can directly start querying a file without defining anything, using Openrowset, I thought I can test TPC-H Query 1 as it uses only 1 table, which did not work , some kind of case sensitive issue, when writing this blog I run the same Query and it worked just fine, ( no idea what changed)
1 minute on a second run, hmm not good, let’s try a proper external table , the data_source and File_format were already defined, so need to recreate it again.
ok 2 minute for the first run, let’s try another run which will use statistics, it should be faster, 56 second ( btw, you pay for those statistics too)
Not happy with the results I asked Andy ( Our Synapse expert) and he was kind enough to download and test it, he suggested splitting the file give better performance , he got 16 second.
CETAS to the rescue
Create External Table as Select is a very powerful functionality in Serverless, The code is straightforward
CREATE EXTERNAL TABLE lineitem
	WITH (
	LOCATION = '/lineitem',
	DATA_SOURCE = [xxxx_core_windows_net],
	FILE_FORMAT = [SynapseParquetFormat]
	)
as
SELECT * FROM dbo.lineitem_temp
Synapse will create a new table Lineitem with the same data type and a folder that contain multiple parquet files.
That’s all what you can do, you can’t partition the table, you can’t sort the table, but what’s really annoying you can’t delete the table, you have first to delete the table from the database then delete the folder
Not bad at all, 10 second and only 587 MB scanned compared to 50 second and 1.2 GB.
Now that I know that CETAS has better performance, I have done the same for remaning 7 tables.
Define all the tables
First Create an external Table to define the type then a CETAS, Synapse has done a great job guessing the type, I know it is parquet after all, but varchart is annoying by default it is 4000, you have to manually adjust the correct length.
The 22 Queries are saved here, I had to do some change to the SQL, changing limit to Top and extract year from x to Year (x), Query 15 did not run, I asked the Question on Stackoverflow and Wbob kindly answer it very quickly
The first run, I find some unexpected results
I thought I was doing something terribly wrong, the Query duration seems to increase substantially, after that I start messing around, what I found is, if you run just one Query at the time, or even 4, the results are fine, more than that, and the performance deteriorate quickly.
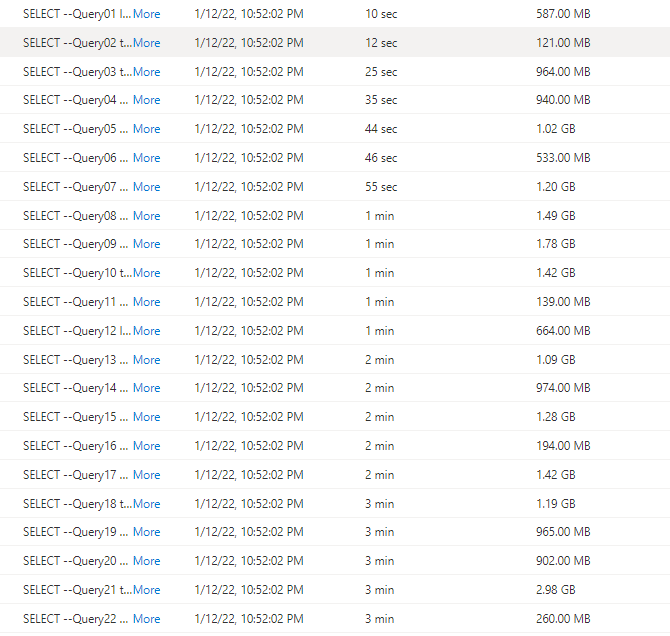
I imported the Query History to PowerBI and here is the results
There is no clear indication in the documentation that there is a very strict concurrency limitation, I tried to run the Script in SSMS and it is the same behavior, that seems to me the Engine is adding the Queries to a queue, there is a bottleneck somewhere.
Synapse serverless show the duration between when the Job was submitted until it is completed, there is no way to know the actual Duration of each Query, so basically the Overall Duration is the duration of the Last Query, in our Case Q22, which is around 3 Minutes.
Takeway
The Good news, the product team made it very clear, Synapse Serverless is not an Interactive Query Engine
Realistically speaking, reading from Azure storage will always be slower compared to a local SSD Storage, so no I am not comparing it to other DWH offering, having said that even for exploring files on azure storage, the performance is very problematic.