Edit: 16 may 2022, the hack is no more required, PowerBI released fields parameter that support this functionality out of the box.
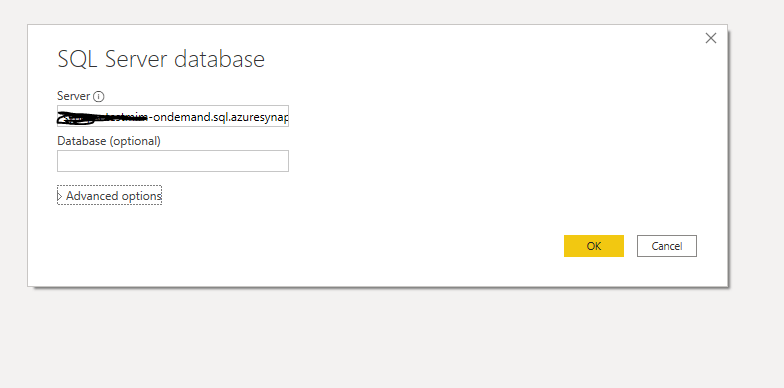
Edit : 20 Feb 2022 , SQL Server is finally supported, I test it with an Azure SQL and it worked, it is supported when using the Enhanced Engine in Dataflow, make sure you use the Power Platform connector.
At Last, PowerBI added support for parameters that can be changed by the end user, I guess from a Business perspective, it is mostly useful when you deal with Big Data load, and you want to control exactly the Query generated at the data source level, but in this short Blog, I will show how some use cases where hard or clunky using DAX became extremely easy to do using Parameters.
pbix file here : notice it is connecting to my DB instance, so it will not work but you can see the Data Model.
I think it is wise to read the documentation here first
Chris Webb has a great use case using Azure Data explorer here
Update : I added a new use case here, changing weekend Date Dynamically
We want to change a dimension based on a user selection from a slicer, currently Only DirectQuery is supported and to be honest, the documentation does not tell which data source works, we know SQL server is not one of them, Thanks to Alex for his clarification, Luckily BigQuery Works ( that was a very nice surprise to be honest)
I am using the Covid19 data set as an example (as it is free and don’t incur any charge till sept 2021), we want to switch dynamically between countries and continent
1- Load the main Table as import mode
2- Create a parameter ” Level_Details”

3- Import dimension Table with the values countries and Continent in Direct Mode:
I created a view in BigQuery , PowerQuery stopped folding when I tried to remove duplicated, although it is free data source, it is important to use directQuery only with dimension Tables to reduce cost and Data volume
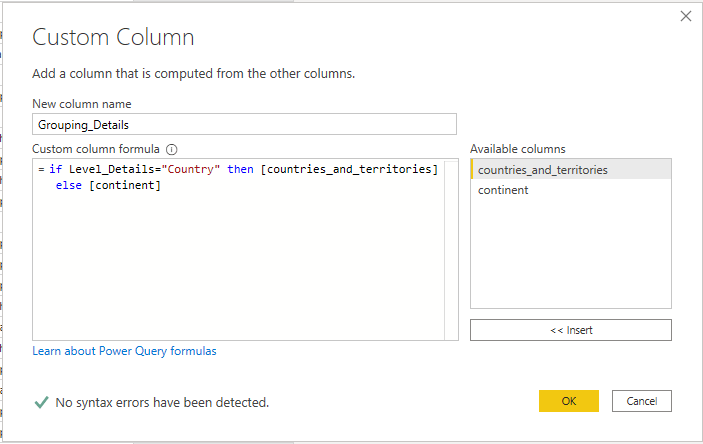
4- Include the parameter logic in Dimension Table
I created a new Column “Grouping_Details” based on the Parameter Value, it will Take either Countries or Continent
5- create a new Table that contains all the possible values for the Parameter
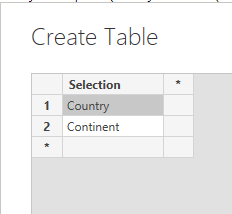
by the way, you can use any table, either imported, or generated using DAX, this is a very clever implementation by the PowerBI team compared to Other BI Tool.
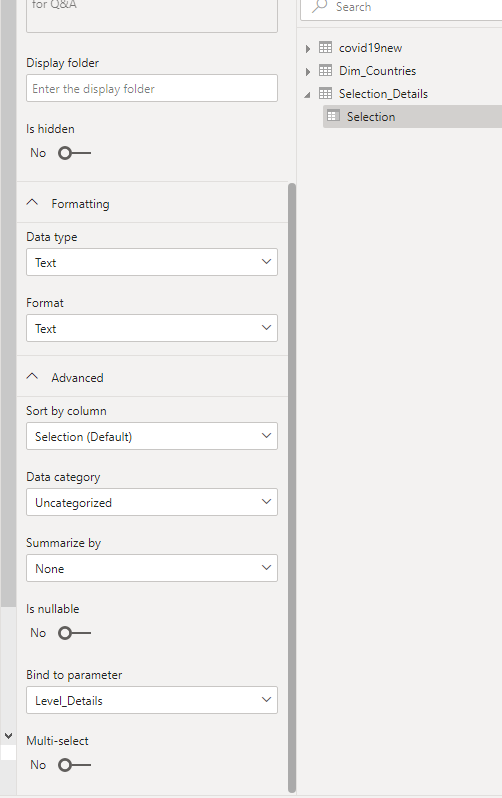
6- Bind the value of the column “Selection” to the Parameter
here is a View of the Data Model

it is very Important that “Selection_Details” stay as a disconnected Table, otherwise it will create new filter selection in the Queries which we don’t want, it will work but we want to control exactly the Query generated by PowerBI
And the Report
The feature is in Preview and I am sure, they will introduce more Data Sources and functionalities, by adding support to BigQuery, Microsoft sent a clear message, PowerBI is the best Data Analytics tool and they will support any third Party Data Warehouse, even if it is a direct Competitor.
Personally,I am very excited by the thought that we are very close to Finally have Parameter Action In PowerBI , and that will introduce a new class of Visual Analytics Interaction that was not even Possible, Please need some Votes here
Btw, if you use BigQuery with PowerBI, I appreciate some votes here, we need the support of Custom SQL Query with Parameter