TL;DR : The high-end version of this problem is mostly solved. GPT-4 or Claude Opus paired with a mature proprietary semantic layer like Microsoft Power BI’s will handle natural language queries reliably in production, This blog is a much narrower use case: how do small language models (4B parameters, 4GB VRAM) perform when paired with open-source semantic layers? not great, not terrible as of April 2026 😦
Running a 4B model through an immature open-source semantic layer on a laptop GPU is not a production architecture — but it turns out to be a surprisingly useful lens for measuring fundamental SLM progress. How much reasoning capability fits in 4GB? How well do small models follow explicit constraints? Where do they break down under complexity?
Curiosity is a valid reason to run a benchmark. even for fun
The hardware constraint is real. An NVIDIA RTX A2000 Laptop has 4GB VRAM. Models above ~4GB Q4_K_M overflow into Windows virtual memory and run painfully slow. The practical ceiling is a 4B parameter model at Q4_K_M quantization.
The architecture looks like this:
 Natural language question
          │
          ▼
   ┌─────────────┐
   │     SLM     │  (4B params, 4GB VRAM)
   └──────┬──────┘
          │ reads                    ┌──────────────────────┐
          ├─────────────────────────►│  Semantic Model YAML │
          │                          │  measures, joins,    │
          │                          │  anti-patterns       │
          │                          └──────────────────────┘
          │ writes semantic query
          ▼
   ┌──────────────────┐
   │  Query Compiler  │  (Malloy / boring-semantic-layer / none)
   └──────┬───────────┘
          │ generates SQL
          ▼
   ┌─────────────┐
   │   Engine    │  (DuckDB)
   └──────┬──────┘
          │ reads
          ▼
   ┌─────────────┐
   │    Data     │  (star schema)
   └─────────────┘
The bet: give a small model a semantic model as its system prompt, and it should close the gap. Encode the domain knowledge — measure definitions, join rules, anti-patterns — so the model doesn’t have to infer them from a raw schema. Reduce the cognitive load, reduce the capability requirements, get closer to fast and correct.
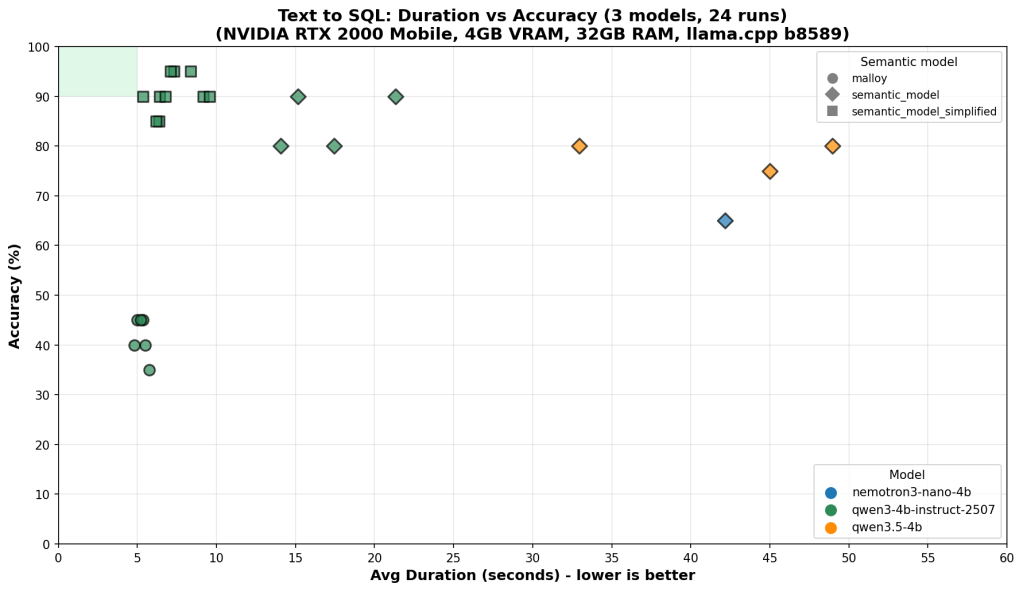
On the benchmark chart, that target lives in a small green rectangle in the top-left corner: high accuracy, low latency. This post is about what it takes to reach it — and why we’re still not reliably there.
What the Tests Measure
20 questions, graded from trivial to genuinely hard. Every answer is judged by exact result matching: every row must be correct, column order ignored, 0.5% numeric tolerance for floating point aggregations. Partial credit doesn’t exist.
The easy end (Q1–Q5): total revenue, total quantity sold, list of store names. Any model that can read a schema gets these right.
The hard end (Q18–Q20):
- Return rate broken down by customer age group × weekend/weekday flag, joined through two fact tables
- Brand-level year-over-year return rate change filtered by store state
- Average net sales per transaction by item class and customer preferred flag
These require correctly combining multiple joins, conditional aggregations, and derived measures — and producing results that exactly match the reference answer.
Each run is plotted as accuracy vs. average duration per question. Speed matters because on 4GB VRAM, model size and inference cost are real constraints, not theoretical ones.
Results
One experiment: strip the full YAML semantic model (31KB, two explicit fact tables, extensive field metadata) down to a simplified version (23KB, single logical model, reduced noise). Less token budget spent on metadata, more focus on the patterns that matter.
Results across 3 models × 3 semantic model variants, 24 total runs:
                         Accuracy     Speed      Consistency
qwen3-4b + full model    ~90%         ~10s       scattered
qwen3-4b + simplified    ~90–95%      ~5–8s      tight → green box
nemotron + either        40–85%       ~5–12s     high variance regardless
qwen3.5-4b               ~75–80%      ~45–55s    slow regardless
A capable LLM writing raw SQL can score well on individual runs — 90%+ accuracy on the best models. That sounds promising until you look at the consistency column. The same question, asked twice, can produce correct SQL one run and wrong SQL the next. That variance doesn’t go away with better prompting — it’s a fundamental property of using a probabilistic model for a deterministic task.
Simplifying the semantic model helped the strongest model converge into the green box — higher accuracy, faster, more consistent. For weaker models, variance stayed high regardless of which semantic model they received. The bottleneck had shifted from context quality to model capability.
You cannot simplify your way past a capability ceiling.
Why Raw LLM Breaks
The failure patterns are specific and instructive.
The CTE + FULL OUTER JOIN pattern. The semantic model is explicit: never join the two fact tables (store_sales and store_returns) directly. Always aggregate each separately in a CTE, then combine with FULL OUTER JOIN. Direct joins cause row multiplication. When a model gets this wrong, the result looks plausible — same columns, similar numbers — but every figure is wrong. Models violate this more than you’d expect, especially when the question doesn’t obviously signal that two fact tables are involved.
-- Wrong: direct join multiplies rowsSELECT s.s_store_name, SUM(ss_sales_price * ss_quantity) as total_sales, SUM(sr_return_amt) as total_returnsFROM store_sales ssJOIN store_returns sr ON ss.ss_item_sk = sr.sr_item_skJOIN store s ON ss.ss_store_sk = s.s_store_skGROUP BY s.s_store_name;-- Right: aggregate each fact separately, then join the summariesWITH sales AS ( SELECT ss_store_sk, SUM(ss_sales_price * ss_quantity) as total_sales FROM store_sales GROUP BY ss_store_sk),returns AS ( SELECT sr_store_sk, SUM(sr_return_amt) as total_returns FROM store_returns GROUP BY sr_store_sk)SELECT s.s_store_name, COALESCE(sales.total_sales, 0), COALESCE(returns.total_returns, 0)FROM store sLEFT JOIN sales ON s.s_store_sk = sales.ss_store_skLEFT JOIN returns ON s.s_store_sk = returns.sr_store_sk;
Literal instructions ignored. Q9 requires the raw flag values as group labels: 'Y' and 'N', not 'Preferred' and 'Non-Preferred'. The semantic model says this explicitly. LLMs substitute human-readable labels anyway — not because they misread the instruction, but because “Preferred / Non-Preferred” is the more natural output. The model understood what you wrote. It decided it knew better.
These failures share a structure: the semantic model content is correct, but LLM use of it is unreliable. The context is a hint, not a guarantee. You cannot build a production analytics system on a component whose failure modes are unpredictable. Reliability requires a deterministic layer — a compiler that enforces the patterns, not a model that may or may not follow them.
The Right Architecture: LLM Intent + Deterministic Compilation
The right split between LLM and algorithm is this: use the LLM for what only an LLM can do, and use deterministic code for everything else.
Natural language understanding is irreducibly fuzzy — only the LLM can map “show me underperforming stores last quarter” to the right intent. But once that intent is expressed as a structured query, everything downstream is deterministic. The join logic, the measure definitions, the SQL generation — these are mechanical translations that a compiler does perfectly, every time, for free. Running them through an LLM instead wastes token budget on a task that doesn’t need intelligence, while leaving less capacity for the task that does.
The ideal split: the LLM translates natural language into a compact domain-specific query expression. The compiler translates that into SQL. The LLM never touches raw schema column names; the compiler never sees ambiguous natural language.
A query compiler is the right architecture for this problem. It’s deterministic: the same query gives the same answer every time. It enforces join logic and measure definitions by construction, not by suggestion. You can build systems around deterministic limitations. You cannot build systems around random failures.
The DSL the LLM targets doesn’t need to be as simple as SELECT measure FROM model GROUP BY dimension. Users ask for year-over-year comparisons, cohort breakdowns, conditional aggregations — the DSL has to be expressive enough to capture these. But “expressive enough for analytics” is still a far smaller language than SQL. The LLM has a much easier job expressing intent in a constrained, familiar DSL than generating arbitrarily complex raw SQL correctly every time.
Why Open-Source Compilers Aren’t There Yet
The current open-source implementations just aren’t there yet.
Fact-first structural limitations. Most open-source semantic layers are fact-first by design: all queries anchor to the fact table. “List all stores” should return 8 stores. Running through boring-semantic-layer, it returns 6 — stores with no sales are excluded because they have no fact rows. This is not an edge case; it breaks a whole category of queries that any real analytics system must handle. (see example here: boring-semantic-layer #224) Dimension-first routing — queries that go directly to dimension tables when no fact aggregation is needed — is a fundamental capability gap.
Niche query languages. Malloy compiles high-level queries to SQL — the LLM writes Malloy, the compiler handles join logic. In theory this is exactly right: offload SQL generation to a trusted compiler, let the LLM express what to compute. In practice, LLMs have seen enormous amounts of SQL during training and almost no Malloy. Syntax errors were common, measure references wrong. The compiler generated correct SQL from correct Malloy — but getting correct Malloy out of the LLM was harder than getting correct SQL directly.
The proprietary proof that this architecture is buildable: Microsoft Power BI’s query planner handles multi-fact joins, period-over-period comparisons, and dimension-first routing reliably, backed by years of engineering investment. The open-source ecosystem isn’t there yet — and there’s no guarantee it gets there. The commercial incentive that drove Power BI and Looker to solve these problems doesn’t exist for open-source projects in the same way.
The Ceiling Is Implementation Quality
The semantic model doesn’t need to pre-declare every possible query pattern — that’s the point of having an LLM in the loop. “Sales performance in 2020 vs 2021” should be composable: the SLM reads the base measures (total_sales, date_dim keys, grain definitions) and constructs the year-over-year logic itself. Multi-period comparisons, cohort filters, conditional aggregations — these should emerge from creative composition of well-defined primitives, not from an ever-growing library of pre-baked templates. The semantic model’s job is to define what things mean; the SLM’s job is to figure out how to combine them. When that division holds, the system is genuinely expressive. When it breaks down — when the SLM can’t compose reliably from primitives.
Query planner quality degrades fast once you move beyond simple aggregations. The moment you introduce measures that ignore filter context — MAX(date) computed across the full table regardless of what the user filtered — the planner has to reason about predicate pushdown, materialization order, and query cost. A naive planner gets this wrong silently: it scans everything, computes the max, then filters afterward. A recent semi-proprietary semantic layer ( which should remain nameless), supposedly mature, did exactly this on a simple max date ignore filter measure , a sub-second query became a 30-second full table scan.
Where This Goes
There are two truths that can coexist here.
On one side, models are clearly improving. Techniques like aggressive quantization are delivering more reasoning capability within tight resource constraints, making smaller deployments increasingly viable. At the same time, the architectural pattern of separating LLM intent from deterministic compilation is sound. It reflects how the most reliable production systems are built today. In that sense, the open source ecosystem is moving in the right direction, even if current implementations are still maturing.
On the other side, there is a meaningful gap between something being buildable and being built correctly. That gap is easy to underestimate. What looks like a working system often breaks down under real-world conditions: edge cases, ambiguous semantics, inconsistent schemas, and the need for cost-aware execution planning.
Bridging that gap is not just a matter of better ideas. It requires depth. Years of iteration, careful handling of corner cases, and continuous refinement of query planning and semantic layers. Systems like Power BI or Looker did not arrive there by accident. They reflect sustained, focused investment in exactly these problems.
Whether the open source ecosystem will reach that same level of depth remains an open question. It is not a question of capability or intent, but of coordination, time, and sustained effort across a fragmented landscape.
So the current state is this: the architecture is directionally correct, but the hardest parts are still unresolved, and progress on those parts is inherently slow.
Edit: There is also a credible alternative trajectory. If smaller language models continue to improve, direct SQL generation may become reliable enough for a large class of use cases. In that world, the need for a semantic query compiler does not disappear, but it becomes less central, reserved for cases where correctness, governance, or performance guarantees truly matter.
Thanks to Stefan Suwelack for the push back 🙂