Onelake supports Row Level Security and Column Level Security. These protections work when you use trusted engines such as Power BI or Spark running inside Microsoft Fabric. In those environments, the compute engine operates within a controlled boundary, so security rules can be enforced properly.
However, if you try to access the storage directly from a Python notebook or a local engine running on your laptop, including open source Spark, direct access is blocked. Otherwise, Row Level Security and Column Level Security would be meaningless. Security only works when the engine itself is trusted and governed.
This blog show a workaround by laveraging SQL Endpoint, These policies are enforced at the SQL endpoint, meaning any external tool that connects through it — including DuckDB — automatically respects them.
Let’s walk through a quick example.
The Data
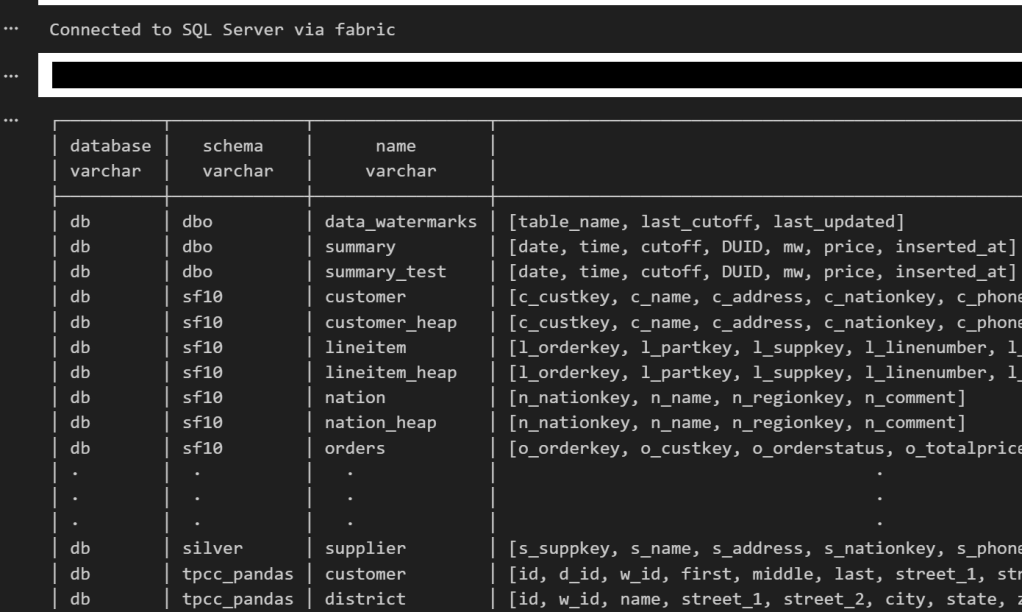
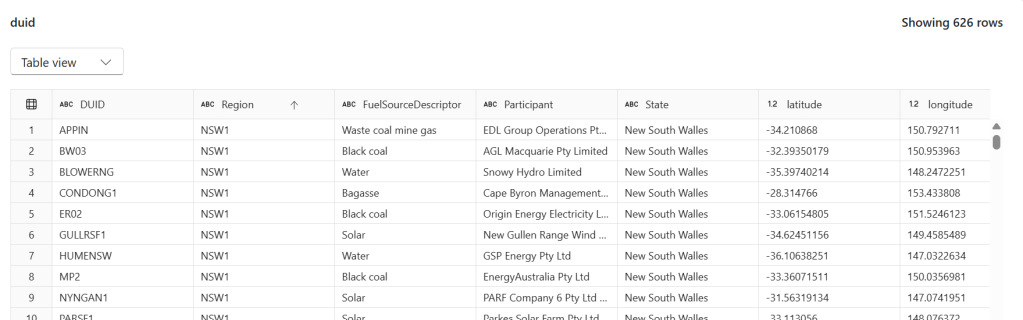
We have a power.duid table containing 626 rows of Australian power generation facilities. Columns include DUID, Region, FuelSourceDescriptor, Participant, State, latitude, and longitude.
Configuring Row-Level Security
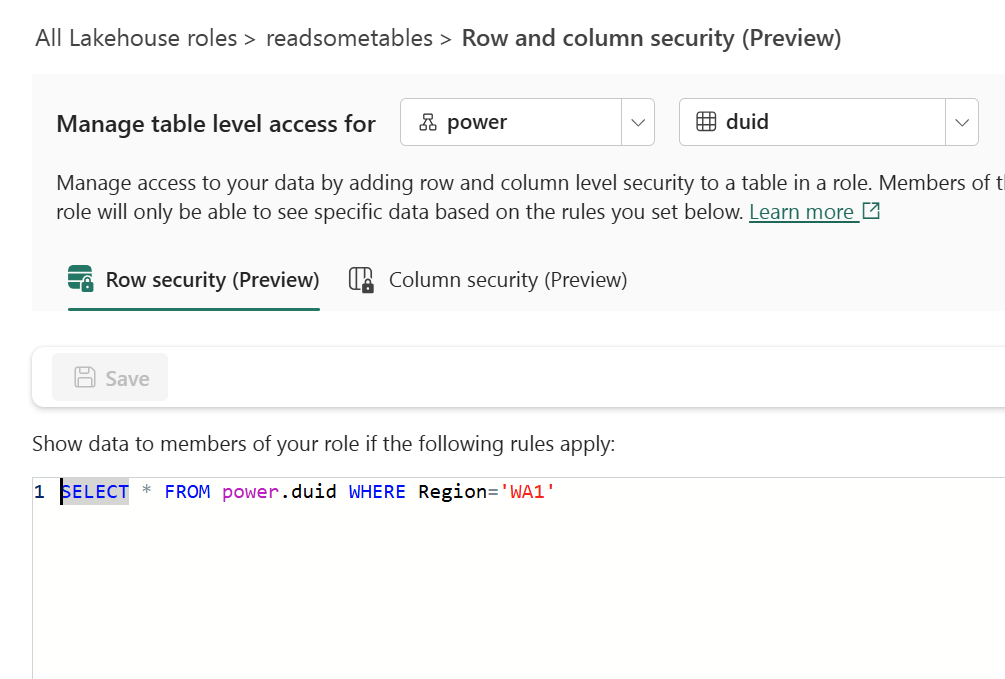
In the Lakehouse role readsometables, we add an RLS rule that restricts visibility to a single region:
SELECT * FROM power.duid WHERE Region='WA1'
Members of this role will only see rows where Region = 'WA1'.
Configuring Column-Level Security
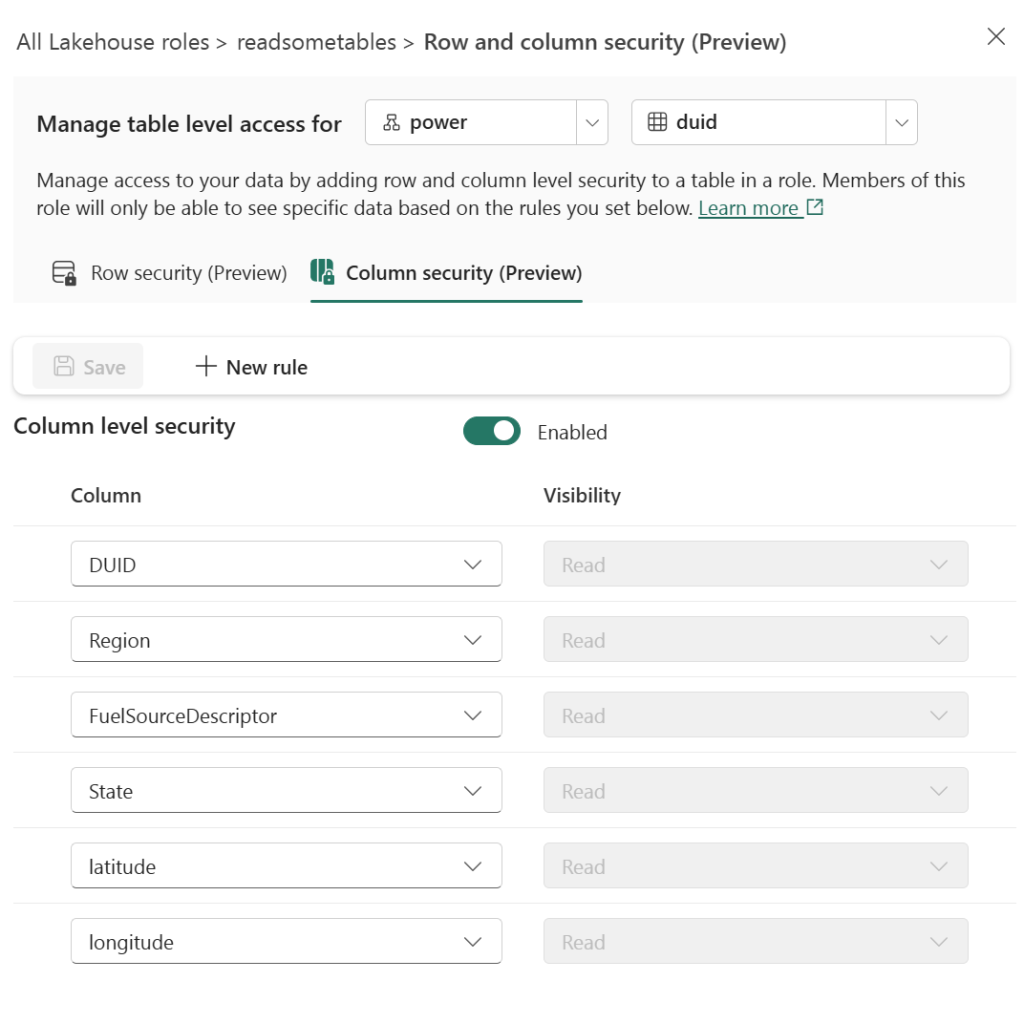
On the same role, we enable CLS and grant Read visibility only to specific columns: DUID, Region, FuelSourceDescriptor, State, latitude, and longitude. The Participant column is excluded.
Querying with DuckDB’s MSSQL Extension
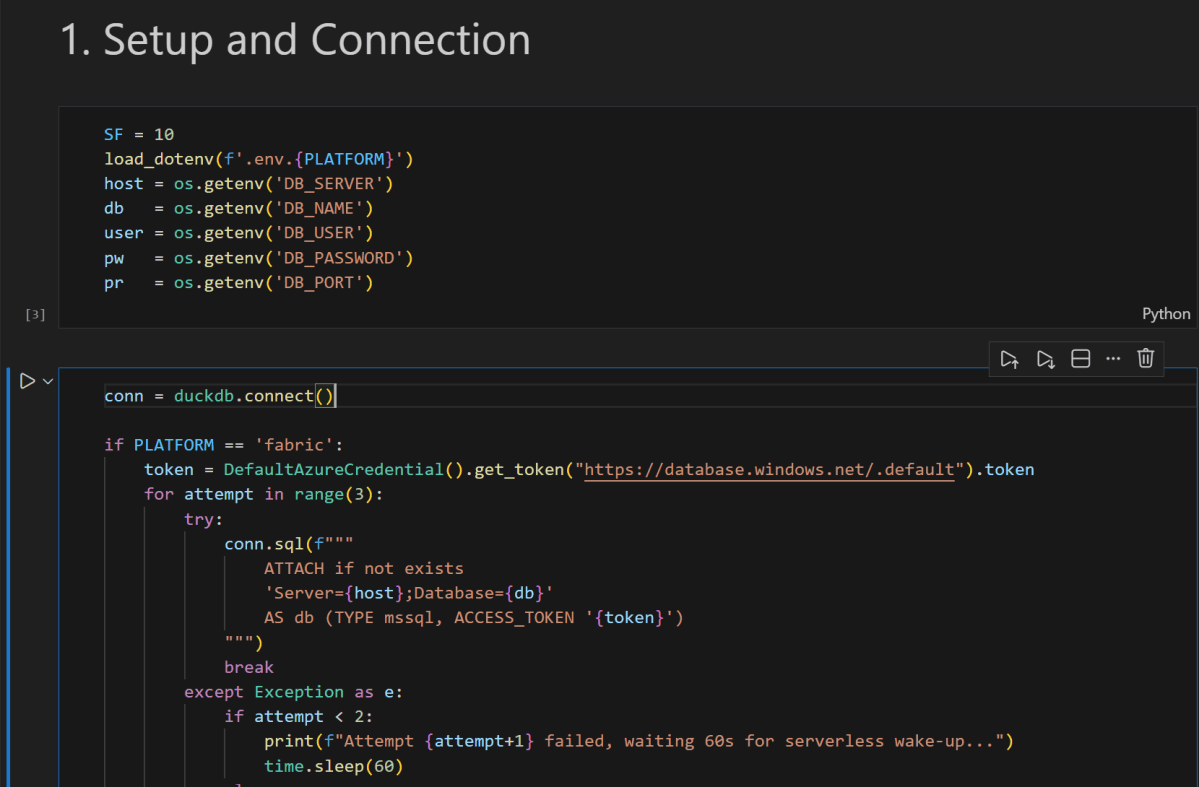
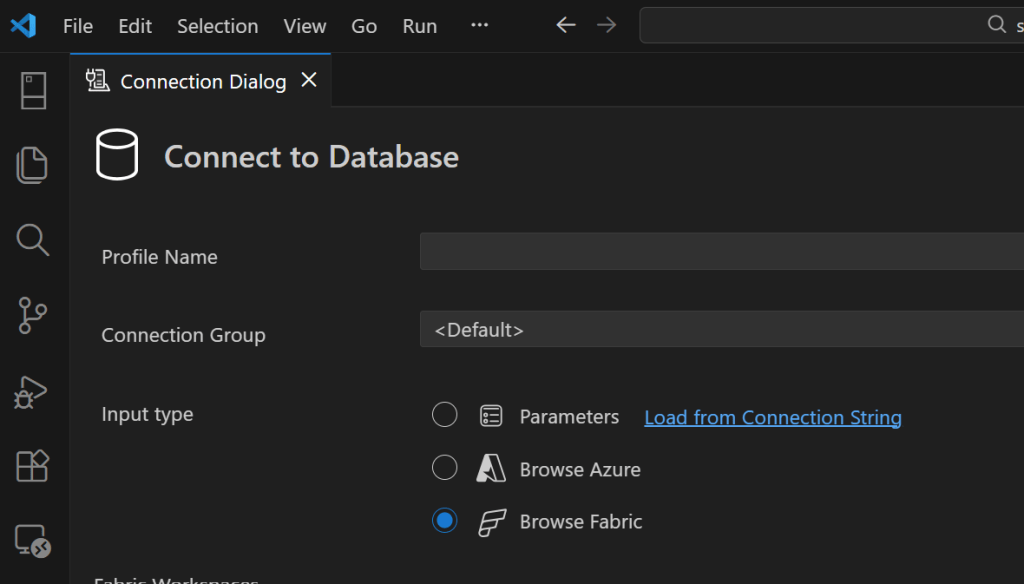
From any Python environment, we can connect to the SQL endpoint using DuckDB’s community MSSQL extension and Azure authentication:
import duckdb
from azure.identity import DefaultAzureCredential

conn = duckdb.connect()
token = DefaultAzureCredential().get_token("https://database.windows.net/.default").token

conn.sql(f"""
    ATTACH IF NOT EXISTS
    'Server=<your-sql-endpoint>;Database=data'
    AS data (TYPE mssql, ACCESS_TOKEN '{token}')
""")
if you are running it inside Fabric notebook, first you need to updgrade duckdb,
!pip install duckdb --upgrade
import sys
sys.exit(0)
the run this code
import duckdb
conn = duckdb.connect()
token = notebookutils.credentials.getToken('sql')
conn.sql(f"""
                install mssql from community ;
                ATTACH if not exists
                'Server=SQL_endpoint;Database=data'
                AS data (TYPE mssql, ACCESS_TOKEN '{token}')
          """)
Now when we query, RLS and CLS are enforced server-side:
conn.sql("SELECT DISTINCT(Region) FROM data.power.duid").show()
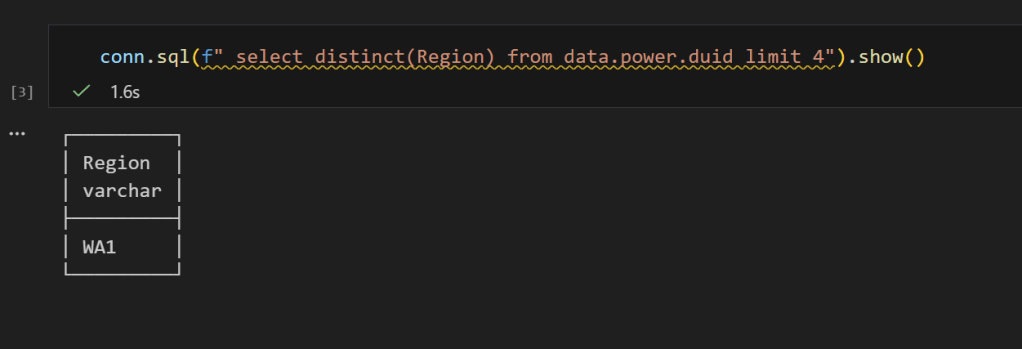
Only WA1 — the RLS filter is working. And if we select all columns:
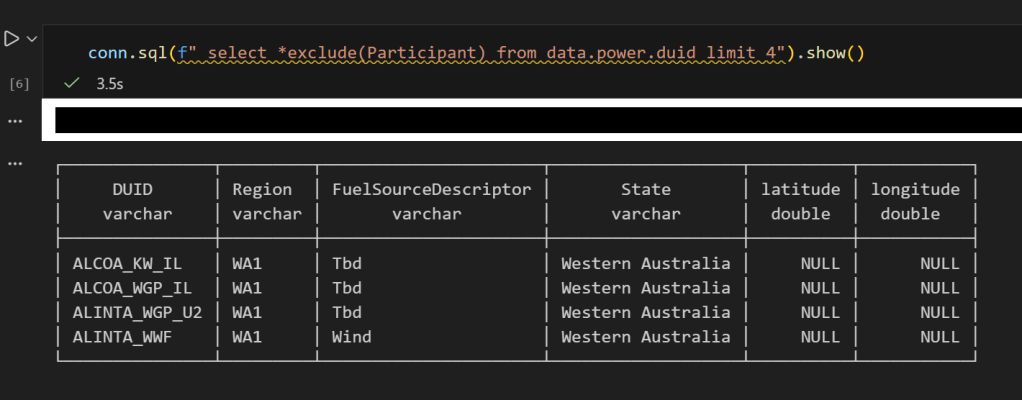
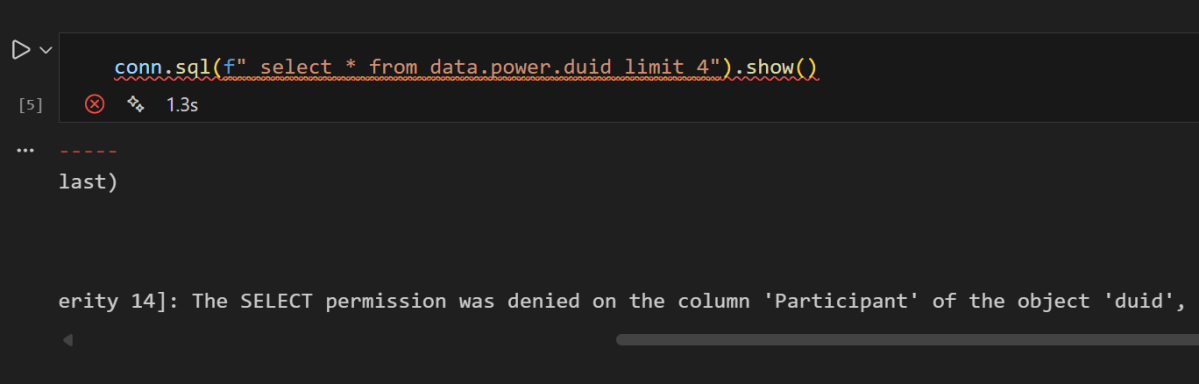
conn.sql("SELECT * FROM data.power.duid LIMIT 4").show()
you get an error, that you can not select Participant

No Participant column — CLS is doing its job, now if you remove it , everything works fine