Major Milestone Tracking – By Darrin Kinney

A key quality of project controls management, is the communication of major milestones. The whole point is to review the changes of all the dates over time.

A key quality of project controls management, is the communication of major milestones. Every lead will have several spreadsheets with all our milestones listed on rows, and columns for the various interpretations (baseline, contract date, prior forecast, current forecast, contractor forecast, etc). So when we talk about dates, the difficulty is that everyone will have a different date in their mind. Continue reading “Major Milestone Tracking – By Darrin Kinney”

Connecting PowerBI to Primavera Database – Part 2 (WBS report)

in the first blog post of this series, we showed how to connect to Primavera SQL server, in this blog we build our first report, we use only the three tables TASK, PROJECT, and PROJWBS

the online report is published here

I will not show the details of every steps, you need to have a basic understanding of PowerQuery and DAX, but i will highlights some aspects of Primavera Database schema that you should be aware of.

Reproduce Project View

this view show all the projects grouped by WBS and show measures, start date, finish date and budget labor units

and here is the equivalent report in PowerBI

PROJWBS

the table PROJWBS store the EPS/WBS data for all projects, it is represented the database as a parent, child ID, which can’t be used directly by PowerBI, first we need to flatten the data to multiple levels so we can show it in a matrix visual, so basically moved from this format

to this format

you have multiple options either using SQL , DAX or PowerQuery, for Powerquery here is an excellent resource by the Imke Feldmann , for our example I am using DAX , the canonical reference is by Marco Russo

just make sure when you import a table from SQL server to have this filter [delete_session_id] = null , because Primavera don’t directly delete data, but instead have something called soft delete, ie; the items is not shown in the client but it is still in the database and will be deleted later, anyway for PROJWBS remove all the template WBS, (I think they are used by the EPPM web client)

TASK

task is straightforward it save all the tasks of the project, same filter [delete_session_id] = null

PROJECT

we use project table only to filter the baseline out, in Primavera current project and baseline are saved in the database exactly the same way ( that very powerful paradigm ), but for our report we want to show the activities only for the current project, too easy [orig_proj_id] = null and the best part, we don’t have to write any queries, Powerquery simply generate the SQL for the database ( that’s awesome)

Simple Data Model

the two tables are connected by the field wbs_id, we added another copy of the table TASK as a dimension table for reporting ( just activity id, and activity name), and we have this simple data model, I like to save measures in a separate dummy tables

as you can see, building a data model is relatively easy, the complexity start when you want to add more measures, for example, total float, you need to connect to the table CALENDAR, if you want cost, you need to connect to other tables, and if you want spread it will become a little trickier ( hint it is not saved in the database)

hopefully by now, instead of asking how to connect to Primavera Database, the interesting question become, in which table the data is saved and how to join two separate tables to get the report you want

if you are still reading, I will appreciate if you can vote on this idea, unfortunately you can’t dis-activate table sorting in PowerBI, in this particular report, the sorting is already defined by the WBS, if the user click on the header, the order will change, they can still reset the order using the measure sort, still very annoying

Connecting PowerBI to Primavera Database, Part 1

I think one of the most asked question when some talk about Primavera and PowerBI, is how to connect to the database, ok, the good news is, the connection itself is easy, the bad news, extracting useful information is a bit of work.

Just to show how it work, I am using a temporary installation in my personal laptop, as obviously I don’t have access to my production database.

I am using a developer edition of SQL Server 2006, and an evaluation copy of EPPM, oracle allow the use the evaluation of most of its software for the first 45 days, you can download a copy from here, you need SSMS too

For the purpose of this blog, we will query the “normal” Primvera tables, for the extended schema, which is a groups of tables and  views design specifically for reporting, but those extra tables are empty per default and you need to configure publishing service ( will discuss it in a future blog), please note I already blogged about how to connect when using Sqlite in the case of standalone P6 professional

Connect to SQL server using SSMS

When you install Primavera, you get to define 4 user account

  • sa : the database admin account (not the admin for primavera application).
  • Privuser, pubuser : used to connect Primavera app to the database
  • Pxrptuser : user account for reporting

              We will use sa to connect to the database            

When you click on connect you get this

The database itself has 320 tables; you can check that by running this SQL script

USE PMDB

GO

SELECT *

FROM sys.Tables

GO

Create a read only user

Connecting using the admin account is just very bad practise, and I don’t want to mess with the existing account, so instead we will create a read only user account

  1. Create a New Login
  • Create password
  • Map the user the PMDB
  • Assign a new role

Instead of having access to the 320 tables, we create a new role (read_only) and we just assign the 3 most important table in the database, you can add later more tables, we granted select only, so no read access

Connect PowerBI to SQL using read only user

and Voila our Tables are now visible in PowerBI

so the answer to how to connect to Primavera Database from PowerBI is you need a user name, password and the server name, the challenge is how to extract meaningful reports from those tables ?

what’s next

at this stage, you need to get yourself familiar with Primavera Schema, yes it is 320 tables, but the basic one are three, and usually for my reporting I use around 10, I wrote an introduction to Primavera schema 6 years ago, I hope it is still relevant

Part 2 is published here

For security implication please read this

Create a PowerBI Resource Analysis Dashboard – by Darrin Kinney

Feel free to provide comments directly to my LinkedIn Post that references this article and contact me directly – Darrin Kinney

Some content in this post is perhaps superseded by PowerBI Progress & Schedule Dashboard.

Getting the right structure for what a PowerBI dashboard can do in relationship to construction projects is not a 1 sized fit all approach, so really this post is meant to just focus on some of the data elements, which again have been perhaps better presented in the new link above

Analyzing  resources in P6 is a common responsibility of all planners. However, ultimately the data typically stays in the realm of the planner, and never properly given to the specific project managers and project engineers who actually need to execute the work. Thus, there exist a huge opportunity in the digital world to extract data from P6, and present it to the masses. Planners are penultimate professionals in this. We live for this. We take the resource assignment data from P6 and work our magic in excel creating a suite of reports and graphs (s-curves).

However, all the excel work is customized. The ability to quickly drill into the data from the data table or the graph is just too difficult for management. The need to create custom graphs, takes time. Instead, we can create something quite amazing using PowerBI.

Using PowerBI we can create a simply easy to use dashboard that provide nearly unlimited flexibility to display both schedule and resource information to any user on a project. The below is a walk through to create a simple view with a simple schedule. However, I have run this through a schedule with 5,000 activities and multiple resources including both manhour resources and quantity resources. It is situations where you have data overload that PowerBI shines. Get the data out from the planner, and into the hands of the project management group.

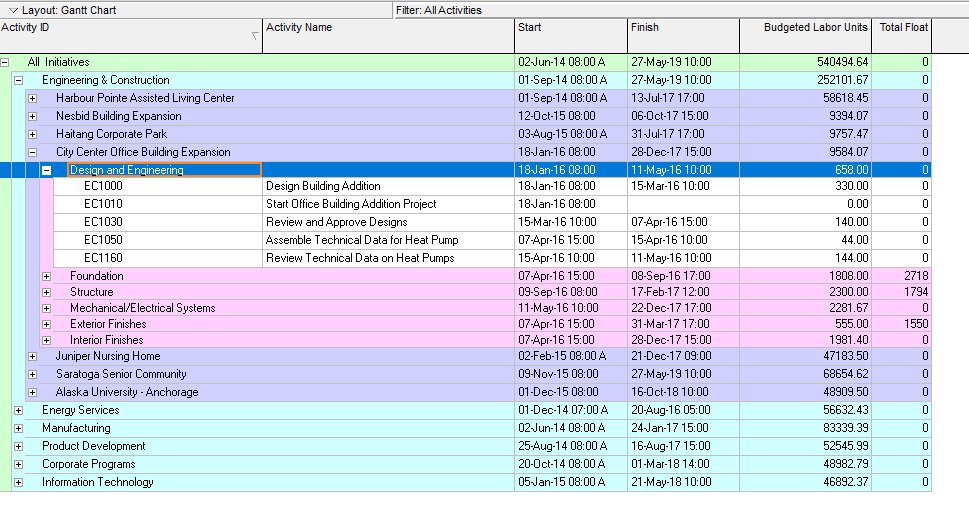
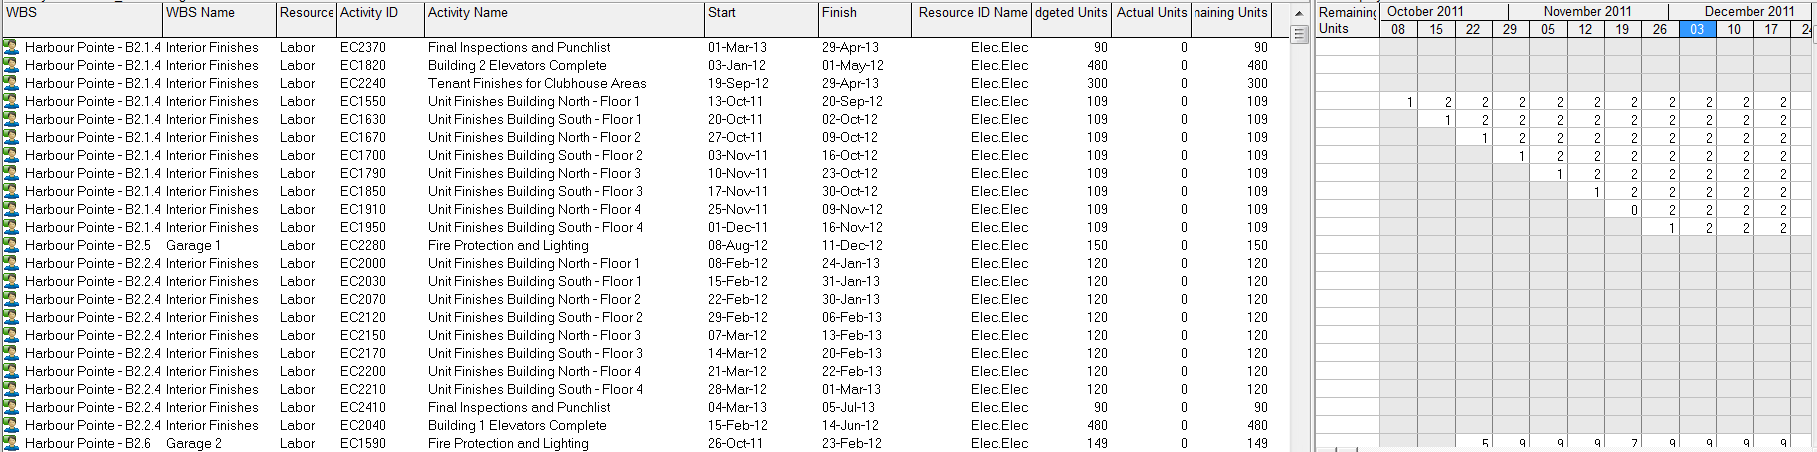
Step 1 – Get resource assignment data

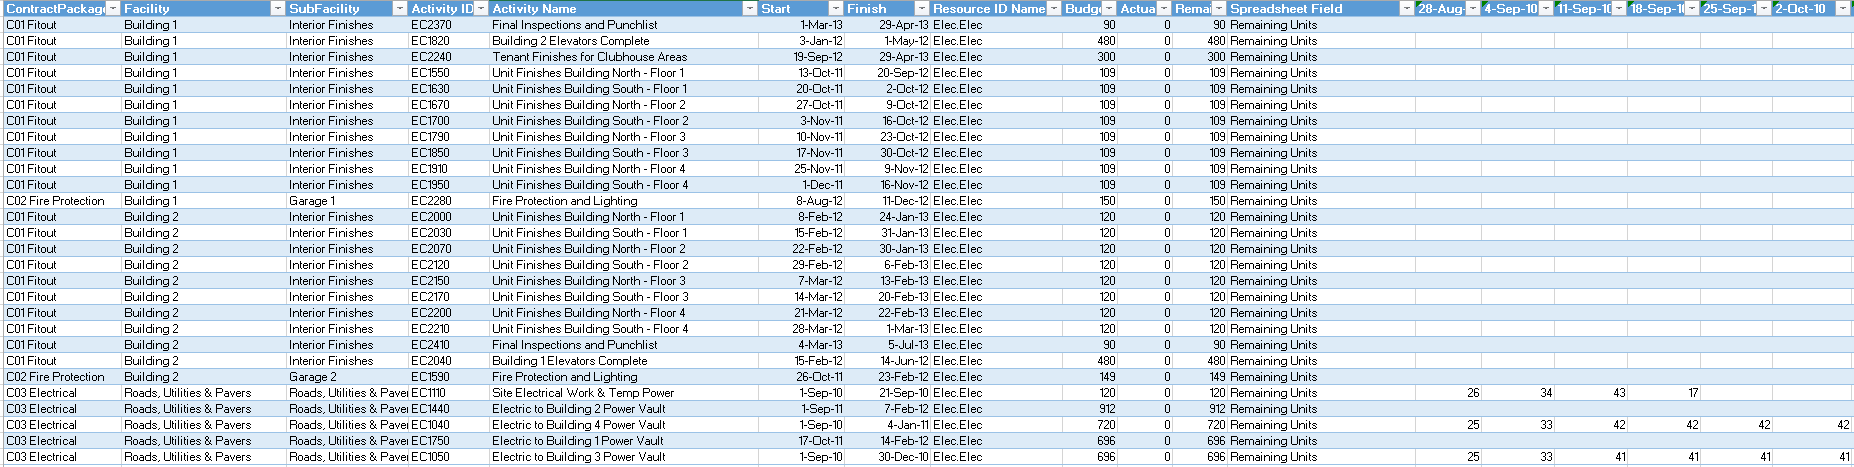
Using the resource assignment tab in P6, remove all the grouping and just display everything. You will want to ensure some key fields are available: Start Data, End Data, Resource Data, Resource ID and Type, Activity Name and ID, plus some WBS and grouping data (ex contract).

RA_2_P6_resources

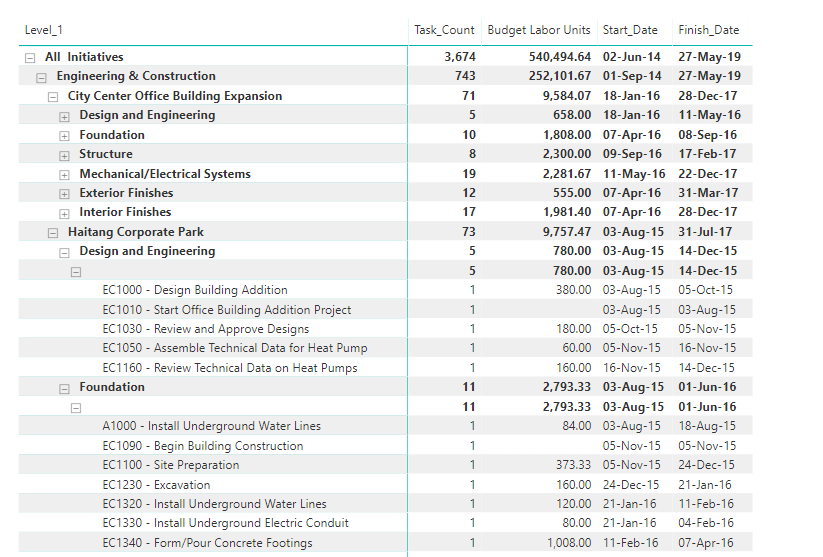
Step 2 – Copy-Paste Resource Assignment Data into Excel

A simply copy-paste from P6 into excel will suffice. It is really that easy. Sometimes the data from P6 may not contain the right descriptions, so this is an opportunity to use some vlookups (or Index(Match()). The data also needs to be presented in a table. Select All and use CNTL-T to convert to a table.

RA_3_excel_table

Step 3 – Unpivot Data using Power Query

This step can be done directly inside PowerBI Desktop, or in perhaps a more flexible excel environment. I prefer to do as much data handling in excel to reduce the complications once inside PowerBI; however, many options exist.

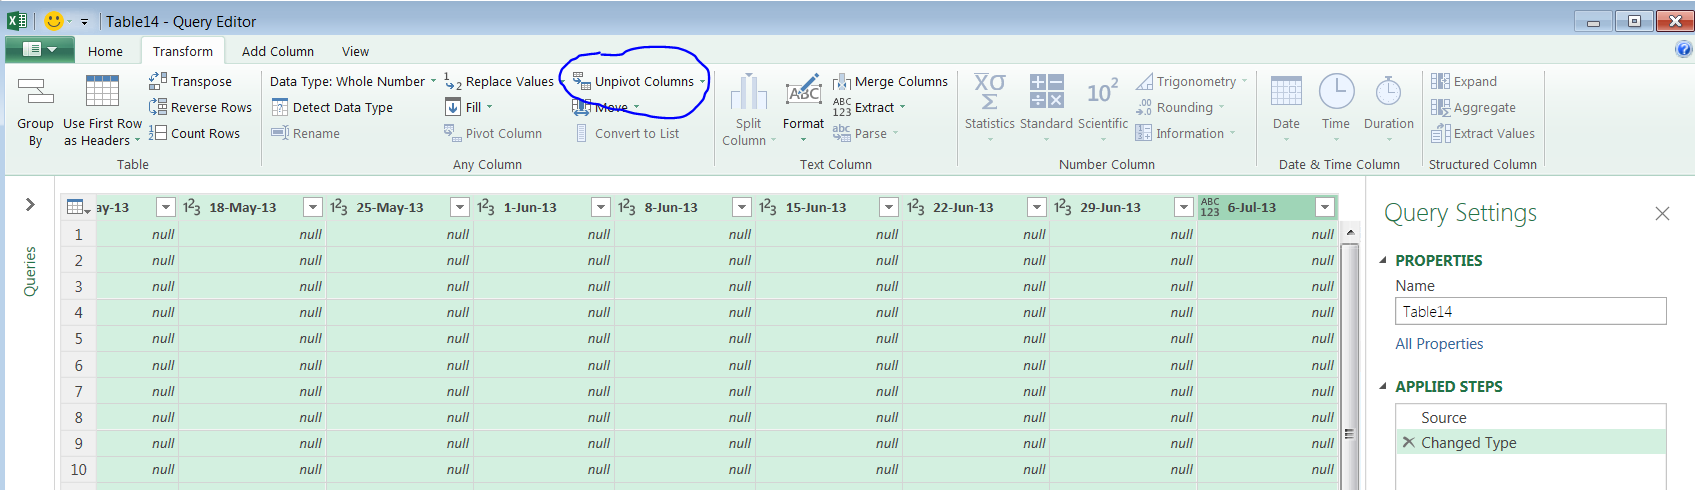
Inside Excel (ensure you have power query add in), select the columns with the dates, and click “UnPinvot Columns”. Close and Exit.

After running the unpivot, you will see each data column turned into a row. This is an easier data format for use in databases and a trick universal not just for powerBI, but anytime you might be dealing with databases.

RA_5_powerq

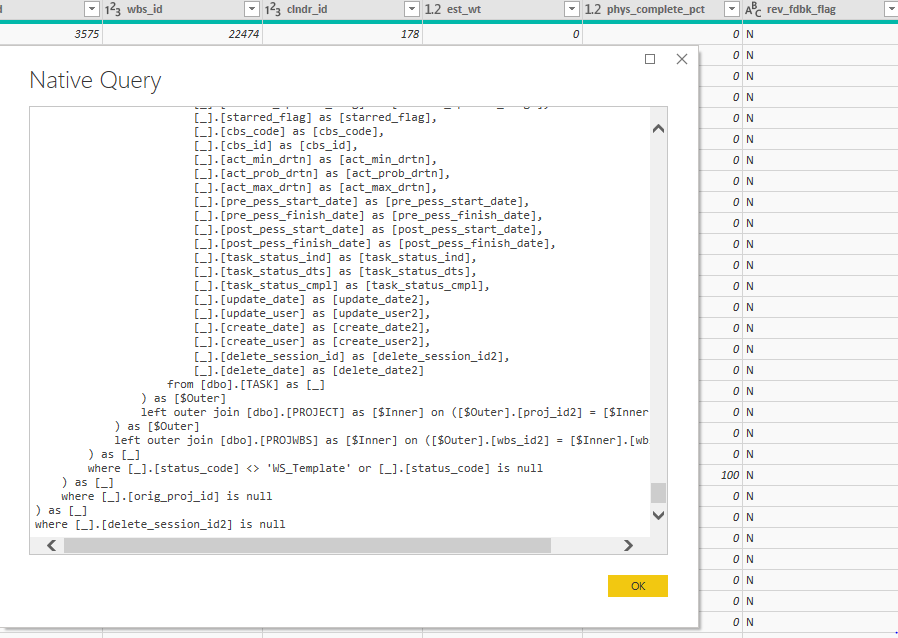
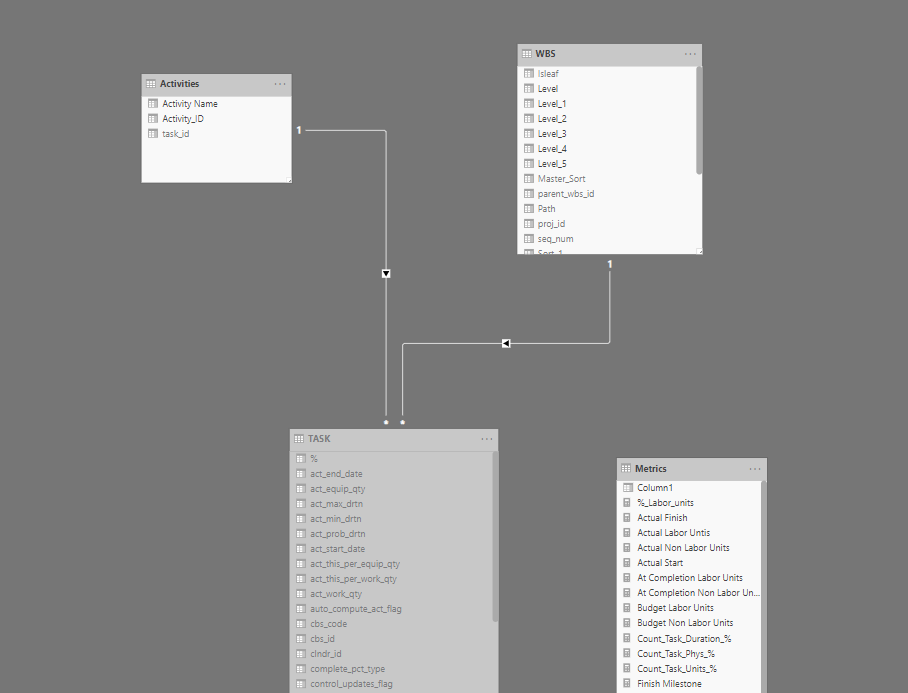
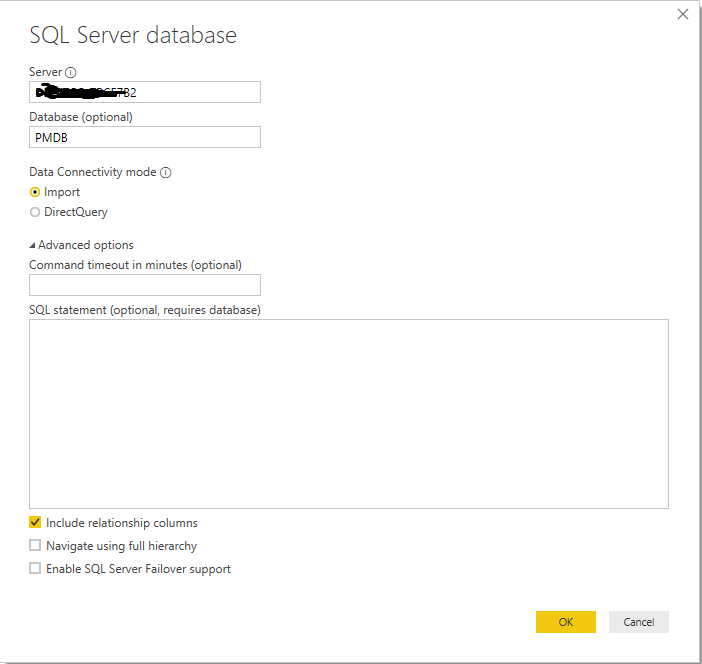
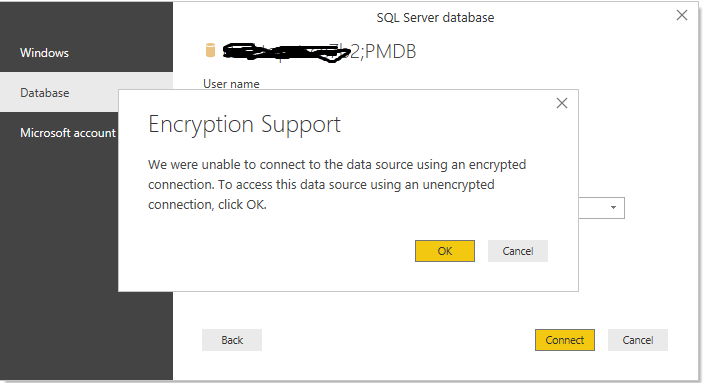
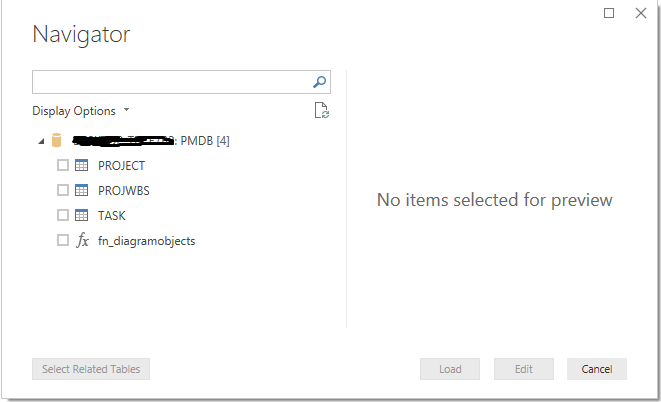
Step 4 – Import Into PowerBI

PowerBI has very quick and easy import routines. This post is not meant to be a specific click by click guide. There are easy import routines you can find to import excel files. Again, as indicated above, just make sure your data is converted into a table. You can directly create a datasource using something similar to the below

=Excel.Workbook(File.Contents(“C:\Users\Name\Downloads\P6_resource_Assignments_HP.xlsx”), null, true)

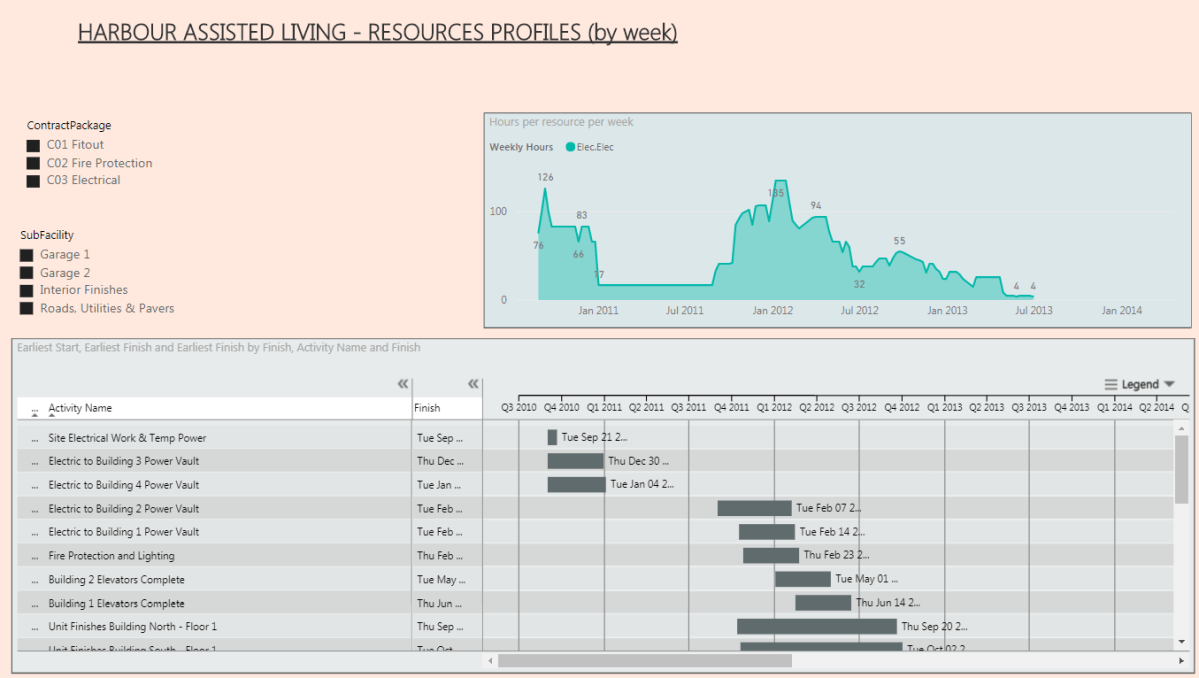
Step 5 – Create your PowerBI Elements : Gantt, Graph, and Slicers

GANTT

The PowerBI file uses a custom visual you can download for free from the marketplace

GANTT by MAQ Software

The parameters you will want to use are roughly as noted below

GRAPH

The PowerBI file use AREA CHART. This is an easy to use built in graph feature of PowerBI. You can use potential extension of line graphs to show a % Complete curve. However, from a base usage, the area chart provides the easiest visual.

A nice trick in the overall dashboard is to align the data range of the GANTT with the GRAPH. I have found some limitations to this exist, but in this example, it worked quite nicely.

SLICER

The real power of this visual is through the use of slicers. Slicers allow for immediate filtering based on a variety of selections. This visuals uses a range of filters for Contract, Facility, SubFacility and ResourceID. Depending on the structure and data you extracted from the P6 resource assignment, your options here are unlimited.

Conclusion

This example just scratches the surface of what is possible. I found the above to be immediately useful to our project team in clearly visualizing the resources required over time. There is some manual effort to keep the source excel updated after changed to P6 – this is not a live linked datasource. There are numerous possible development extension people can use to customize this.

The biggest critique to the dashboard is the lack of visibility into the Baseline dates and plan curves. For this, we can only hope someone builds a more robust custom visual to accommodate this. In the end, happy planning.

RA_1_Final