Expanded tables are a core concept in DAX, Malloy has something similar although with a default behavior:).
To see the difference let’s build the same Model in DAX and Malloy and see where it is the same and where it differ.
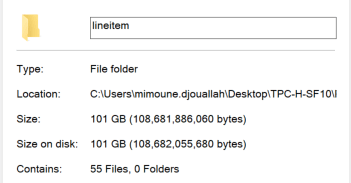
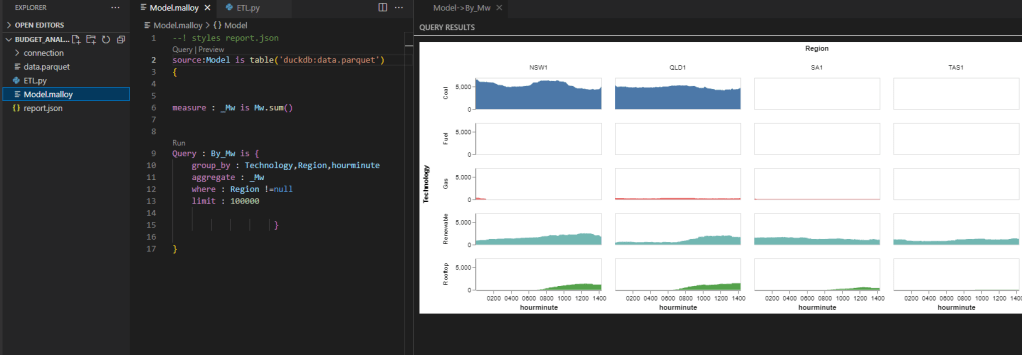
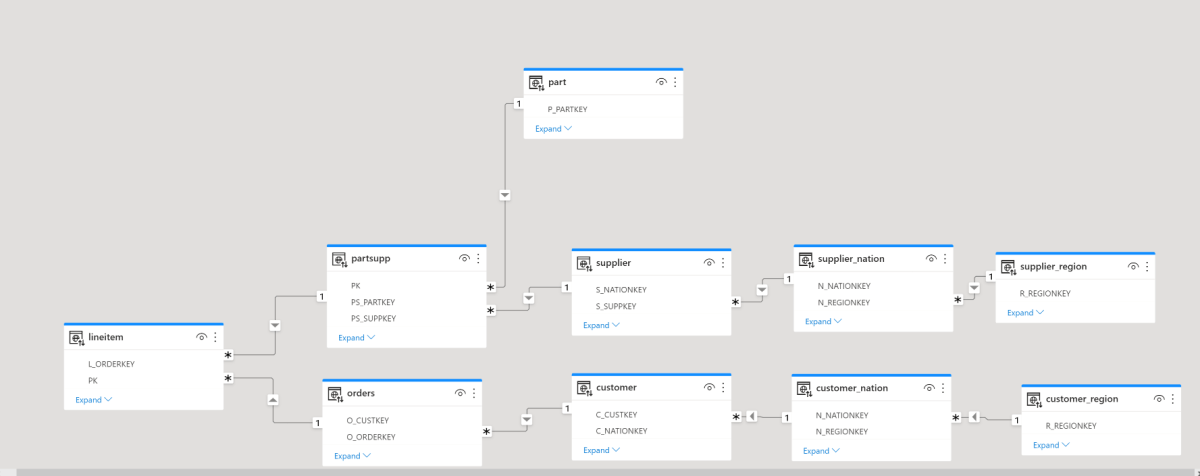
The Model is based on TPC-H Dataset, it is a simple model as it contains only 1 Base Table ” Lineitem”

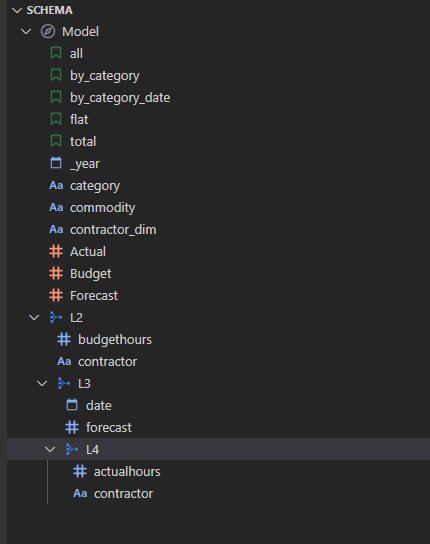
The Same Model using Malloy

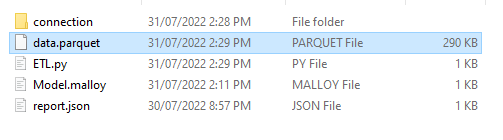
you can download the Malloy here : it is just a text file
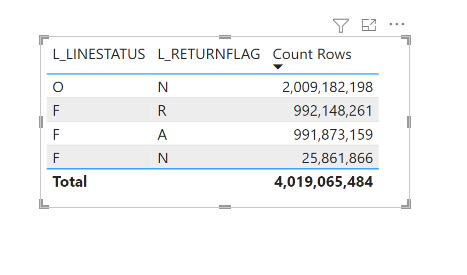
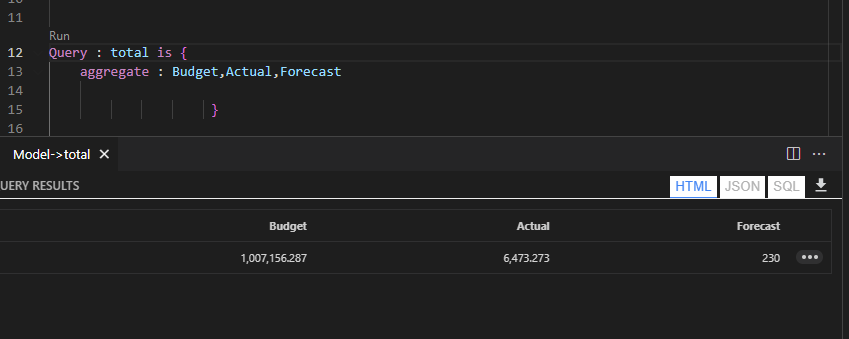
Count the Number of customers
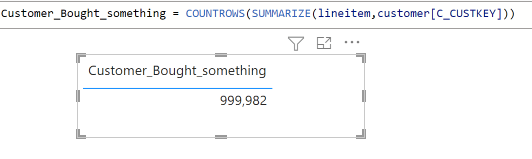
Malloy : results 999 982
Query: custoners_bought_something is {
    aggregate: cnt is count( distinct customer.C_CUSTKEY)
                 }
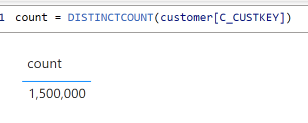
DAX : 1 500 000
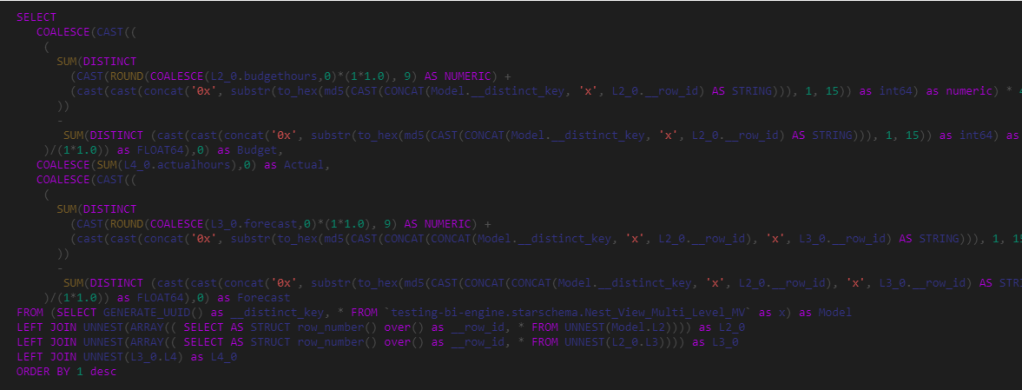
I know the table contains 1.5 M, so why Malloy is giving me wrong results, it turn out , it is by design, Malloy consider only the customers that bought something in lineitem, you can see it from the SQL Generated
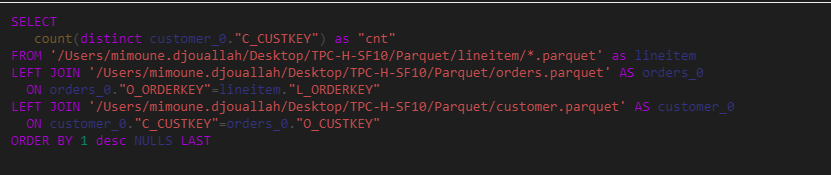
DAX by default ignore the “graph” if the measure target only 1 table, to get the number of customers who bought an item, you need something like this
Take away
Maybe I am biased but I think DAX behavior make more sense, if I target only a table then the graph should be ignored, I think the relationship should be used only when I use fields from different tables.