A complete data pipeline running on Microsoft Fabric that downloads public data, transforms it into a star schema, exports it as Delta Lake tables, and serves it through a Power BI semantic model with Direct Lake — all from a single Python notebook and using pure SQL
all the code is available in github
and Interactive DAG
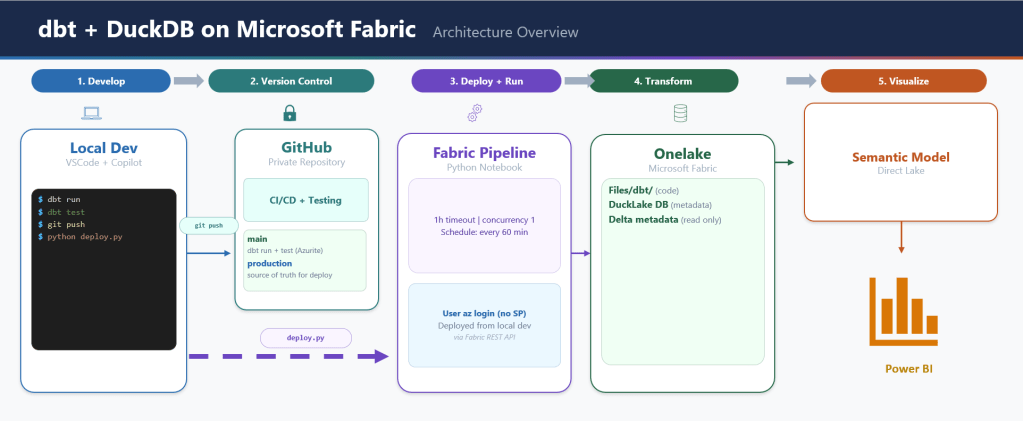
The entire stack:
- One Fabric notebook (2 cells)
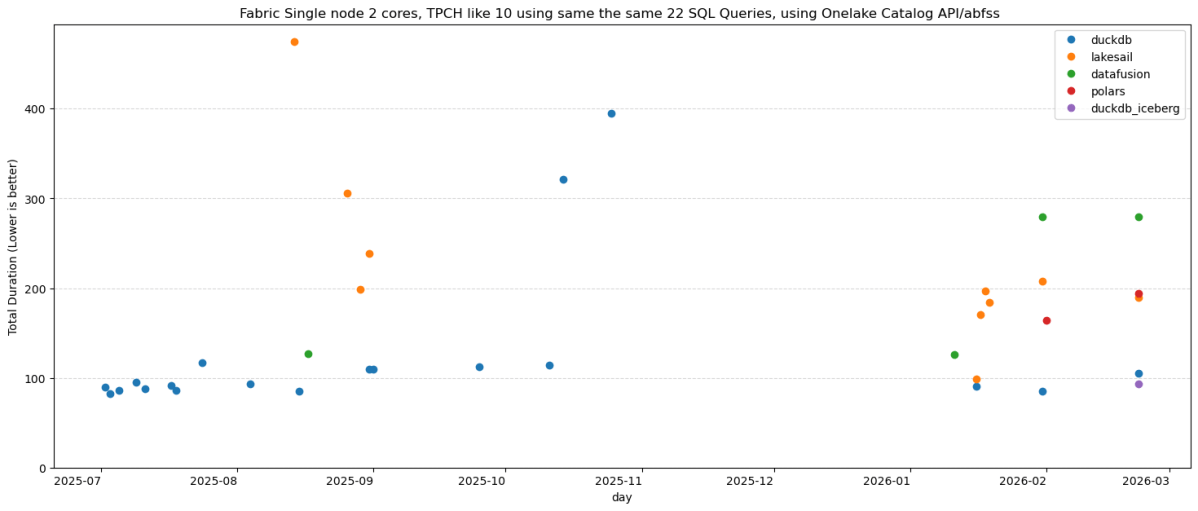
- DuckDB as the compute engine — could have been Polars or Lakesail, just a personal preference to be honest
- dbt as the transformation framework
- A Python script to deploy everything via Fabric REST API
- GitHub for source control, documentation, and testing
Note: DuckDB is not officially supported by Microsoft Fabric. Every effort is made to ensure compatibility with OneLake.
Overall Architecture
Why DuckDB + Delta Export
Microsoft Fabric’s lakehouse uses Delta Lake or Apache Iceberg as its table format. Power BI’s Direct Lake mode reads the data directly from OneLake. So whatever engine you use, you need to produce Delta Lake files on OneLake.
DuckDB cannot write Delta Lake natively (it is experimental at this stage). It has its own table format via the DuckLake extension, but DuckLake writes Parquet files with a DuckDB/SQLite/PostgreSQL metadata catalog.
OneLake catalog has only Iceberg read support, so that’s not an option for now.
The solution: delta_export, a community DuckDB extension that exports DuckLake tables as Delta Lake. The pipeline works like this:
- dbt transforms data into DuckLake tables (Parquet + metadata)
ducklake_rewrite_data_filesandducklake_merge_adjacent_filescompact the Parquet filesCALL delta_export()converts every DuckLake table into a proper Delta Lake table on OneLake
Without delta_export, DuckLake is not useful in this context. DuckLake manages tables internally, but Fabric has no idea what a SQLite metadata catalog is. It needs Delta transaction logs.
From dbt_project.yml:
on-run-end: - "CALL ducklake_rewrite_data_files('ducklake')" - "CALL ducklake_merge_adjacent_files('ducklake')" - "CALL delta_export()"
DuckLake: How It Works and Its Limitations
DuckLake stores table metadata in a database and writes data as Parquet files to any storage backend (local, S3, Azure). The DuckDB connection looks like this:
# profiles.yml (prod target)attach: - path: "ducklake:sqlite:{{ env_var('METADATA_LOCAL_PATH') }}" alias: ducklake options: data_path: "{{ env_var('ROOT_PATH') }}/Tables" data_inlining_row_limit: 0
METADATA_LOCAL_PATH points to /lakehouse/default/Files/metadata.db — the Files section of the OneLake lakehouse. In a Fabric notebook, /lakehouse/default/ is a local mount of the lakehouse storage. The SQLite file lives right there on OneLake, persisting across notebook runs without any special sync logic. data_path points to the Tables section on OneLake (abfss://...). DuckDB computes in memory, DuckLake tracks what’s in each table via SQLite, and Parquet files land on OneLake.
The single-writer limitation. DuckLake when used with a file-based DB is basically a single-writer architecture. Only one process can write to a DuckLake database at a time. This means:
- No parallel pipeline runs
- No concurrent notebooks writing to the same tables
- The Fabric pipeline is set to
concurrency: 1specifically because of this
For this use case, it’s fine — one notebook runs every hour, processes new files, and exits. But if you need concurrent writers, DuckLake is not the right choice.
Obviously you can use PostgreSQL as a catalog, but that makes the architecture more complex.
dbt as the Orchestrator
dbt does everything here — not just transformations. The on-run-start hook downloads data from the web, archives it to OneLake, and tracks state in a parquet log. The on-run-end hook compacts files and exports Delta.
on-run-start: - "CALL ducklake.set_option('rewrite_delete_threshold', 0)" - "CALL ducklake.set_option('target_file_size', '128MB')" - "{{ download() }}"on-run-end: - "CALL ducklake_rewrite_data_files('ducklake')" - "CALL ducklake_merge_adjacent_files('ducklake')" - "CALL delta_export()"
The download() macro (371 lines) handles:
- Fetching daily SCADA and price reports from AEMO’s website
- Fetching intraday 5-minute dispatch data
- Downloading generator reference data
- Archiving everything as partitioned ZIPs on OneLake
- Maintaining a
csv_archive_log.parquetfile for deduplication
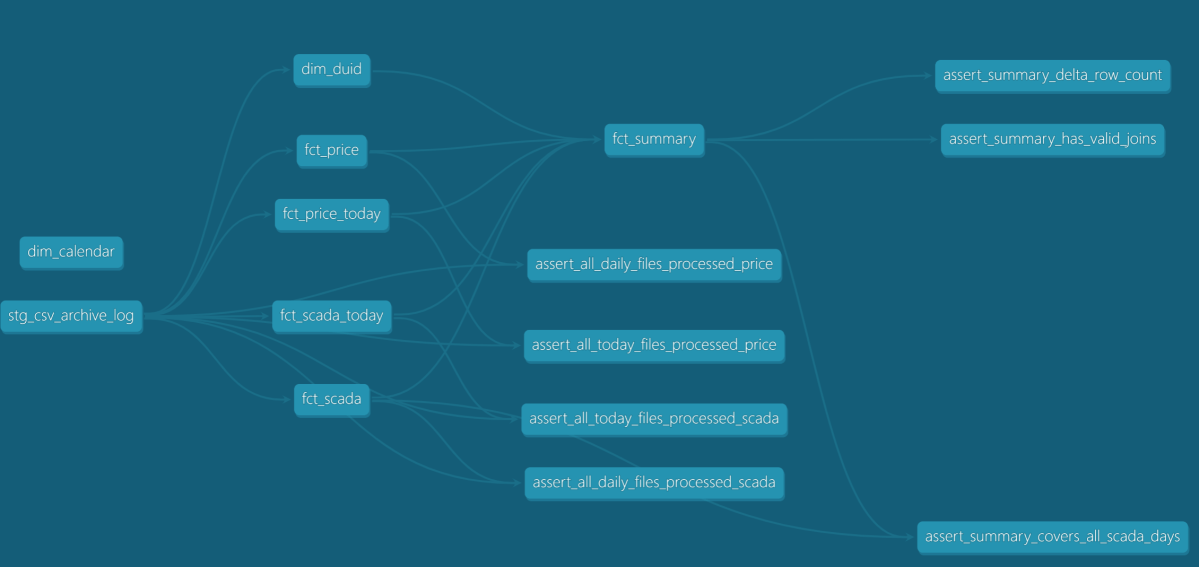
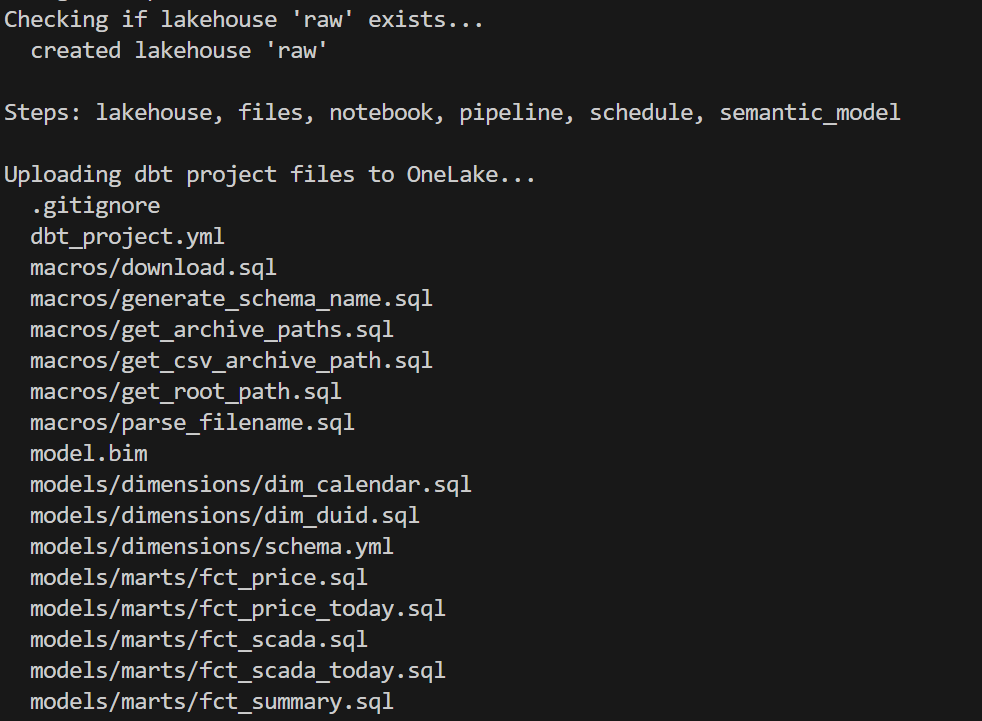
The 8 dbt models then process this data:
- stg_csv_archive_log — view over the archive log
- dim_calendar — date dimension (one-time load)
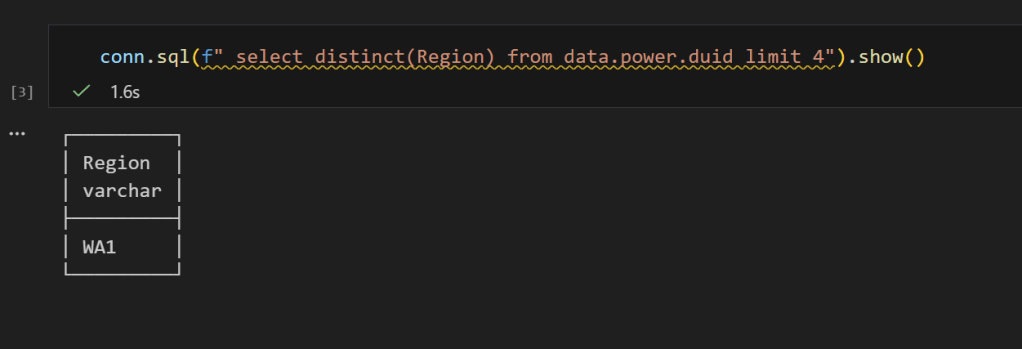
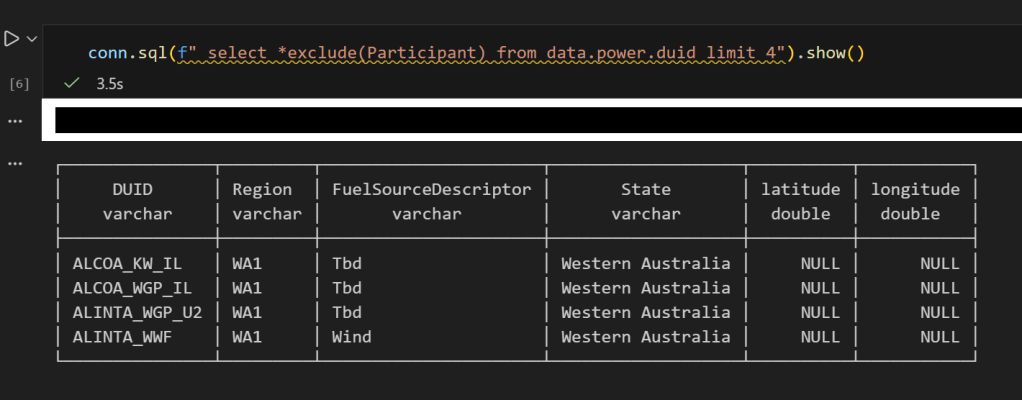
- dim_duid — generator unit reference (smart refresh: only rebuilds when new generators appear)
- fct_scada, fct_price — daily historical data, incremental by file
- fct_scada_today, fct_price_today — intraday data, incremental by file
- fct_summary — combined fact table exposed to Power BI
Every fact model uses file-based incremental processing. Pre-hooks query the archive log, filter out already-processed files, and set DuckDB VARIABLEs with the remaining ZIP paths. The model’s SQL reads from those paths. Next run, those files are skipped.
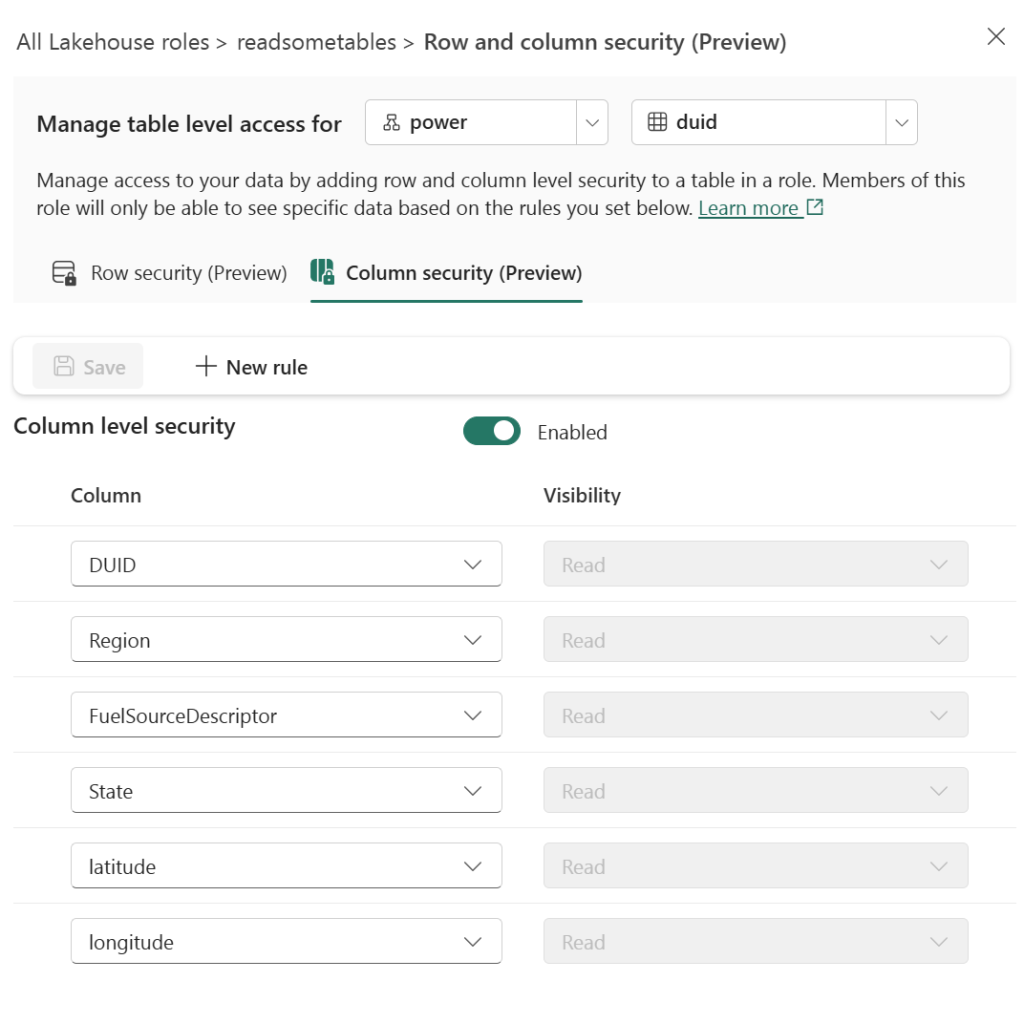
The Semantic Model: AI-Generated from Thin Air
This is the part that surprises me the most. The model.bim file — the Power BI semantic model definition — was generated entirely by AI (Claude). No Power BI Desktop. No click-through wizards. No SSDT.
The model.bim is a JSON file in TMSL (Tabular Model Scripting Language) format. It defines:
- 3 tables exposed to Power BI: dim_calendar, dim_duid, fct_summary
- 5 hidden tables (raw layer, not needed for reporting)
- 2 relationships (fact → dimension)
- 5 DAX measures (Total MW, Total MWh, Avg Price, Generator Count, Latest Update)
- Direct Lake partitions pointing to Delta tables on OneLake
Notice I am using pure Direct Lake mode that does not fall back to SQL:
{ "name": "PBI_ProTooling", "value": "[\"RemoteModeling\", \"DirectLakeOnOneLakeCreatedInDesktop\"]"}
The M expression for the data source:
let Source = AzureStorage.DataLake("{{ONELAKE_URL}}", [HierarchicalNavigation=true])in Source
{{ONELAKE_URL}} is a placeholder. The deploy script substitutes it with the actual OneLake URL at deploy time.
Each table partition maps to a Delta table on OneLake:
{ "mode": "directLake", "source": { "type": "entity", "entityName": "fct_summary", "expressionSource": "DirectLake", "schemaName": "aemo" }}
This maps to Tables/aemo/fct_summary/ — exactly where DuckLake + delta_export writes the Delta files.
AI generated all of this by reading the dbt schema definitions (column names, types, descriptions) and understanding the Direct Lake requirements. No manual TMSL authoring. No reverse engineering from Power BI Desktop. The entire semantic model is version-controlled, diffable, and deployable via API.
Poor Man CI/CD, No Service Principal
deploy_to_fabric.py is a single Python script that deploys everything to Fabric using the REST API. It has 6 steps:
- lakehouse — Create the OneLake lakehouse (with schema support)
- files — Upload all dbt project files to
Files/dbt/ - notebook — Create a 2-cell notebook (install deps + run dbt)
- pipeline — Create a pipeline that runs the notebook
- schedule — Set up hourly cron schedule
- semantic_model — Deploy model.bim with Direct Lake config + refresh
You can run any subset: python deploy_to_fabric.py semantic_model deploys just the BIM.
Authentication uses az login — your browser opens, you sign in, done. The script reads from the production git branch (clones it into a temp directory) so what you deploy is always what’s been merged to production.
python deploy_to_fabric.py # deploy everythingpython deploy_to_fabric.py semantic_model # just the semantic modelpython deploy_to_fabric.py files notebook # just files + notebook
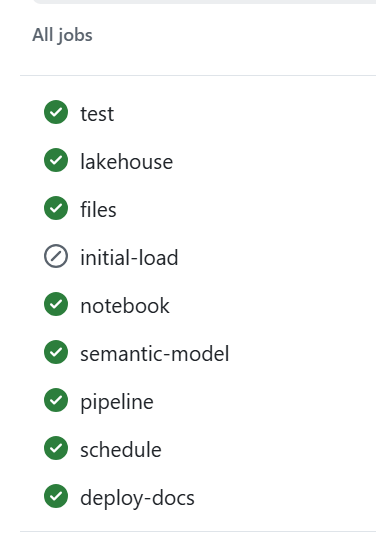
and here is the script in action
CI/CD
assuming you got pass the app registration in Azure, GitHub Actions handles CI — on every push and pull request to production:
Q&A
Why deploy to Fabric from local instead of from GitHub Actions?
CI (testing, docs, DAG) runs in GitHub Actions — no cloud credentials needed, just Azurite. But Fabric deployment requires authenticating to the Fabric REST API, which means a service principal.
This is just my personal experience working in different companies. As a business user, there is almost zero chance IT will give permission to register an app. And even if a miracle happens, you still need to convince a Fabric admin. This is not a technical limitation, it is human behaviour.
Instead, deploy_to_fabric.py uses AzureCliCredential — you run az login, your browser opens, you sign in, done. The script picks up your existing identity. You already have the Fabric permissions. No secrets to store, no service principal to manage.
The tradeoff is that deployment requires a human at a keyboard. For a single-person or small-team project, that’s fine — you deploy when you’re ready, not on every push.
Why not just use Datawarehouse/Spark/Dataflow etc? It’s built into Fabric.
All those tools in Fabric are awesome, but it is a lakehouse and the whole point of a lakehouse is to use whatever you want as long as it produces Parquet and Delta/Iceberg metadata, ideally sorted with a decent row group size from 2M to 16M.
Why DuckLake instead of Delta or Iceberg?
- DuckDB Delta write support is still experimental.
- OneLake Catalog supports Iceberg read only.
If we had Iceberg write, that would be my first preference.
Why is the semantic model AI-generated?
Because it is cool 🙂 and it is unbelievable that AI managed to write it out of thin air and did cool stuff like generating descriptions so Power BI AI behaves better.
What happens if the pipeline fails mid-run?
The DuckLake metadata DB lives on OneLake (Files section). If the run fails mid-way:
- Downloaded source files are already archived on OneLake (no re-download needed)
- DuckLake metadata reflects whatever was committed before the failure
- Next run picks up where it left off using the archive log
The pipeline has a 1-hour timeout. If it hangs, Fabric kills it and the next hourly run starts fresh.
Can this scale?
Python notebooks scale to half a TB of RAM. If you need more, then you are reading the wrong blog 🙂
Where is TMDL?
I could not deploy using TMDL, even after feeding AI all kurt buhler articles 🙂 bim seems to be better undersood at least for now.
Why use SQLite instead of DuckDB to store the metadata DB?
The Files section of OneLake is not a real POSIX filesystem. It is not like your local disk — it basically uses FUSE. All Python engines think it is a real filesystem, but I noticed SQLite works better than DuckDB for this. It flushes data more reliably.
What is skill
In this case, a skill is simply a way to capture what was learned during the work so the AI can reuse that knowledge later.
I wrote the skill after finishing the task, then asked the AI to summarize the key learnings and steps. The idea is that next time the AI runs a similar task, it will be better informed and produce better results.
This is not specific to Claude. The same approach works with Copilot as well. The format is different, but the idea is exactly the same: capture the knowledge once so the AI can reuse it later.
Parting Thoughts
Everything you have heard about AI is pretty much true. The only wrong part was the timing. We all knew about AI’s potential, but in my experience something changed around December 2025. Suddenly AI became genuinely useful — less hallucination, and it just works well enough. Especially when you can test the outcome. And that is the key insight: data engineering is, in a sense, just software engineering. AI writes the code, AI does everything. Your job as a user is to make sure the tests are comprehensive. Contrary to what you hear from professional software engineers, you don’t need to care about the general case. If it is solid enough and it works for your use case, that is all that matters. Nothing more.
There is another aspect worth mentioning. There is a real market for business users who are not programmers. There is enormous value in using your laptop as your main dev and test environment. You open VSCode, you talk to your favorite AI agent, you run dbt run, and you see results in seconds. That feedback loop changes everything. Data platforms like Fabric become a hosting environment with security boundaries, governance, and all that.
and if you are still reading, dbt test are just awesome !!!