Drill Down to Another Page in Google Data Studio

Edit : 28 November 2020, there is an easy way without using parameter

Drill down to another page is a well known technique in BI software, you have a main page with aggregate data, and you can select one category then drill down to another page with more details and keeping the filter selection.

Data Studio does not support this functionality natively but we can simulated using parameter URL

in this example, we will drill down from Country to cities

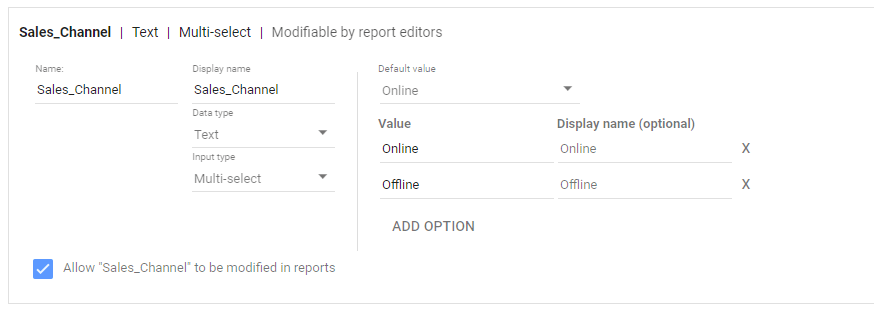
1- Create a country parameter

2- add a new Page

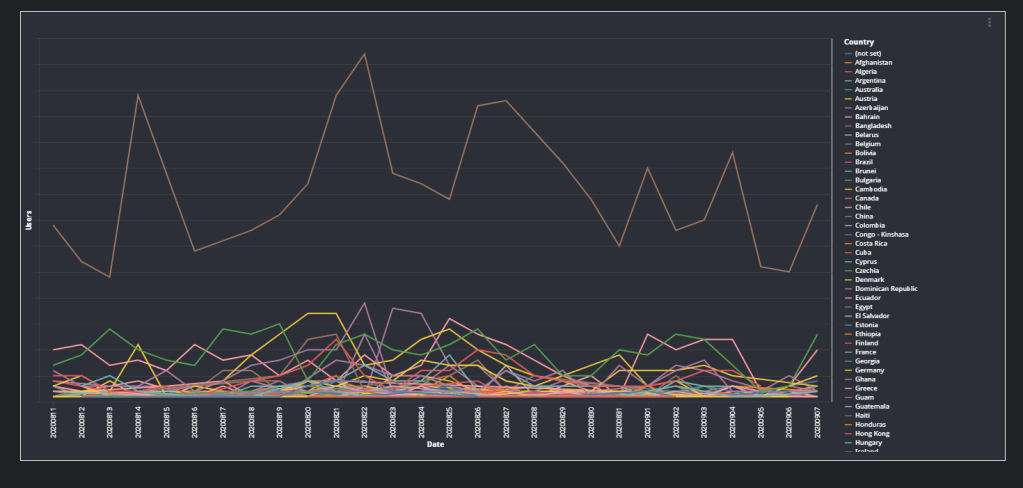
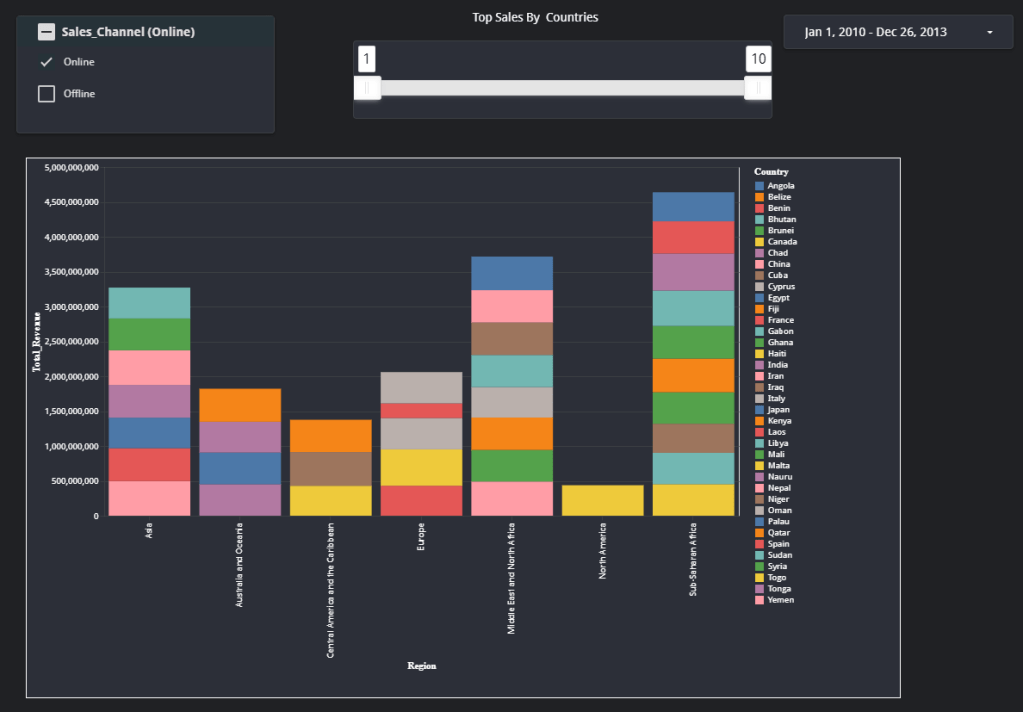
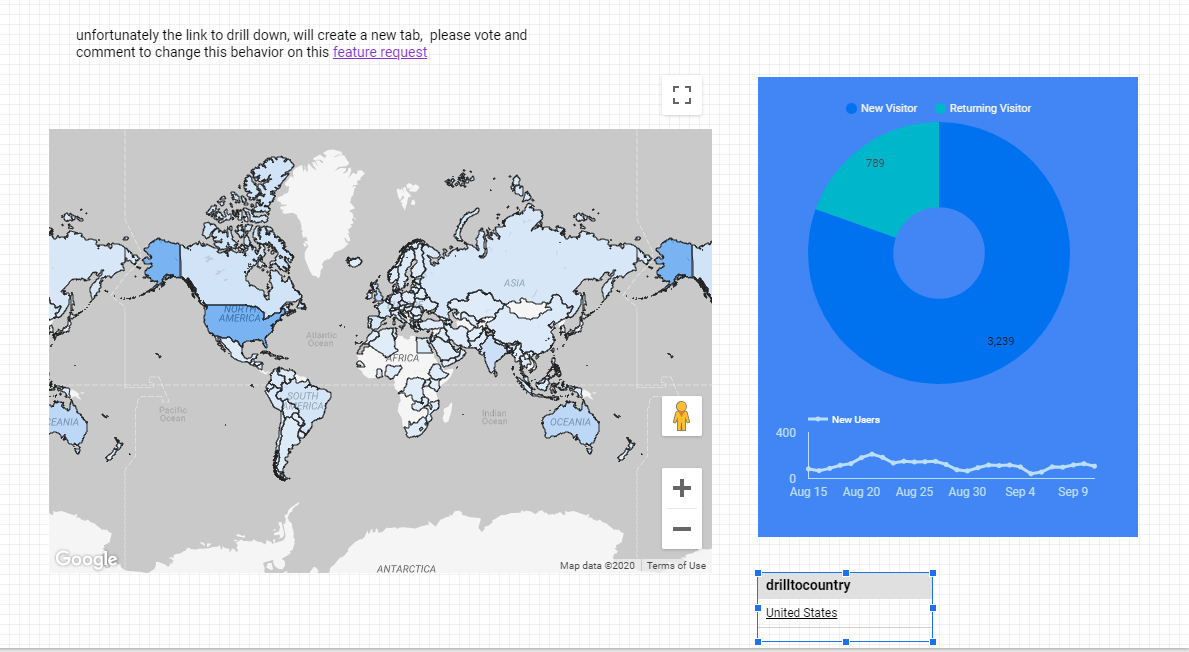
the first report will show data at the country level, like this

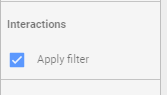
make sure interaction is one

3- Go to Resource, Manage Report URL Parameter

4- Allow to be modified in report URL

tick the option on, you can edit the parameter to remove ds1.drillcountry to drillcountry

5- Build the URL

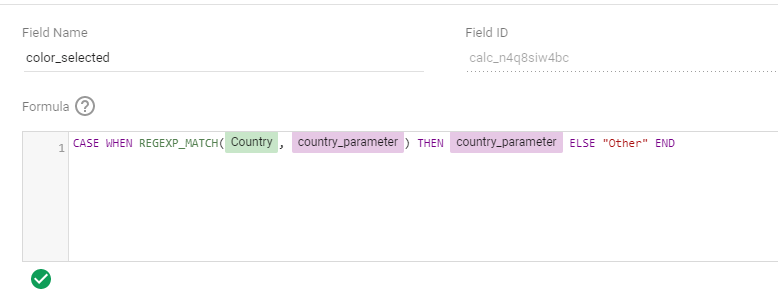
that’s the main part of the post, create a new calculated field using this forumula

hyperlink(CONCAT("https://datastudio.google.com/u/0/reporting/4507ce56-1ad7-4e20-9c53-8f02d5a9a4fe/page/wKRfB?params=%7B%22drillcountry%22:%22",Country,"%22%7D"),Country)

the first part is the second tab URL address , drillcountry is the parameter name as written in step 4, country is the field you are filtering on
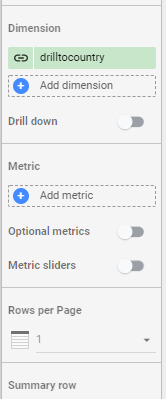
6- create a Table

add this field in a table visual and limit the result to 1 row

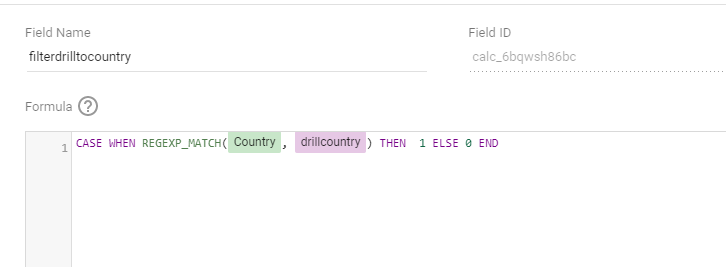
7-Create a second calculated field to filter using parameter

currently you can’t use parameter in visual filter, instead we will use a dummy filter

8-Filter the visual in the second page

and that’s all, unfortunately as of Sept 2020, the URL by default will open a new tab

the report is here

Change the color of one category in a chart

let’s say you have a chart with a lot of categories, for example Google Analytics data per country

now let’s say you want to highlight only one country to see how it compare to the rest, it is possible using parameter

Define your Parameter

as of Sept 2020, you have to manually type the values, hopefully Google Data Studio add the option to get the values from an existing dataset.

Create a new dynamic calculated field

this is the interesting part of the blog, you can compare a dimension to a parameter using REGEX_MATCH 🙂

if you select India for Example, the row for india will return India and anything else will be “Other”

Use custom Viz vega-lite

In google data studio by default the colors match the categories, in our case, we want to keep the level of details “Country”, but use the new field “Color_Selected” for ( wait for it …) colors 🙂

luckily we have Vega/Vega-Lite custom viz.

it is a very powerful viz, literally you can define literaly any complex chart just by writing script the data is automatically mapped when you assign dimension and metrics, here is the script I am using

{
"$schema":"https://vega.github.io/schema/vega-lite/v4.0.2.json",
"mark":"line",
"encoding":{
"detail":{
"type":"nominal",
"field":"$dimension1"
},
"color":{
"type":"nominal",
"field":"$dimension2"
},
"y":{
"type":"quantitative",
"field":"$metric0",
"axis":{
"labels":false
}
},
"x":{
"type":"nominal",
"field":"$dimension0",
"axis":{
"labels":true
}
},
"tooltip":[
{
"type":"nominal",
"field":"$dimension0"
},
{
"type":"nominal",
"field":"$dimension1"
},
{
"type":"quantitative",
"field":"$metric0"
}
]
},
"height":600,
"width":1300
}

and here is the fields used from google analytics

and here is the final results, Link to the report

Top Performing items by category using Google Data Studio SQL Parameter

a very common pattern in Data Analytics is to calculate top performing items by category, for example Top 5 car sales by Brand and Country , now that GDS support SQL Parameter I thought it is a nice opportunity to try it.

I am using a data set that show sales of items by country and geographic region for a hypothetical Company

to get the rank, I am using Row_Number () analytics functions and to make the example a bit more complicated, I presume, the user want to filter by Sales_Channel , Online/Offline or Both

here is the query

WITH
xx AS (
SELECT
Region,
Country,
SUM(Total_Revenue) AS Total_Revenue
FROM
Sales_Summary_rand
WHERE
Sales_Channel IN UNNEST(@Sales_Channel)
GROUP BY
1,
2)
SELECT
*,
ROW_NUMBER() OVER(PARTITION BY Region ORDER BY Total_Revenue DESC) AS rnk
FROM
xx

now you define the parameter ‘@Sales_Channel’, notice you have to type the values manually, for this example there are only two Values, Online/Offline

and here is the report, notice, I am using vega-lite custom viz as the native visual shows only max of 20 categories, the user will have the option to filter the Top 5,10 etc, it is a very powerful visual analytic tool

Unfortunately as of August 2020, BigQuery BI Engines does not support Analytic functions nor UNEST ( which is required for multiple selection of the parameter)

ok, someone may say ( I am looking at you piedatastudio ) that it was possible before and we don’t need parameter, which is true, technically we can show the rank for the three possibilities (Online Sales/Offline Sales, and both) and just use a UNION them add a filter to select the Sale Channel.

now to make it more interesting, let’s say they want to see the top performing based on a date selection, this year, this month etc, very easy using Dates Parameter

WITH
xx AS (
SELECT
Region,
Country,
SUM(Total_Revenue) AS Total_Revenue
FROM
GIS.salesdates
WHERE
Sales_Channel IN UNNEST(@Sales_Channel)
AND Ship_Date >= PARSE_DATE('%Y%m%d',
@DS_START_DATE)
AND Ship_Date <= PARSE_DATE('%Y%m%d',
@DS_END_DATE)
GROUP BY
1,
2)
SELECT
*,
ROW_NUMBER() OVER(PARTITION BY Region ORDER BY Total_Revenue DESC) AS rnk
FROM
xx

in this cases you can not pre calculate the results, as they are thousands of different combination for Date selection.

Please notice, as the Query is not accelerated by BI Engine in Data Studio, the report will incurs BigQuery cost, very negligible for small tables but still 🙂

I added a new report based on Covid19 dataset which is provided for free by Google.

How to calculate percentage of row using Google Data Studio Parameter

TL;DR : Report here

let’s say you work with sales data, and you have being asked to do this analysis

1- Give me sales number by region and Item type

very easy using a pivot table

2- Give me percentage by item and Region

It is very easy using comparison calculation

and here is the report

We Have a problem the percentage is compared to the overall sales, usually we are interested in the ratio of item sold by region !!!

It is a very common request, see this question in the forum

3- Workaround using Blending

One approach is to use blending to calculate the total sales per region then divide by items, see tutorial here , it is fair to say, it is one of the most popular report I built, it seems it is a common pain point

4- I want to see the sales per region and by Country

The workaround using blending is hard coded to one dimension, let’s say region, but usually users want to drill down to multiple level,

I guess you can write a SQL Query to achieve this scenario, but you need to duplicate the data which is something I don’t particularly like !!!

5- Parameter and SQL, you can do anything

we do have parameter now, I am using the same technique as described here

basically, I write a SQL query to calculate the total sales per region and total sales per country, and using filter control , the user can switch to either dimension, as August 2020 BI Engine does not support Sum Over(), I am using self join

WITH
xx AS (
SELECT
region,
Country,
Item_Type,
SUM(Total_Revenue) AS Total_Revenue
FROM
Sales_Summary_randxx
GROUP BY
1,
2,
3)
SELECT
xx.region,
xx.Country,
Item_Type,
Total_Revenue,
Total_Revenue_Region,
Total_Revenue_Country,
CASE
WHEN @details="region" THEN xx.region
ELSE
xx.country
END
AS Level_details,
CASE
WHEN @details="region" THEN Total_Revenue/Total_Revenue_Region
ELSE
Total_Revenue/Total_Revenue_Country
END
AS Percent,
FROM
xx
LEFT JOIN (
SELECT
Region,
SUM(Total_Revenue) AS Total_Revenue_Region
FROM
Sales_Summary_rand
GROUP BY
1) yy
ON
xx.region = yy.region
LEFT JOIN (
SELECT
Country,
SUM(Total_Revenue) AS Total_Revenue_Country
FROM
Sales_Summary_rand
GROUP BY
1) vv
ON
xx.Country = vv.Country

and Voila the final results, notice you can use any number of dimensions