My go to progress dashboard calculates a lot of progress % metrics and graphs. However for larger projects, its often difficult to zoom into the graph. This is exactly why slicers exist
Slicers are not my specialty, actually, PowerBI is not my specialty. So it was with a little frustration in trying to add a slicer to a page to find the slicer altering all my data.
Set The Stage
My go to progress dashboard calculates a lot of progress % metrics and graphs. However for larger projects, its often difficult to zoom into the graph. This is exactly why slicers exist. I am sure there are other nice graph tools that allow for custom date ranges, but again, this is so not my specialty.
What didn’t work
I simply added a slicer on my “weekending” field. However, in doing so, all my measures are now calculating based on the filtered date range. This is likely an issue with my measures, but alas, I wanted something to just adjust the graph axis and not effect anything else
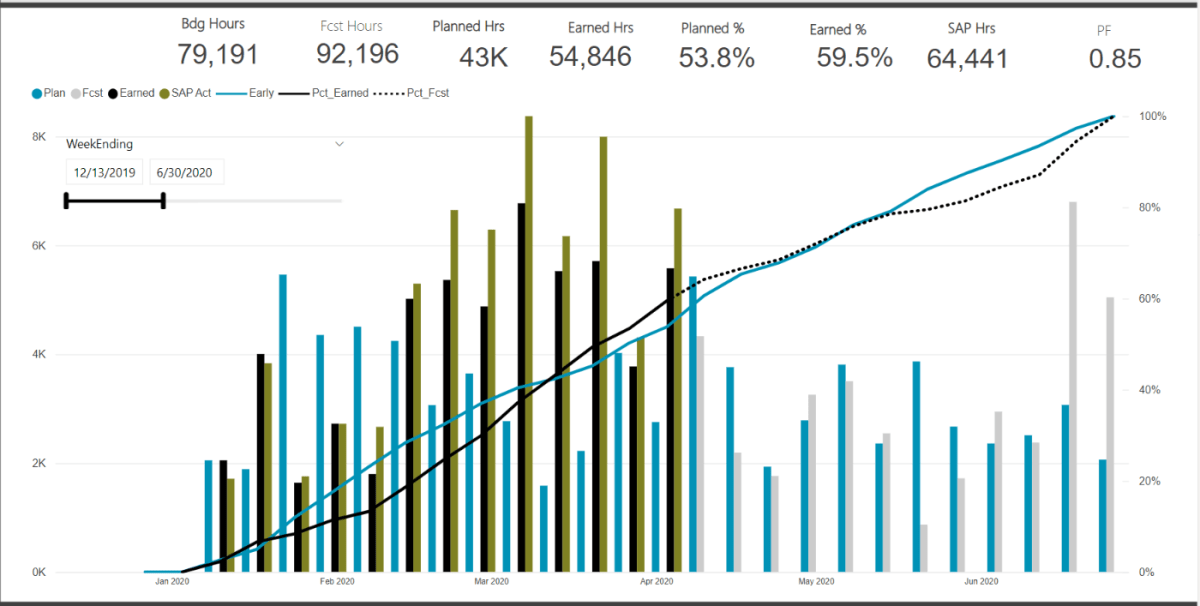
Below we can see that my measure are calculating a progress set from 0-100%. Thus when the date ranges were adjusted, the entire dashboard is now just wrong. My budgets and %’s are also not correct on the cards (which are also based on all the slicers).
The Solution – Create a Duplicate DIM_Date Table
The problem was caused because the slicer was based on the live master dimension table that was linked to my data. Just like I want my graph to adjust based on the adjusted the WBS dimension tables, if I insert a slicer linked in anyway to my FACT table, I am in a world of hurt
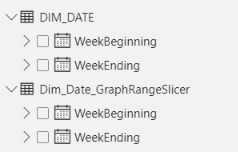
Thus, just create a duplicate DIM_Date table. Here I created a new table: DIM_Date_GraphRangeSlicer
I insert a formula into the chart X-Axis range to select the min and max dates from this new GraphRange table. I then setup a slicer that filters the range for this new table, not the master DIM_Date.
With these new ranges, linked to the dummy date range, I can now much better refine just the X-Axis display of the graph without impacting any of the measures used to calculate the % progress.
The Result
Putting it all together, we can now customize the X-Axis range without altering the measures or cards that are calculating key metrics off the full (or filtered based on the WBS slicers) data.
I blog previously how to create a Materialized View in BigQuery, and Obviously I talk a lot about BI Engine, but do they work together ?
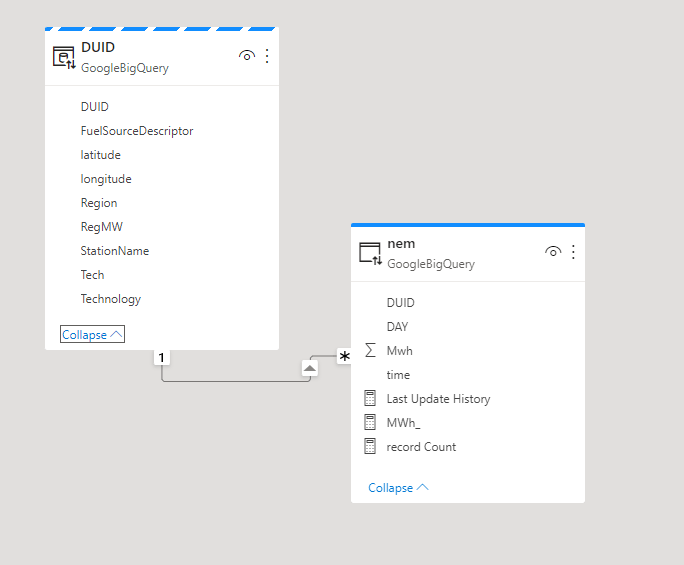
To test it, I built a simple report in PowerBI using live mode ( you can use your favorite BI tool), 1 fact table with 78 Millions records at the minute granularity and a small dimension Table
In every Selection PowerBI send a SQL Query which scan 1.79 GB
Then I created a Materialized View , notice I skipped the time dimension
SELECT
  xx.DUID,
  yy.StationName,
  yy.Region,
  yy.FuelSourceDescriptor,
  yy.Technology,
  yy.latitude,
  yy.longitude,
  yy.Tech,
  DAY,
  SUM(Mwh) AS Mwh
FROM
  `xxxxx.UNITARCHIVE` xx
INNER JOIN
  xxxxx.DUID_DIM yy
ON
  xx.DUID=YY.DUID
GROUP BY
  1,
  2,
  3,
  4,
  5,
  6,
  7,
  8,
  9
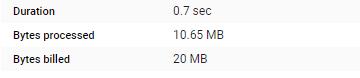
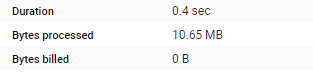
The Same Query will scan only 10 MB, and take 700 ms
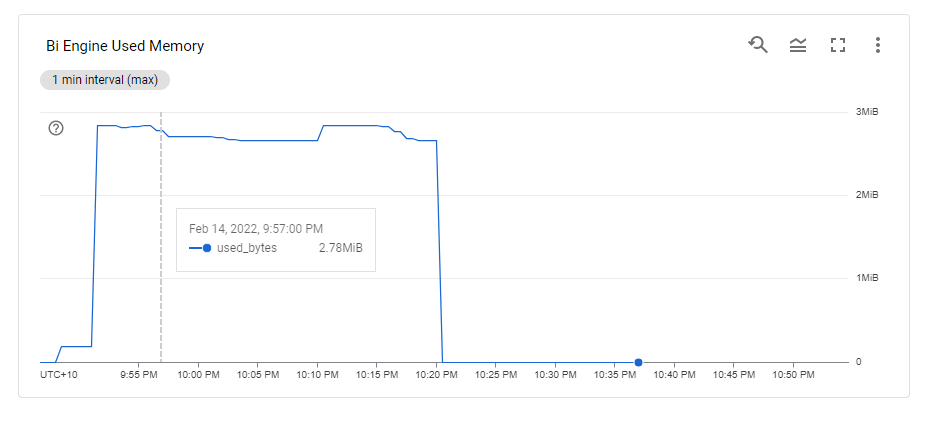
Now let’s add 1 GB of BI Engine Reservation, the duration was reduced from 700 ms to 400 ms
But the nice surprise is this !!! The Memory used is only 2.78 MB
BI Engine was smart enough to load only the Materialized View instead of the Base Table, That’s a better usage of resources and will scale better.
Obviously if you select another column not available in the Materialized View ( like time), BI Engine will load the column Required automatically from the base Table.
Hybrid table is a Clever technical solution to a very fundamental problem in Data Analytics, How to keep Data fresh and at the same time fast, PowerBI , Tableau, Qlik solved this problem by importing data to a local Cache, this solution work for most of the use cases, but as with any solution it has limitation.
If the Data Source is too big, you can’t simply keep importing to the local cache.
If the Data Source change very frequently, like every couple of minutes or second, importing become just not practical or very hard.
PowerBI Engine team came up with a very simple Idea, you can have both Mode in the same table, Historical data that don’t change is cached and today data is queried live as it changed very quickly, Patrick from Guy in the Cube has a great video , Andy has another Video but specific to Synapse Serverless
This functionality was released in the December 2021 edition of PowerBI , but unfortunately when I test it with BigQuery, it did not work, I reported the issue and I have to say, I was really impressed by the Product team, (Kudos to Christian Wade and Krystian Sakowski ), yesterday they released an updated version and it fixed the issue. (it works with Snowflake, Databricks etc)
Setup
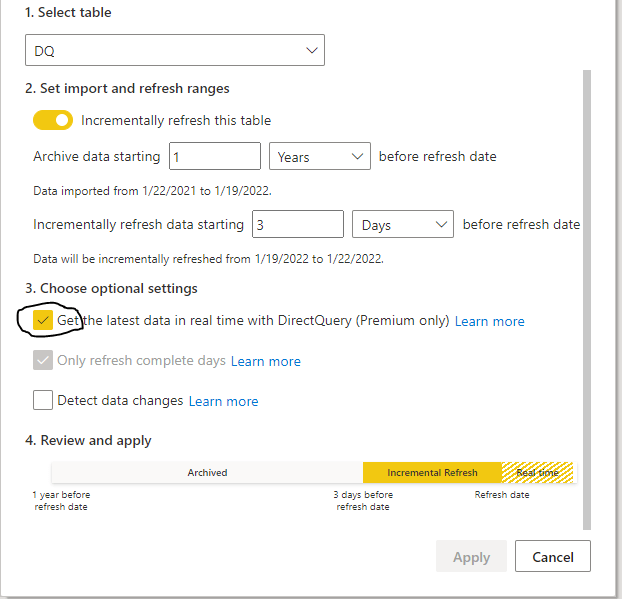
it is literary just an extra box to click compared to the Previous incremental refresh User interface
Yes, Just like that, The Engine will generate table partitions behind the scene, if you want to know why PowerBI is so successful, it is because of stuff like this, take a very hard problem and make it extremely easy for Non Tech people to use.
The Data Model is very simple; one fact table with Data that change every couple of minutes, and a Date dimension in a Mixed mode, ( watch Patrick Video, he explain why)
Premium Only
Yes, it is a premium only feature, and obviously it works with Premium per User, I am not going to complain, someone needs to pay for those R&D cost, but it will be really nice if they release it to the PRO license too, it just feels Odd that a core feature of the Engine is tied to a particular license, we had this situation before with incremental refresh and they did release it even for the free license, I hope the same will happen with Hybrid Table.
Mixed Partitions
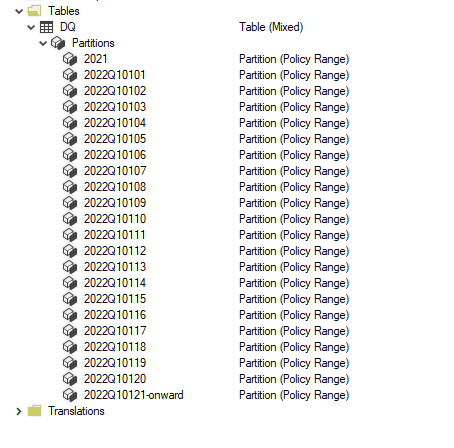
I published the report to the service, and used Tabular Editor to see what’s going on behind the scene (make sure you download the latest version of Tabular Editor, works with the free version too)
As expected the Last Partition is Live Mode, and everything else is cached in PowerBI.
How it Works
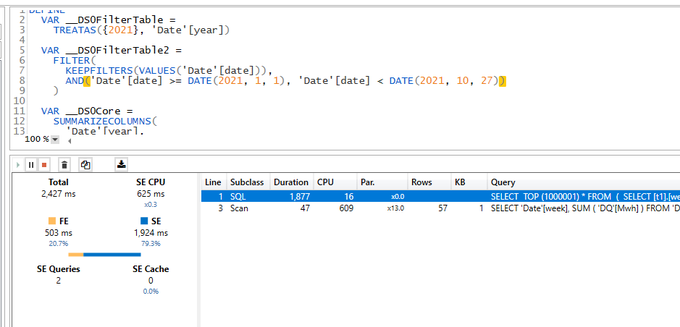
I used DAX Studio to capture what the engine is doing when you run a Query
PowerBI formula engine send two Queries one to the remote DB in my case BigQuery and the local Storage, you can clearly see the difference in speed
1 Day using DQ : 2 second ( the Query take 400 ms at the end point, But BigQuery has a very substandard ODBC driver)
13 Months worth of Data Cached : 47 ms
The Point is, if you can just import, do it, you will get the best performance and user experience
( At Work we have a sub 5 minute pipeline end to end from the Source DB to PowerBI).
The Devil is in the details
As far as I can tell, Formula Engine keep sending two Queries every time, even when the required data is cached already, obviously the Query from the external DB will return null results, in Theory , it should not be a big deal, Modern DW are fast specially with partitioning pruning.
Unfortunately no, only some Database can return a sub second null result set to PowerBI ( yes the Quality of the Driver is as important as the DB Engine itself)
Take Away
It is a very interesting solution worth testing for specific scenarios, but if you can get away with Importing data only, then it is still the best way, yes Hybrid Table reduce the Workload on the remote Database, but still you need a solid Database, getting a sub second Query from end to end is still a hard problem even for 1 day worth of data ( just test it, don’t forget concurrency )
I heard a different use cases, which I find very intriguing, some users want the other way around, recent Data as Import and historical Data as Direct Query, I guess it is useful if you have a real big fact Table.
A Surprising side effect of PowerBI Hybrid table,( maybe it was planned, who knows) Synapse Serverless in Direct Query mode looks now like a very good candidate to use, scanning one day of data is faster and an order of magnitude cheaper !!!
I still Hope that the Vetipaq Engine team surprise us in a future update and somehow let the Formula engine generate only 1 Query when all Data needed is in the Local cache.
Edit : February 2023 , Synapse serverless has substantially improved the Query performance for TPCH-SF10, first run which include calculating the statistics take around 2 minutes, but the second run is around 62 second.
In a previous blog, I did a benchmark for a couple of Database Engine, although it was not a rigorous test, pretty much the results were in the expected range, except for Synapse serverless, I got some weird results, and not sure if it is by design or I am doing something very wrong, so I thought it worth showing the steps I took hoping to find what’s exactly going on. The test was done in January 2022.
First Check : Same region
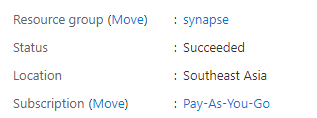
I am using an azure storage in Southeast Asia
My synapse Instance is in the same region
Ok both are in the same region, first best practice.
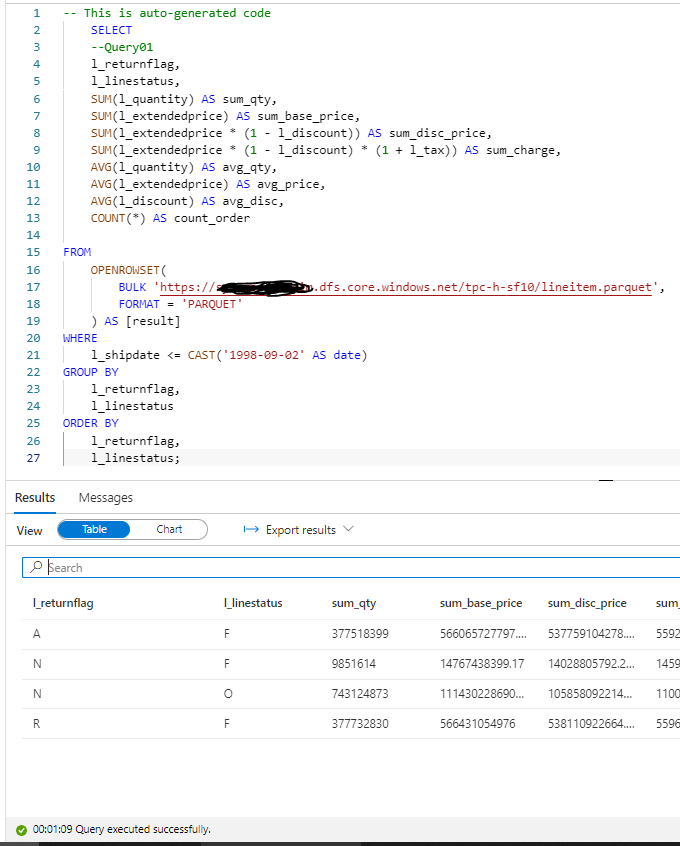
In Synapse, you can directly start querying a file without defining anything, using Openrowset, I thought I can test TPC-H Query 1 as it uses only 1 table, which did not work , some kind of case sensitive issue, when writing this blog I run the same Query and it worked just fine, ( no idea what changed)
1 minute on a second run, hmm not good, let’s try a proper external table , the data_source and File_format were already defined, so need to recreate it again.
ok 2 minute for the first run, let’s try another run which will use statistics, it should be faster, 56 second ( btw, you pay for those statistics too)
Not happy with the results I asked Andy ( Our Synapse expert) and he was kind enough to download and test it, he suggested splitting the file give better performance , he got 16 second.
CETAS to the rescue
Create External Table as Select is a very powerful functionality in Serverless, The code is straightforward
CREATE EXTERNAL TABLE lineitem
	WITH (
	LOCATION = '/lineitem',
	DATA_SOURCE = [xxxx_core_windows_net],
	FILE_FORMAT = [SynapseParquetFormat]
	)
as
SELECT * FROM dbo.lineitem_temp
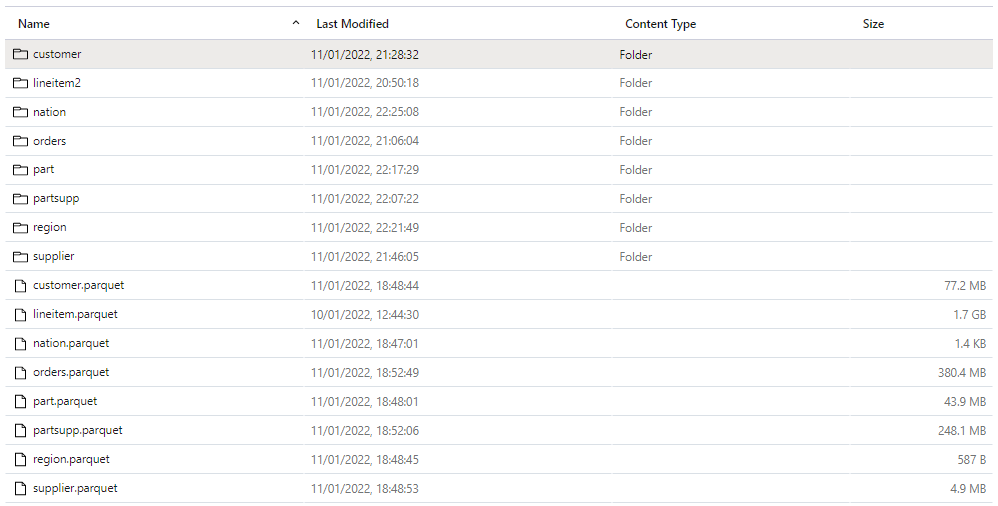
Synapse will create a new table Lineitem with the same data type and a folder that contain multiple parquet files.
That’s all what you can do, you can’t partition the table, you can’t sort the table, but what’s really annoying you can’t delete the table, you have first to delete the table from the database then delete the folder
Not bad at all, 10 second and only 587 MB scanned compared to 50 second and 1.2 GB.
Now that I know that CETAS has better performance, I have done the same for remaning 7 tables.
Define all the tables
First Create an external Table to define the type then a CETAS, Synapse has done a great job guessing the type, I know it is parquet after all, but varchart is annoying by default it is 4000, you have to manually adjust the correct length.
The 22 Queries are saved here, I had to do some change to the SQL, changing limit to Top and extract year from x to Year (x), Query 15 did not run, I asked the Question on Stackoverflow and Wbob kindly answer it very quickly
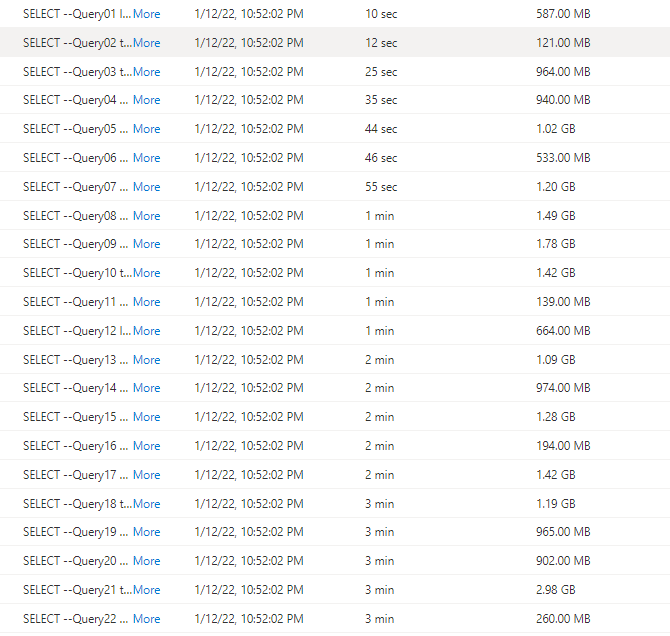
The first run, I find some unexpected results
I thought I was doing something terribly wrong, the Query duration seems to increase substantially, after that I start messing around, what I found is, if you run just one Query at the time, or even 4, the results are fine, more than that, and the performance deteriorate quickly.
I imported the Query History to PowerBI and here is the results
There is no clear indication in the documentation that there is a very strict concurrency limitation, I tried to run the Script in SSMS and it is the same behavior, that seems to me the Engine is adding the Queries to a queue, there is a bottleneck somewhere.
Synapse serverless show the duration between when the Job was submitted until it is completed, there is no way to know the actual Duration of each Query, so basically the Overall Duration is the duration of the Last Query, in our Case Q22, which is around 3 Minutes.
Takeway
The Good news, the product team made it very clear, Synapse Serverless is not an Interactive Query Engine
Realistically speaking, reading from Azure storage will always be slower compared to a local SSD Storage, so no I am not comparing it to other DWH offering, having said that even for exploring files on azure storage, the performance is very problematic.