
Google Data Studio added recently support for BigQuery Geography field, which is a fantastic development and open all kind of new scenarios for creating free to share Maps.
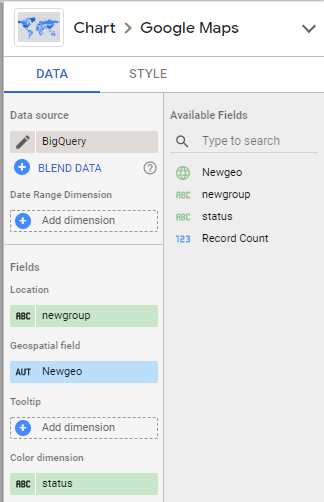
It is straightforward, you just add a geography field and it just render, for example I have this dataset that contains polygons, lines and points
and here is the result
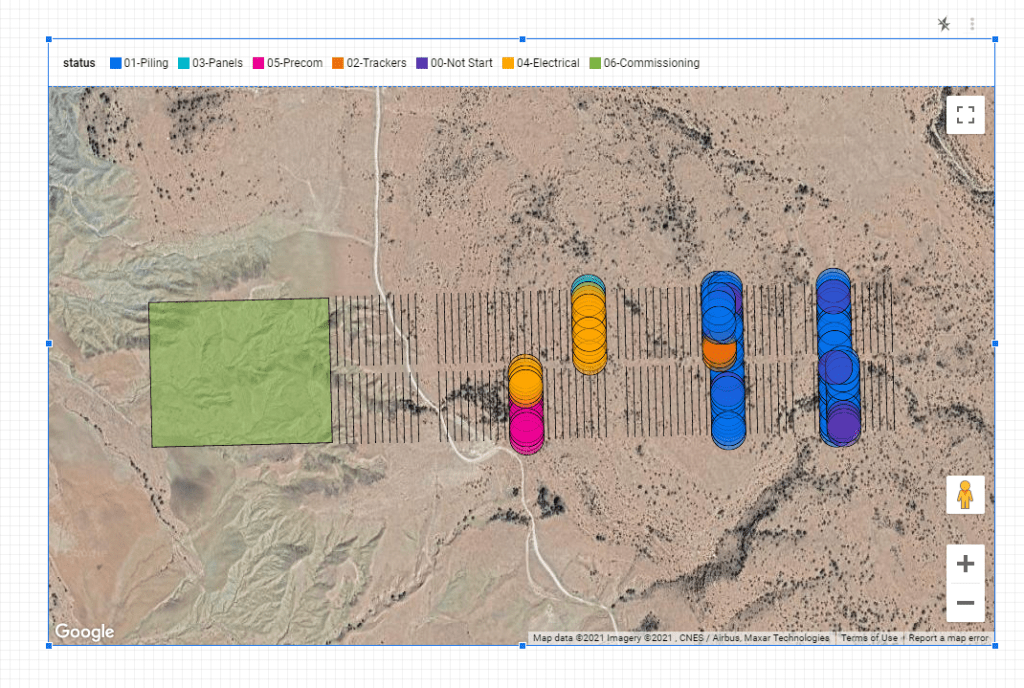
Some Observations
- It seems the initial focus of the dev team was on polygons which are fully supported
- You can’t fill color for lines yet
- Although points support color coding, I could not make them smaller ( The Piles in a Solar Farm are obviously much smaller)
BI Engine to the rescue
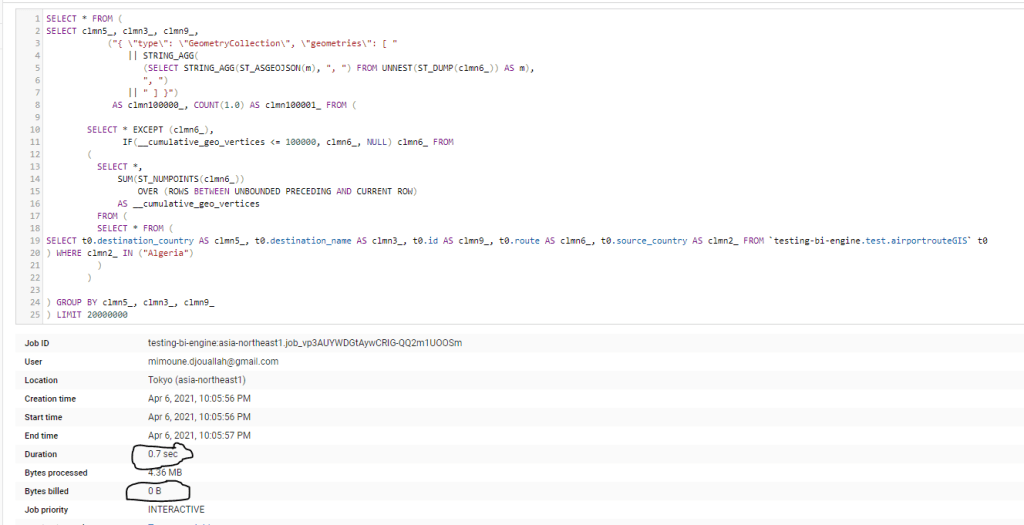
Now the confusing part, BI Engine for Data Studio does not accelerate GEOGRAPHY yet , so you will incur BigQuery Cost, but if you connect the new BI Engine SQL interface, the Query will be accelerated, according to the devs, the BI Engine used in Data Studio is to be considered Version 1 , SQL Interface as the next version and they will be merged together eventually. ( This should be in the Documentation)
here is an example of a Query generated by Data Studio, I would say it is very complex SQL Query with analytical functions, UNNEST, you name it, and the New BI Engine support it just fine ( I really like Bytes billed 0 B)
A more interesting use case
I came across this excellent dataset https://openflights.org/data.html, and thought let’s try it with Data Studio, first I imported the two tables airports.dat and routes.dat then using this SQL Query to generate the routes, which is a line between Source coordinates and Destination Coordinates
WITH
  xxxx AS (
  SELECT
    yy.Name AS source_name,
    yy.City AS source_city,
    yy.Country AS source_country,
    zz.Name AS destination_name,
    zz.City AS destination_city,
    zz.Country AS destination_country,
    DestinationairportID,
    SourceairportID,
    ST_MAKELINE(st_geogpoint(yy.Longitude,
        yy.Latitude),
      st_geogpoint(zz.Longitude,
        zz.Latitude)) AS route
  FROM
    `testing-bi-engine.test.airportroute` xx
  LEFT JOIN
    `testing-bi-engine.test.airport` yy
  ON
    SourceairportID= AirportID
  LEFT JOIN
    `testing-bi-engine.test.airport` zz
  ON
    DestinationairportID = zz.AirportID),
  ttt AS (
  SELECT
    source_name,
    source_city,
    source_country,
    destination_name,
    destination_city,
    destination_country,
    DestinationairportID,
    SourceairportID,
    ST_ASTEXT(route) AS route_wkt
  FROM
    xxxx
  GROUP BY
    1,
    2,
    3,
    4,
    5,
    6,
    6,
    7,
    8,
    9)
SELECT
  *,
  ST_GEOGFROMTEXT(route_wkt) AS route,
  ROW_NUMBER() OVER() AS id
FROM
  ttt
I save the Query in a table, then plotted using Data Studio

and here is the Result, which i share it in Reddit 🙂

I think it is fair to say, people love maps, and a lot of users appreciate that you can download the data straight from Data Studio , you can play with the report here
Really Excellent Works by Data Studio Team.
