
I have been asked to produce a simple construction report, we need to show the last 4 weeks of actual progress data and 6 weeks of forecast and to make thing a little bit complex the average installation since the start of the project, nothing special three measures, average to date, install per week and forecast per week
Obviously, it is trivial to be done in Excel using named sets, if you don’t know what’s named set and cube formula is, you are missing the most powerful reporting paradigm in Excel, a good introduction is here, and there are plenty of resources here.
Unfortunately named set is not supported yet in PowerBI, you can vote here,
Just for demonstration purpose, if you try to add those three measures to a matrix visual, PowerBI just repeat them for every time period, obviously that’s not good at all, the actual installation make sense only in the past and the forecast has to be in the future, there is no option to hide a measure if there is no value in a column and even if it was possible we need to show the average installation independently of the time period, anyway this the report when you add the three measures

and because I already learned a new trick on how to dynamically add measures to a matrix visual in PowerBI, I was tempted to try and see if it works in this scenario.
So, let’s see how it can be done using the disconnected table
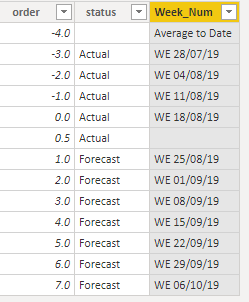
- Create a disconnected table with two columns Order and status

- Add a calculated column,
As the cut-off date change at least three times a week, the week number change accordingly, we can’t simply hard code the dates, instead let’s add a new calculated column, which will just lookup the week date from a master calendar table based on the order, when the order is -4 it will return “average to date”, I added a dummy 0.5 order just to add an empty space between actual and forecast ( cosmetic is important)
Week_Num =
SWITCH (
[order],
-4, “Average to Date”,
0.5, BLANK (),
“WE “
& FORMAT (
LOOKUPVALUE ( MstDates[dynamic Week End], MstDates[week_number], [order] ),
“dd/mm/yy”
)
)
- Add a new measure that show specific measures (Average,Install or forecast) based on the value of column
dynamic_Pivot =
SWITCH (
SELECTEDVALUE(pivot[order],BLANK()),
-4,[Install_qty_average_week],
-3,CALCULATE([Installed_qty],MstDates[week_number]=-3),
-2,CALCULATE([Installed_qty],MstDates[week_number]=-2),
-1,CALCULATE([Installed_qty],MstDates[week_number]=-1),
0,CALCULATE([Installed_qty],MstDates[week_number]=0),
1,CALCULATE([Forecast_Qty],MstDates[week_number]=1),
2,CALCULATE([Forecast_Qty],MstDates[week_number]=2),
3,CALCULATE([Forecast_Qty],MstDates[week_number]=3),
4,CALCULATE([Forecast_Qty],MstDates[week_number]=4),
5,CALCULATE([Forecast_Qty],MstDates[week_number]=5),
6,CALCULATE([Forecast_Qty],MstDates[week_number]=6),
7,CALCULATE([Forecast_Qty],MstDates[week_number]=7))
And voila an asymmetrical matrix visual in all its glory 😊

Edit 3-Sept-2019 : Maxim in the comment made an excellent suggestion to use variable to make the measure more manageable
dynamic_Pivot=
VAR _order =
SELECTEDVALUE ( pivot[order], BLANK () )
RETURN
IF (
_order = -4,
[Install_qty_average_week],
IF (
_order <= 0,
CALCULATE ( [Installed_qty], MstDates[week_number] = _order ),
IF ( _order > 0, CALCULATE ( [Forecast_Qty], MstDates[week_number] = _order ) )
)
)

Hi Mim,
I think you can shorten the last measure with this trick:
dynamic_Pivot =
VAR _order =
SELECTEDVALUE ( pivot[order], BLANK () )
RETURN
SWITCH (
_order,
-4, [Install_qty_average_week],
0.5, BLANK (),
CALCULATE ( [Installed_qty], MstDates[week_number] = _order )
)
it looks more readable and manageable 🙂
Cheers,
Maxim
LikeLiked by 1 person
Maxim, thanks make sense
LikeLike