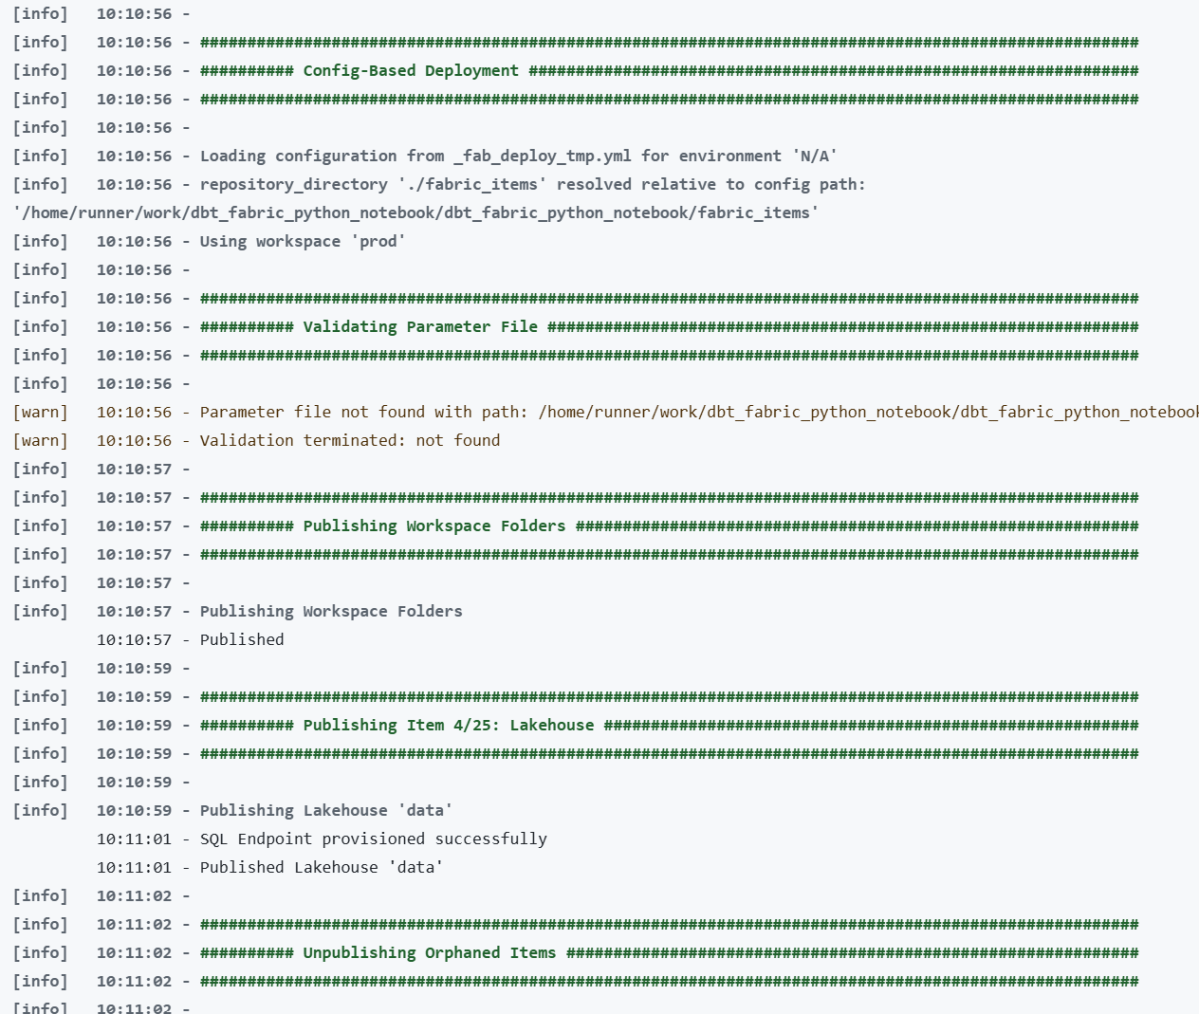
Microsoft Fabric now has a proper CLI deploy, and it works. I built a fully automated CI/CD pipeline that deploys a Python notebook, Lakehouse, Semantic Model, and Data Pipeline to Fabric using nothing but the fab CLI and GitHub Actions. Here’s what I learned along the way , what works great, what to watch out for, and where a few small additions could make the experience even better.
The full source code is available on GitHub: djouallah/dbt_fabric_python_notebook.
The Blog and the code was written by AI, to be clear, Fabric had always excellent API. and I perosnally used adhoc pythion script to deploy, but this time, it feels more natural
maybe the main take away when working with Agent and writing python code, logs everything including API response specially at the begining, AI is very good at autocorrecting !!!
The Goal
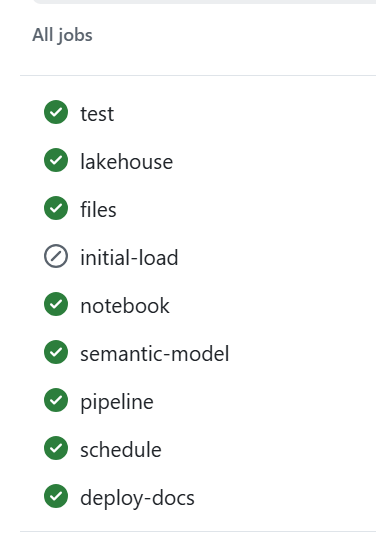
Push to main or production, and everything deploys automatically:
- A Lakehouse gets created (with schemas enabled)
- A Python Notebook gets deployed and attached to the Lakehouse (dbt need local path)
- The notebook’s supporting files get copied to OneLake
- The notebook runs — transforming data and creating Delta tables
- A Direct Lake Semantic Model gets deployed (pointing at those Delta tables)
- A Data Pipeline gets deployed and scheduled on a cron
No portal clicks. No manual steps. Just git push.
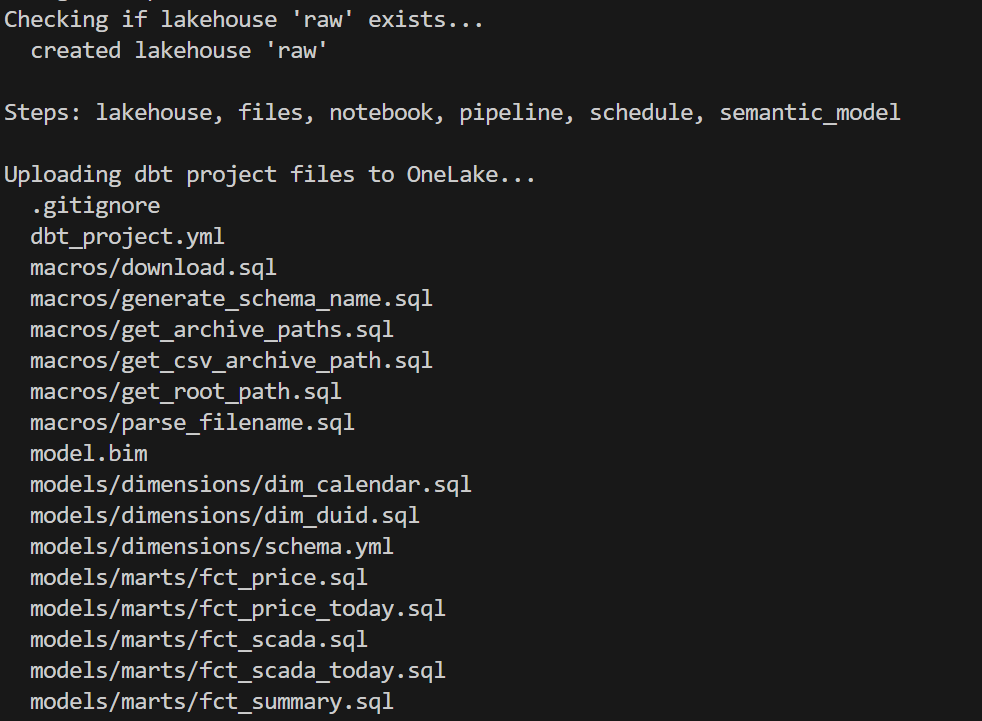
Project Structure
├── deploy.py # Orchestrates the entire deploy├── deploy_config.yml # Per-environment config (workspace IDs, schedules)├── fabric_items/│ ├── data.Lakehouse/ # Lakehouse definition│ ├── run.Notebook/ # Python notebook (.ipynb)│ ├── aemo_electricity.SemanticModel/ # Direct Lake model│ └── run_pipeline.DataPipeline/ # Scheduled pipeline├── dbt/ # Data transformation project└── .github/workflows/ ├── ci.yml # Tests on every push └── deploy.yml # Deploys to Fabric
Each Fabric item lives in a folder named {displayName}.{ItemType} under fabric_items/. The deploy script discovers them dynamically — no hardcoded item names.
What Works Well
The fab deploy command is brand new — v1.5.0, March 12, 2026. For a tool that just shipped, two things stood out.
Native .ipynb Support for Notebooks
Fabric’s default Git format for notebooks is notebook-content.py — a custom FabricGitSource format that flattens your notebook into a single .py file with metadata comments. It’s fine for Git diffs, but you lose the cell structure, can’t preview outputs, and can’t use standard Jupyter tooling to edit it.
As of Fabric CLI v1.4.0 (February 2026), you can now deploy notebooks as standard .ipynb files. Before v1.4.0, the CLI only supported the .py format.
With .ipynb support, what you see in VS Code or Jupyter is exactly what gets deployed:
fabric_items/ run.Notebook/ .platform notebook-content.ipynb # standard Jupyter format, deployed as-is
You can edit notebooks locally with proper cell boundaries, use Jupyter tooling, and the deploy just works. Notebooks are finally first-class citizens in the deployment story.
model.bim Is Beautifully Simple
Fabric supports two formats for Semantic Models: TMDL (a folder of .tmdl files, one per table — the default) and TMSL (a single model.bim JSON file). TMDL is better for Git diffs on large models. But for my use case, model.bim is perfect.
One file. Everything in it — tables, columns, measures, relationships, and the Direct Lake connection. The entire environment-specific configuration boils down to a single OneLake URL:
https://onelake.dfs.fabric.microsoft.com/{workspace_id}/{lakehouse_id}
Two GUIDs. That’s it. Swapping environments is a two-line string replacement:
bim_path.write_text( bim_text.replace(source_ws_id, WS_ID) .replace(source_lh_id, target_lh_id))
Compare this to the pipeline, where you’re hunting through deeply nested JSON paths with fab set. The BIM format is refreshingly straightforward.
The deploy works perfectly with just Python string replacement — three lines of code and a git checkout to restore.
TMSL (model.bim) vs TMDL: Which Format for CI/CD?
Fabric supports two formats for Semantic Models, and this choice matters more than it might seem.
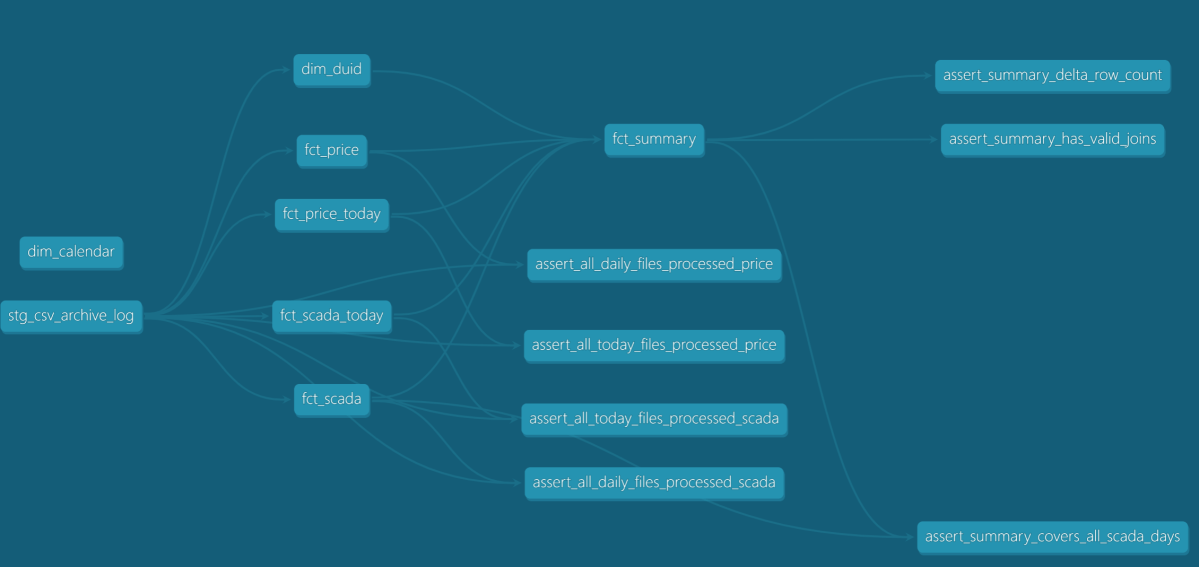
TMDL is the default. It splits your model into a folder of .tmdl files — one per table, plus separate files for relationships, the model definition, and the database config:
definition/├── tables/│ ├── dim_calendar.tmdl│ ├── dim_duid.tmdl│ └── fct_summary.tmdl├── relationships.tmdl├── model.tmdl└── database.tmdl
TMSL is a single model.bim JSON file with everything in it.
For CI/CD pipelines, TMSL wins hands down. Here’s why:
- One file to manage. Your deploy script reads one file, replaces two GUIDs, deploys, and runs
git checkoutto restore. With TMDL, you’d need to find which.tmdlfile contains the OneLake URL and handle multiple files. - Two
.replace()calls. The entire environment swap is two string replacements on one file. With TMDL, the connection expression lives inmodel.tmdl, but table definitions reference it indirectly — more files to reason about during deployment. - Easier to grep and debug. When something goes wrong with your Direct Lake connection, you open one file, search for the OneLake URL, and see everything. No jumping between files.
When TMDL makes more sense:
- Large models with dozens of tables where multiple people edit measures and columns — per-file Git diffs are cleaner and merge conflicts are smaller
- Teams using Tabular Editor who need reviewable PRs on individual table changes
- Models that change frequently at the table level
But if your semantic model is authored once and deployed across environments — which is the typical CI/CD pattern — you’re not reviewing table-level diffs. You’re swapping two GUIDs and pushing. TMSL keeps it simple.
I chose model.bim and haven’t looked back.
Things to Know Before You Start
Lesson 1: Deploy Order Matters — A Lot
This was my biggest source of failed deployments. Fabric items have implicit dependencies, and deploying them out of order causes cryptic failures.
The correct sequence:
Lakehouse → Notebook → (run notebook) → Semantic Model → Data Pipeline
Why this specific order:
- The Notebook needs a Lakehouse to attach to. If the Lakehouse doesn’t exist yet, the attachment step fails.
- The Semantic Model uses Direct Lake mode, which validates that the Delta tables it references actually exist. If you deploy the model before running the notebook that creates those tables, validation fails.
- The Data Pipeline references the Notebook by ID. You need the Notebook deployed first to get its target workspace ID.
I ended up with a strict 7-phase deploy script:
# 1. Create/verify Lakehouse (with schemas enabled)# 2a. Deploy Lakehouse# 2b. Deploy Notebook# 2c. Attach Lakehouse to Notebook via fab set# 3. Copy supporting files to OneLake# 4. Run the Notebook (blocks until complete)# 5. Deploy Semantic Model (Delta tables now exist)# 6. Refresh Semantic Model via Power BI API# 7. Deploy + schedule Data Pipeline
Lesson 2: fab job run Does Nothing for Notebooks Without -i '{}'
This one cost me hours of debugging. Running a notebook via the CLI:
# Does NOTHING — silently succeeds but notebook never executesfab job run prod.Workspace/run.Notebook# Actually runs the notebookfab job run prod.Workspace/run.Notebook -i '{}'
Notebooks require the -i '{}' flag (empty JSON input). Without it, the command returns success but the notebook never fires. There’s no error, no warning — it just silently does nothing.
Lesson 3: parameter.yml Token Replacement Is Surprisingly Limited
Fabric CLI has a parameter.yml mechanism for replacing GUIDs across environments. The idea is great — use tokens like $workspace.id and $items.Lakehouse.data.$id that get resolved at deploy time.
In practice, the rules are strict and poorly documented:
Tokens only resolve if the entire value starts with $
# WRONG — token is embedded in a URL, never resolvesreplace_value: _ALL_: "https://onelake.dfs.fabric.microsoft.com/$workspace.id/$items.Lakehouse.data.$id/"# CORRECT — each token must be its own replacement entry- find_value: "e446a5e7-..." replace_value: _ALL_: "$workspace.id"
The $items token format is strict
$items.Lakehouse.data.$id # correct: $items.{type}.{name}.$attribute$items.data.$id # WRONG: "Invalid $items variable syntax"
is_regex must be a string, not a boolean
is_regex: "true" # correctis_regex: true # WRONG — Fabric CLI rejects with "not of type string"
My solution: skip parameter.yml entirely
I found it simpler and more transparent to do GUID replacement directly in Python:
# Read the source file, find dev GUIDs, replace with target GUIDsbim_text = bim_path.read_text()bim_path.write_text( bim_text.replace(source_ws_id, WS_ID) .replace(source_lh_id, target_lh_id))# Deploy with the modified filefab_deploy(["SemanticModel"])# Restore original for clean git statesubprocess.run(["git", "checkout", str(bim_path)])
The pattern: modify → deploy → git restore. No token resolution needed.
Lesson 4: item_types_in_scope Must Be Plural
The deploy config YAML key is item_types_in_scope (plural). Use the singular item_type_in_scope and Fabric CLI silently ignores it — deploying everything in your repository directory instead of just the types you specified.
# CORRECTitem_types_in_scope: - Notebook - Lakehouse# WRONG — silently deploys ALL item typesitem_type_in_scope: - Notebook
This is the kind of bug that only shows up in production when your Semantic Model gets deployed before your Delta tables exist.
Lesson 5: New Lakehouses Need a Provisioning Wait
Creating a Lakehouse returns immediately, but the underlying infrastructure isn’t ready yet:
result = subprocess.run(["fab", "create", LAKEHOUSE, "-P", "enableSchemas=true"])if result.returncode == 0: # Brand new lakehouse — need to wait for provisioning print("Waiting 60s for provisioning...") time.sleep(60)
On first deploy to a new workspace, this 60-second wait is essential. Without it, subsequent operations (deploying items, copying files) fail with opaque errors.
Lesson 6: Attaching a Lakehouse to a Notebook Requires fab set
Deploying a notebook doesn’t automatically connect it to a Lakehouse. You need a separate fab set call:
lakehouse_payload = json.dumps({ "known_lakehouses": [{"id": target_lh_id}], "default_lakehouse": target_lh_id, "default_lakehouse_name": "data", "default_lakehouse_workspace_id": WS_ID,})fab(["set", NOTEBOOK, "-q", "definition.parts[0].payload.metadata.dependencies.lakehouse", "-i", lakehouse_payload, "-f"])
The JSON path is deeply nested and not well documented. I had to inspect the API responses to find the correct path: definition.parts[0].payload.metadata.dependencies.lakehouse.
Lesson 7: Semantic Model Refresh Uses the Power BI API, Not the Fabric API
After deploying a Direct Lake semantic model, you need to trigger a refresh. But this isn’t a Fabric API call — it’s a Power BI API call:
# Note the -A powerbi flag — this targets the Power BI API endpointfab api -A powerbi -X post "groups/{workspace_id}/datasets/{model_id}/refreshes"
Without the -A powerbi flag, you’ll get 404s because the Fabric API doesn’t have a refresh endpoint for semantic models.
Lesson 8: Pipeline References Are Hardcoded GUIDs
A Data Pipeline that runs a notebook stores the notebook’s ID and workspace ID as hardcoded GUIDs in its definition:
{ "typeProperties": { "notebookId": "da888b35-a17c-49ac-a8cf-1a5ffae91e20", "workspaceId": "e446a5e7-6666-42ad-a331-0bfef3187fbf" }}
These are your dev GUIDs. After deploying to a different workspace, you need to update them:
target_nb_id = get_target_item_id("Notebook", "run")fab(["set", PIPELINE, "-q", "definition.parts[0].payload.properties.activities[0].typeProperties.notebookId", "-i", target_nb_id, "-f"])fab(["set", PIPELINE, "-q", "definition.parts[0].payload.properties.activities[0].typeProperties.workspaceId", "-i", WS_ID, "-f"])
Again, the JSON paths are deeply nested. The fab set command is your best friend for post-deploy configuration.
Lesson 9: GitHub Actions Authentication via OIDC
No stored secrets for the Fabric service principal. GitHub’s OIDC provider exchanges a federated token directly:
- name: Login to Fabric CLI run: | FED_TOKEN=$(curl -sH "Authorization: bearer $ACTIONS_ID_TOKEN_REQUEST_TOKEN" \ "$ACTIONS_ID_TOKEN_REQUEST_URL&audience=api://AzureADTokenExchange" | jq -r '.value') fab auth login -t ${{ secrets.AZURE_TENANT_ID }} \ -u ${{ secrets.AZURE_CLIENT_ID }} \ --federated-token "$FED_TOKEN"
This means no client secrets to rotate — just configure the Azure AD app registration to trust your GitHub repo’s OIDC issuer. It works well, but you still need to set up an Azure AD app registration, configure federated credentials, and grant it Fabric permissions. It would be nice if Fabric supported direct service-to-service authentication — something like a Fabric API key or a native GitHub integration — without needing Azure as the intermediary.
Lesson 10: Use Variable Libraries for Runtime Config
Instead of baking config values into your notebook or using parameter.yml, Fabric has Variable Libraries:
# In your notebook at runtime:import notebookutilsvl = notebookutils.variableLibrary.getLibrary("deploy_config")download_limit = vl.download_limit
The deploy script creates/updates the variable library via the API:
fab(["api", "-X", "post", f"workspaces/{WS_ID}/variableLibraries", "-i", json.dumps({"displayName": "deploy_config", "definition": vl_definition})])
This gives you environment-specific configuration without redeploying the notebook. Change a variable, next pipeline run picks it up.
Lesson 11: Use abfss:// Paths for OneLake — It Makes Your Notebook Portable
When reading or writing to OneLake, use the abfss:// protocol with workspace and lakehouse IDs:
workspace_id = notebookutils.runtime.context.get('currentWorkspaceId')lakehouse_id = notebookutils.lakehouse.get('data').get('id')root_path = f"abfss://{workspace_id}@onelake.dfs.fabric.microsoft.com/{lakehouse_id}"
This makes your notebook fully portable — the same code runs everywhere:
- Local dev: swap to a local path or Azurite connection
- Deployed to staging:
notebookutilsresolves to the staging workspace/lakehouse IDs - Deployed to production: same code, different IDs at runtime
The alternative — hardcoding workspace names or using /lakehouse/default/ mount paths — ties your notebook to a specific workspace. With abfss://, the notebook doesn’t care where it’s running. The IDs come from the runtime context, and the deploy script handles attaching the right Lakehouse. Zero code changes between environments.
Lesson 12: Copying Files to OneLake Is Parallel but Slow
The notebook needs supporting files (SQL models, configs) available in OneLake. The fab cp command handles this, but it’s one file at a time. I parallelized with 8 workers:
from concurrent.futures import ThreadPoolExecutordef copy_file(f): rel = f.relative_to(root) fab(["cp", rel.as_posix(), f"{LAKEHOUSE}/Files/{rel.parent.as_posix()}/", "-f"])with ThreadPoolExecutor(max_workers=8) as executor: executor.map(copy_file, files)
Before copying files, you need to create the directory structure with fab mkdir. OneLake doesn’t auto-create parent directories.
Lesson 13: Schedule Idempotently
Don’t recreate the pipeline schedule every deploy — check first:
result = subprocess.run(["fab", "job", "run-list", PIPELINE, "--schedule"], capture_output=True, text=True)if "True" not in result.stdout: fab(["job", "run-sch", PIPELINE, "--type", "cron", "--interval", cfg["schedule_interval"], "--start", cfg["schedule_start"], "--end", cfg["schedule_end"], "--enable"])
This prevents duplicate schedules stacking up across deploys.
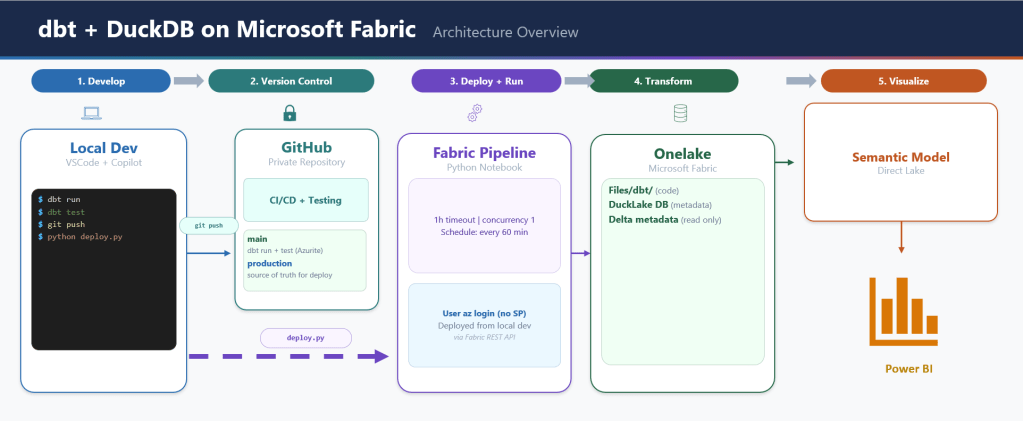
The Big Picture
Here’s the overall architecture in one diagram:
GitHub Push │ ▼GitHub Actions (OIDC → fab auth login) │ ▼deploy.py ├── fab create → Lakehouse (with schemas) ├── fab deploy → Notebook ├── fab set → Attach Lakehouse to Notebook ├── fab cp → Copy data files to OneLake (8 parallel workers) ├── fab job run → Execute Notebook (creates Delta tables) ├── fab deploy → Semantic Model (with GUID replacement + git restore) ├── fab api → Refresh Semantic Model (Power BI API) ├── fab deploy → Data Pipeline ├── fab set → Update Pipeline notebook/workspace refs └── fab job run-sch → Schedule Pipeline (if not already scheduled)
Everything is driven by a single deploy_config.yml that maps branch names to workspace IDs:
defaults: schedule_interval: "30" schedule_start: "2025-01-01T00:00:00" schedule_end: "2030-12-31T23:59:59"main: ws_id: "e446a5e7-..." schedule_interval: "720" # 12 hours (staging)production: ws_id: "be079b0f-..." download_limit: "60" # full data
Push to main → deploy to staging workspace. Push to production → deploy to production workspace.
Lesson 14: Don’t Deploy the Lakehouse Item — Let the Data Define the Schema
I had a data.Lakehouse/ folder in fabric_items/ with a .platform file and a lakehouse.metadata.json that just set defaultSchema: dbo. I was running fab deploy for it. Then I realized: I was already creating the Lakehouse with fab create before the deploy step:
fab create "prod.Workspace/data.Lakehouse" -P enableSchemas=true
The fab create handles everything. The fab deploy of the Lakehouse item was redundant.
But there’s a deeper point here: the Lakehouse schema should be driven by your data, not by CI/CD. Your notebook creates the tables, your data transformation defines the schemas. The Lakehouse is just the container — it doesn’t need a deployment definition. Trying to manage Lakehouse schema through fab deploy is fighting the natural flow. Create the container, let the data populate it.
I deleted the entire data.Lakehouse/ folder from my repo. One less item to deploy, one less thing to break.
What I’d Tell My Past Self
- Read every
fabCLI error message carefully. Many failures are silent (wrong key name, missing-iflag). Add verbose logging. - Deploy in phases, not all at once. Item dependencies are real and the error messages when you get the order wrong are unhelpful.
- Skip
parameter.ymlfor anything non-trivial. Direct GUID replacement in Python with git restore is simpler and fully transparent. fab setis the power tool. Most post-deploy configuration — attaching lakehouses, updating pipeline references — goes through deeply nested JSON paths infab set.- Test in a separate workspace mapped to a non-production branch. The
deploy_config.ymlpattern of mapping branches to workspaces makes this trivial. - The Power BI API and Fabric API are different surfaces. Some operations (like semantic model refresh) only exist on the Power BI side. Use
fab api -A powerbi. - Don’t deploy what you don’t need to. If
fab createhandles it, drop the item definition. Let your data drive the schema.
The Fabric CLI is new — fab deploy landed in v1.5.0 just this month — and it already handles a full end-to-end deployment pipeline. The foundation is solid. Everything you need is already there — it just takes knowing where to look. Hopefully this saves you some of that discovery time.
Acknowledgements
Special thanks to Kevin Chant — Data Platform MVP and Lead BI & Analytics Architect — whose blog has been an invaluable resource on Fabric CI/CD and DevOps practices for the data platform. If you’re working with Fabric deployments, his posts are well worth following.