Filtering by Dynamic Distance in PowerBI

TL:DR , the blog show some tricks using DAX and Icon Map, pattern like dynamic filtering by distance and showing a Buffer when selecting a point, The Publish to web report and pbix are here

before you get too excited Currently to make it works you have to block the Zoom Functionality.

The Formula for calculating distance in PowerBI is very well known I think it was first mentioned here , I had used it already for building this report a couple of years ago.

what changed is Icon Map, with the 3.0 release basically nearly everything can be customized which make some new scenario Possible.

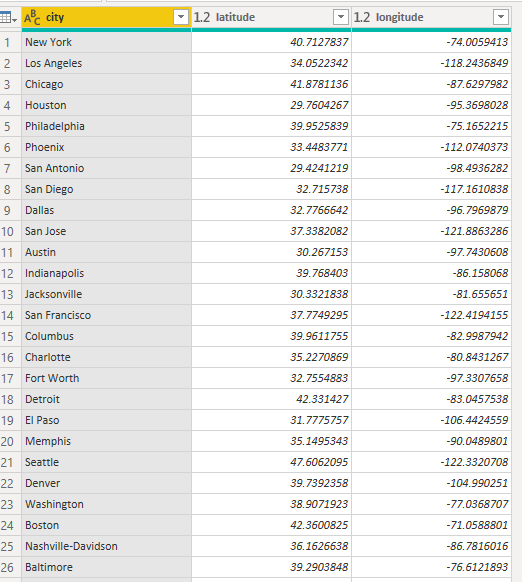
you need only 1 table with coordinates

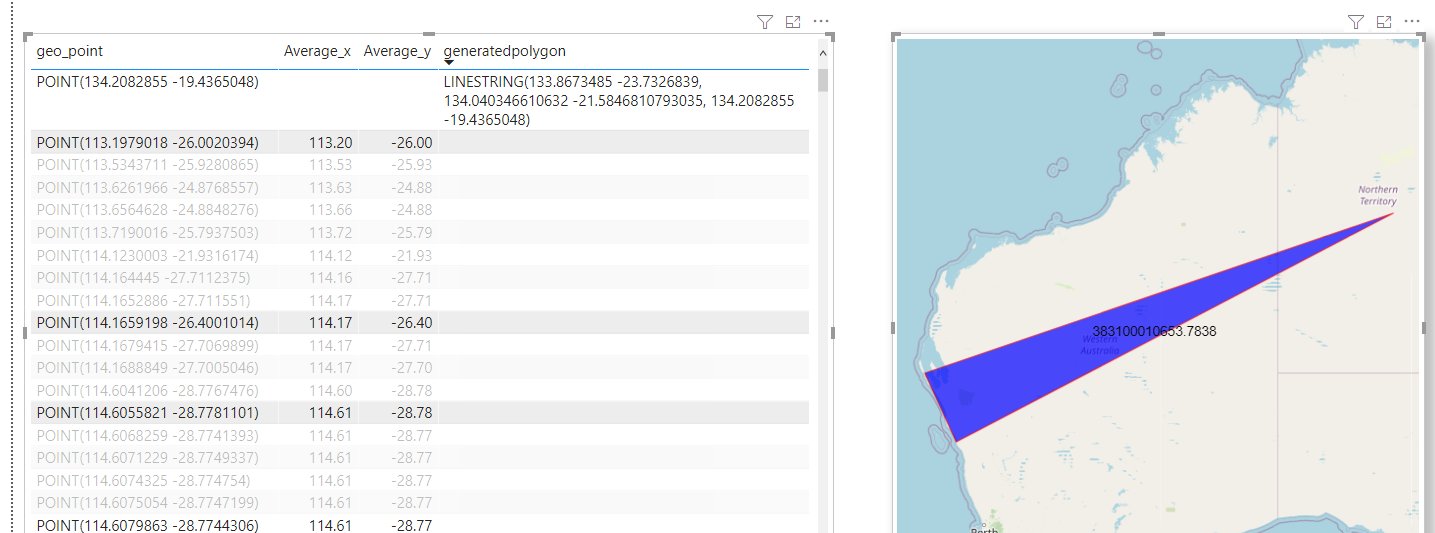
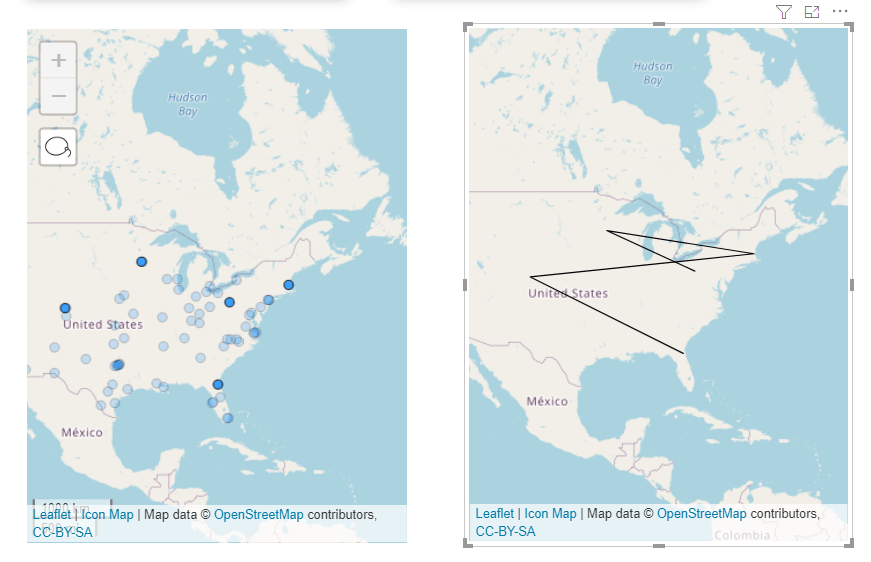
Draw a Line Between Two Points and show Distance

1- You Build first an Icon map just using point

2-Create the second Layer by creating a new Map Visual

This Map will show the line based on the Point selected

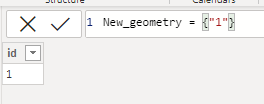
we need first a dummy table with one row

Build a measure that capture the selection

linestring = var Geo="LINESTRING("&CONCATENATEX(reference,[longitude]&" "&[latitude],",")&")"
return
if(ISFILTERED(reference[city]),Geo,BLANK())

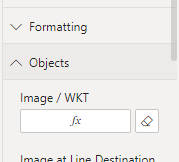
add the Line String Measure here

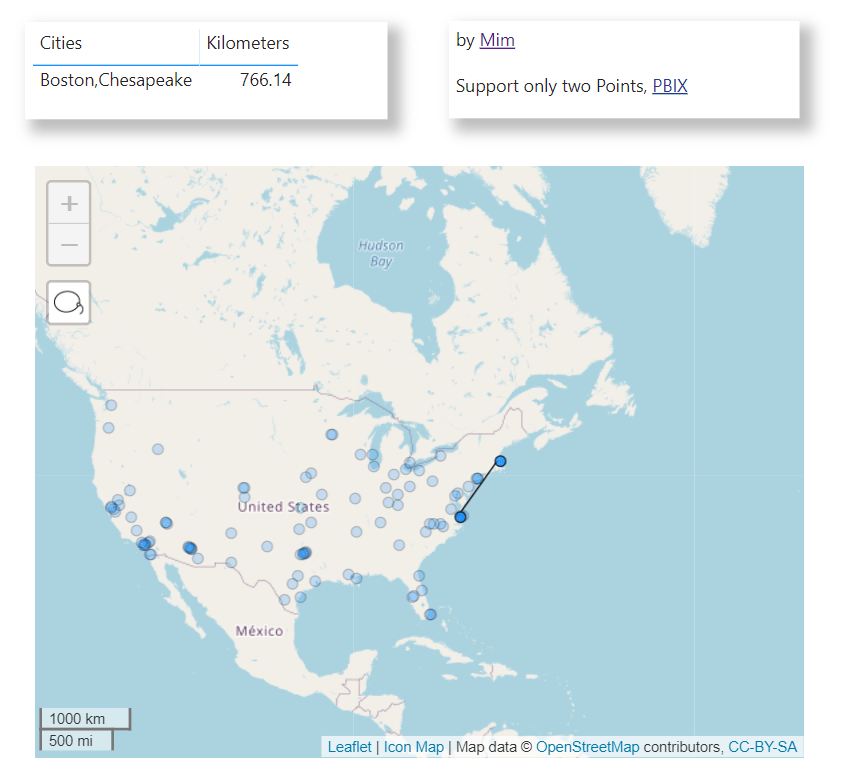
and Voila now you have two Map, The Point Selected in the first Map will be shown as a line in the second Map, CONCATENATEX does not respect the Order of Selection, so currently it is useful only for two Points ( M parameter respect the selection but that will be another Blog)

3- Merge the Two Map together

I guess this is the trick of the Blog, if you want this behavior

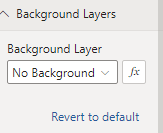
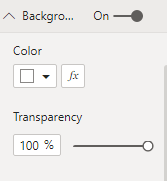
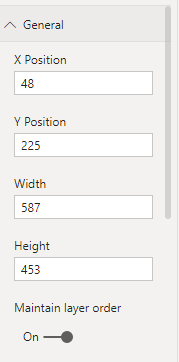
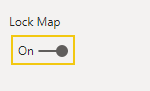
Stack the two layers on top of each other; Make the Point layer background transparent, Remove Background, Lock the Map, keep both layer having the same Dimension , Layer Layout and zoom Value

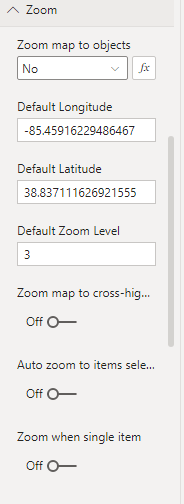
You have to remove the Zoom otherwise the two layers will not be synchronized, Technically speaking we need only 1 Map, but unfortunately DAX table can not filter itself, feel free to vote on this idea and complain on Linkedin and Twitter 🙂

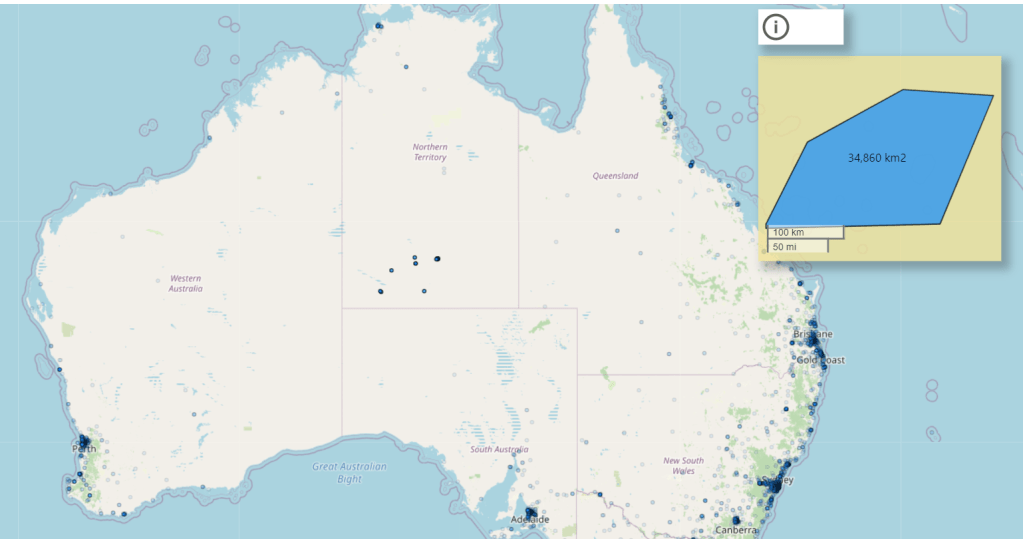
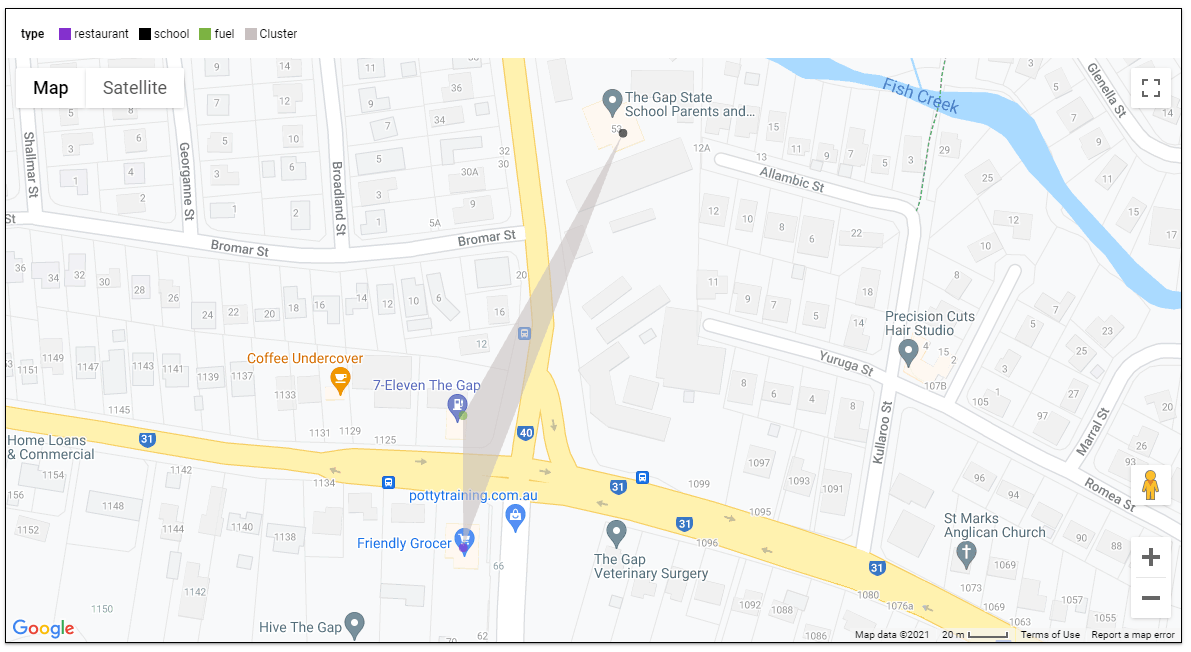
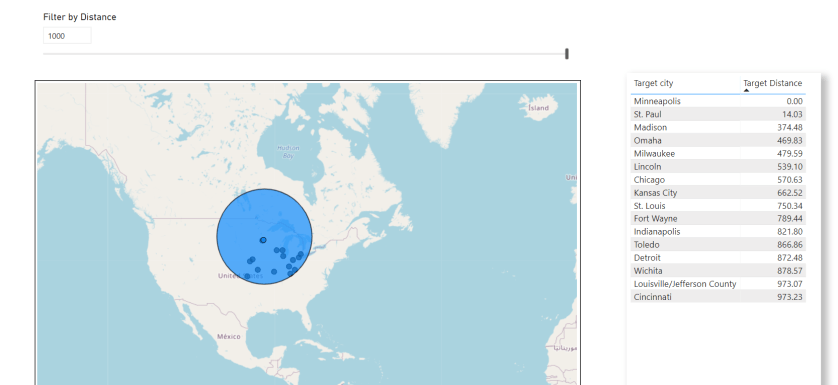
Select a Buffer Selection

When you Select a Point, the Map will draw a Circle and filter only the Point inside the Circle, it is a very Powerful GIS pattern.

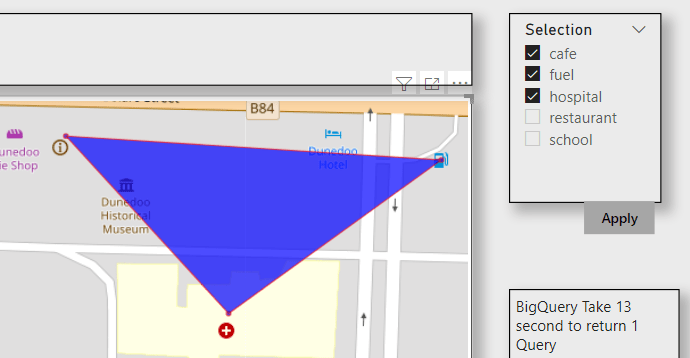
The Same approach, but now we create three Layers

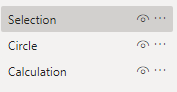
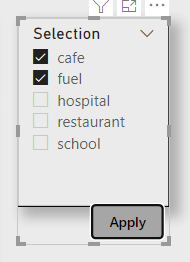
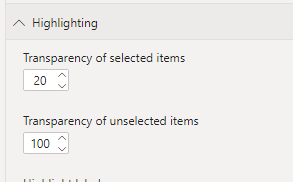
The Selection Layer we use this option ( the point not selected will be hidden, I love Icon map )

The Circle Layer

we use this Option

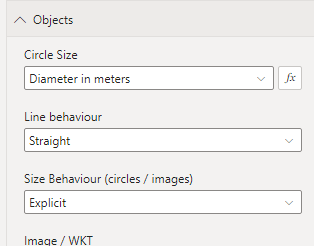
to get the Radius of the Circle we use this Measure

diam_M = if(ISFILTERED(reference[city]),SELECTEDVALUE(Dis_Parameter[Dis])*1000)

The Parameter is used to control the Size and the measure Works only when a point is selected

The Calculation Layer is where we show the Point filtered , we will use a bit of DAX, we create a new disconnected Table , make sure there is no relationship between the two Tables

to reduce data duplication we need only ID from the first table, I am using a measure to get the coordinates ( Probably LookupValue is no the most performant Option)

Target_Lat = LOOKUPVALUE(reference[latitude],reference[city],min(Target[Target City]))
Target_Lng = LOOKUPVALUE(reference[longitude],reference[city],min(Target[Target City]))

The Measure to calculate the Distance is

Target Distance = 
-- see https://radacad.com/dynamic-distances-in-power-bi
var Lat1 = min(reference[latitude])
var Lng1 = min(reference[longitude])

var Lat2 = [Target_Lat]
var Lng2 = [Target_Lng]
---- Algorithm here -----
var P = DIVIDE( PI(), 180 )
var A = 0.5 - COS((Lat2-Lat1) * p)/2 + 
    COS(Lat1 * p) * COS(lat2 * P) * (1-COS((Lng2- Lng1) * p))/2
var final = 12742 * ASIN((SQRT(A)))
return if(ISFILTERED(reference[city]),final)

And then another Measure to filter the Result

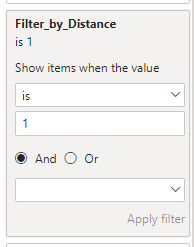
Filter_by_Distance = if(ISFILTERED(reference[city]),if([Target Distance]<=SELECTEDVALUE(Dis_Parameter[Dis]),1,BLANK()),BLANK()) 

Then add the measure filter to the Viz

Icon Map is a fantastic Tool, and there are plenty of possibilities, hopefully the author keep adding more options and customisation

Using PowerBI M Parameter to calculate a polygon Area

TL;DR : PowerBI does not support GIS Area calculation, in this blog we use M Parameter to leverage third party Database to do the calculation, Works only In Direct Query Mode.

ink to Public report

With the Update of August 2021, M Parameter support multi value selection, see this Previous blog for a little background, this open some interesting new use cases that was not possible before in PowerBI.

Again, before you get too excited, it works only with Direct Query and Database that support M Parameter ( BigQuery, Snowflake, Azure ADX etc)

One example is calculating the area of a group of arbitrary points

  • In Icon Map, I select a group of points (Notice here, Icon map is acting as Parameter Action filter )
  • The List of points are used in an M Parameter
  • A SQL Query is sent back to the Database that support M Parameter in my case I am using BigQuery
  • BigQuery generate a wkt and calculate the area , you can calculate the distance too or any metrics that use geometry
  • Plot the results in another Icon Map

The Query is straightforward, and the best part because we are not running a Query against any table in BigQuery , it does not cost anything, you can register here for free and no credit card is required

Here is the M Query

let
TagsList = 
    if 
    //check to see if the parameter is a list
      Type.Is(
        Value.Type(tag_selection), 
        List.Type
      ) then 
        //if it is a list
        let
          //add single quotes around each value in the list
          AddSingleQuotes = List.Transform(
              tag_selection, 
              each "'" & _ & "'"
            ),
          //then turn it into a comma-delimited list
          DelimitedList = "[" & Text.Combine(
              AddSingleQuotes, 
              ","
            ) &"]"
          
        in
          DelimitedList
    else 
      //if the parameter isn't a list
      //just add single quotes around the parameter value
      "['" & tag_selection & "']",
      
Source = Value.NativeQuery(GoogleBigQuery.Database([BillingProject="xxxxxx"]){[Name="xxxxx"]}[Data], "WITH
  xxx AS (
  SELECT
    *
  FROM
    UNNEST( "& TagsList &" ) AS element),
  yyy AS (
  SELECT
    ST_CONVEXHULL( ST_UNION_AGG(ST_GEOGFROMTEXT(element))) AS geo
  FROM
    xxx)
SELECT
  ST_ASTEXT(geo) AS WKT,
  st_area(geo) AS area
FROM
  yyy", null, [EnableFolding=true])
in
    Source

And here is the result.

Future Improvement

One thing I would really like is the possibility to show the result in the same Map, unfortunately to the best of my knowledge a Table in DAX can not filter itself, see this example

Image

in Icon map it is possible to display wkt and points at the same time , but as you can see from the screenshot wkt geometry in the table does not change based on internal filter selection, the other viz works fine.

M Parameters has a very interesting application, and I am excited to try other tricks 🙂

Edit : I appreciate some votes here for the option to pass filter selection to the same Visual

Multi select parameter support in BigQuery when using PowerBI

At last in the August 2021 update of PowerBI we finally can create custom Queries when connecting to BigQuery, this is a very big deal for two reasons.

  • For users who can’t write views on the Database
  • Passing complex parameter values to a SQL Query

To show an example, I am using the same Query from this previous blog, I am not going going to repeated here, have a look as it has more details about BigQuery GIS Clustering.

First issue I did not know how to pass multiple values, as it is a list, luckily Chris has written this excellent blog using Snowflake please read his blog first, and the code works the same

Here is the a pseudo M code, notice I copied Chris code verbatim, I had just to add Square Brackets “[]” to the parameter TagsList , so BigQuery understand it as an array.

For example when a user select fuel, cafe

the SQL became

UNNEST( “& TagsList &” ) ——-> UNNEST( [‘cafe’,’fuel’] )

let
TagsList = 
    if 
    //check to see if the parameter is a list
      Type.Is(
        Value.Type(tag_selection), 
        List.Type
      ) then 
        //if it is a list
        let
          //add single quotes around each value in the list
          AddSingleQuotes = List.Transform(
              tag_selection, 
              each "'" & _ & "'"
            ),
          //then turn it into a comma-delimited list
          DelimitedList = "[" & Text.Combine(
              AddSingleQuotes, 
              ","
            ) &"]"
          
        in
          DelimitedList
    else 
      //if the parameter isn't a list
      //just add single quotes around the parameter value
      "['" & tag_selection & "']",
      
Source = Value.NativeQuery(GoogleBigQuery.Database([BillingProject="xxxxxx"]){[Name="test-187010"]}[Data], "select  from xxx WHERE    value IN UNNEST( "& TagsList &"  ))
    Source

and here is the final report, using the Excellent icon Map custom Visual

As the data is free, I made a publish to web report , the report is a bit slow as it take in average 12 second for BigQuery to return the results, either GIS Clustering is expensive or The SQL Query is not optimized.

I think it is an exciting new functionality, there are a lot of uses cases where you want to exactly control the SQL generated by PowerBI.

Dynamic Geospatial Clustering using BigQuery GIS

I was reading this blog post and thought of a new use case, using OpenstreetMap Data and generate polygons based on the user Selection

First to reduce cost, we will select only all a subset of OpenstreetMap Data, you can use this post as a reference

my base table is OPENSTREETMAPAUSTRALIAPOINTS , which contains 614,111 rows

The idea is to provide some tag selection ( School, cafe etc) and let BigQuery generate a new polygons on the fly, the key function in this SQL script is ST_CLUSTERDBSCAN

WITH
  z AS (
  SELECT
    *
  FROM
    `test-187010.GIS.OPENSTREETMAPAUSTRALIAPOINTS`
  WHERE
    value IN UNNEST(@tags_selection)),
  points AS (
  SELECT
    st_geogpoint(x,
      y) AS geo_point,
    value AS type
  FROM
    z ),
  points_clustered AS (
  SELECT
    geo_point,
    type,
    st_clusterdbscan(geo_point,
      200,
      @ct) OVER() AS cluster_num
  FROM
    points),
  selection AS (
  SELECT
    cluster_num AS spot,
    COUNT(DISTINCT(type))
  FROM
    points_clustered
  WHERE
    cluster_num IS NOT NULL
  GROUP BY
    1
  HAVING
    COUNT(DISTINCT(type))>=@ct
  ORDER BY
    cluster_num)
SELECT
  spot AS Cluster,
  st_convexhull(st_union_agg(geo_point)) as geo_point,
  "Cluster" as type
FROM
  selection
LEFT JOIN
  points_clustered
ON
  selection.spot=points_clustered.cluster_num
  group by 1
union all
SELECT
  spot AS Cluster,
  geo_point ,
type
FROM
  selection
LEFT JOIN
  points_clustered
ON
  selection.spot=points_clustered.cluster_num

Technically you can hardcode the values for Tags, but the whole point is to have a dynamic selection

I am using Data Studio and because the Query is not accelerated by BI Engine , and in order to reduce the cost, I made only 6 Tags available for user selection and hard code the distance between two points to 200 m.

Here is an example when selecting the tags (restaurant, school and fuel), I get 136 cluster

here when I zoom on 1 location, the result are pretty accurate

I think it is a good use case for parameters, GIS calculation are extremely heavy and sometimes all you need from a BI tool is to send Parameter values to a Database and get back the result.

you can play with the report here

edit : August 2021, The Same report using PowerBI