This blog is just another use case where we can leverage M parameter to perform calculation that can not be done in PowerBI, see example here for clustering and Area calculation
To be clear, it is always possible to precalculate outside PowerBI and just import the results, but in the current case, it can be tricky, let’s say you have 1000 points and you want to check the distance between two points using an existing route network, you will need to calculate 1000 X 1000 combination, instead the idea here, you select two points then M Parameter will send the selection to a Database using Direct Query to do the calculation and get the result back.
For this example I am using BigQuery, but you can use any Database that support M Parameter (Snowflake, Azure ADX etc)
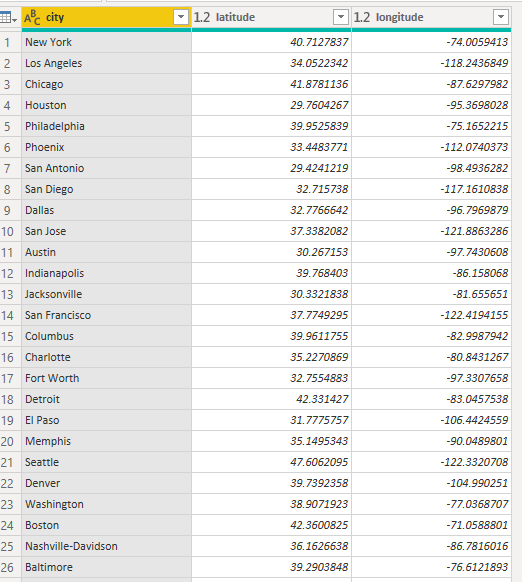
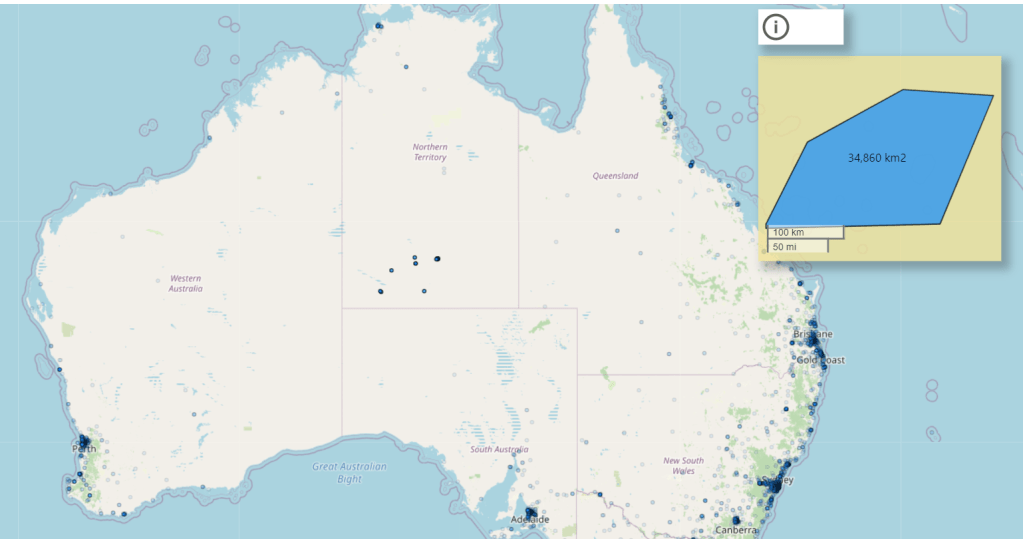
Import all the bus stop location in a particular Area
Because of Covid situation, the Openstreetmap dataset is free to Query, here is the SQL Query, I am just using Brisbane as a reference
CREATE OR REPLACE TABLE
test-187010.gis_free.Brisbane_Bus_Stop AS
SELECT
ST_CENTROID(geometry) AS center_location,
tags.key,
tags.value
FROM
`bigquery-public-data.geo_openstreetmap.planet_features`,
UNNEST(all_tags) tags
WHERE
key = 'highway'
AND value='bus_stop'
AND ST_INTERSECTS(geometry,
-- Selecing Brisbane area
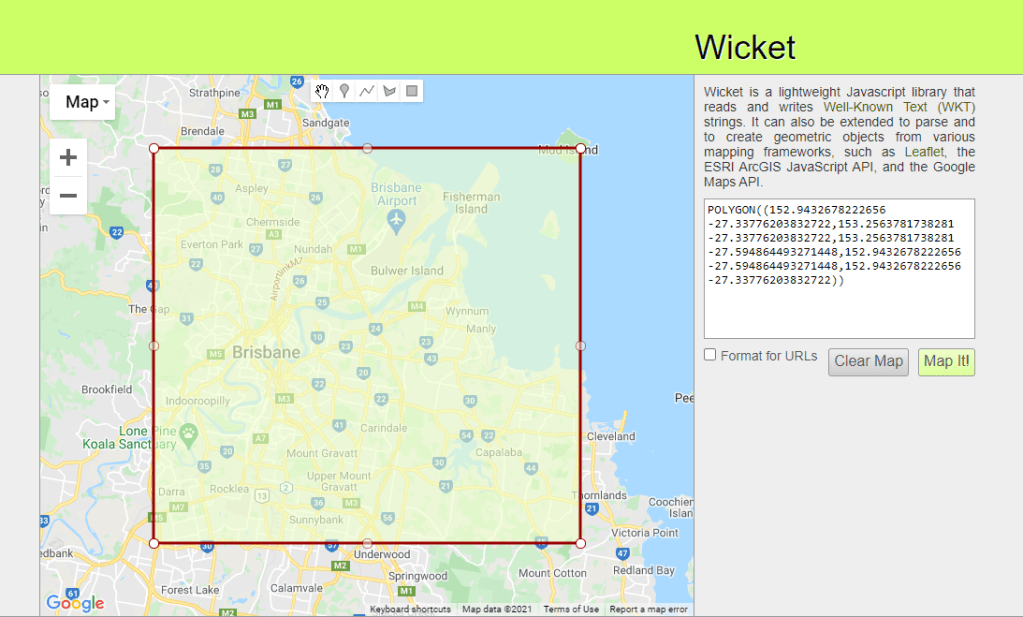
ST_GEOGFROMtext("POLYGON((152.9432678222656 -27.33776203832722,153.2563781738281 -27.33776203832722,153.2563781738281 -27.594864493271448,152.9432678222656 -27.594864493271448,152.9432678222656 -27.33776203832722))"))
you can use this handy website to generate a polygon from a map
Import Road network
The same we will use a subset of Openstreetmap dataset , first we select Key= Highway and to improve performance we only the main values ( primary, secondary road etc)
CREATE OR REPLACE TABLE
  `test-187010.gis_free.brisbane_Road_Network`
CLUSTER BY
  geometry AS
SELECT
  geometry,
  tags.key,
  tags.value
FROM
  `bigquery-public-data.geo_openstreetmap.planet_ways`,
  UNNEST(all_tags) tags
WHERE
  key = 'highway'
  AND value IN ("motorway",
    "motorway_link",
    "primary",
    "primary_link",
    "secondary",
    "secondary_link",
    "tertiary",
    "tertiary_linkt",
    "runktrunk_link")
  AND ST_INTERSECTS(geometry,
    --Select you Area Here:
    ST_GEOGFROMtext("POLYGON((152.9432678222656 -27.33776203832722,153.2563781738281 -27.33776203832722,153.2563781738281 -27.594864493271448,152.9432678222656 -27.594864493271448,152.9432678222656 -27.33776203832722))"))
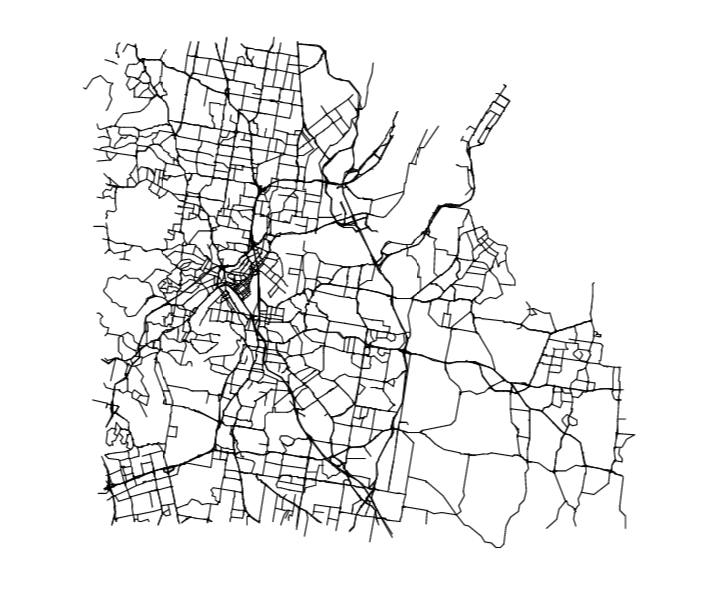
jut to get an idea he is how the road network looks
Time for calculation
Unfortunately as of this writing BigQuery GIS does not support the function to find the shortest path between two points in a network, luckily I find this user defined function written in Javascript, the good news it works as expected but javascript will always be slower compared to a native SQL function, anyway here is the SQL Query
WITH
  initial_parameter AS (
  SELECT
    *
  FROM
    UNNEST(['POINT(153.023194 -27.563979)','POINT(152.979212 -27.49549)'] ) AS element ),
  mynetwork AS (
  SELECT
    ARRAY_AGG(geometry) roads
  FROM
    `test-187010.gis_free.brisbane_Road_Network_cluster` ),
  calculation AS(
  SELECT
    `libjs4us.routing.geojson_path_finder`(roads,
      st_geogfromtext(a.element),
      st_geogfromtext(b.element)) AS tt
  FROM
    mynetwork,
    initial_parameter a,
    initial_parameter b
  WHERE
    a.element>b.element
  LIMIT
    100)
SELECT
  ST_ASTEXT (tt.path) AS GEO,
  tt.weight AS len
FROM
  calculation
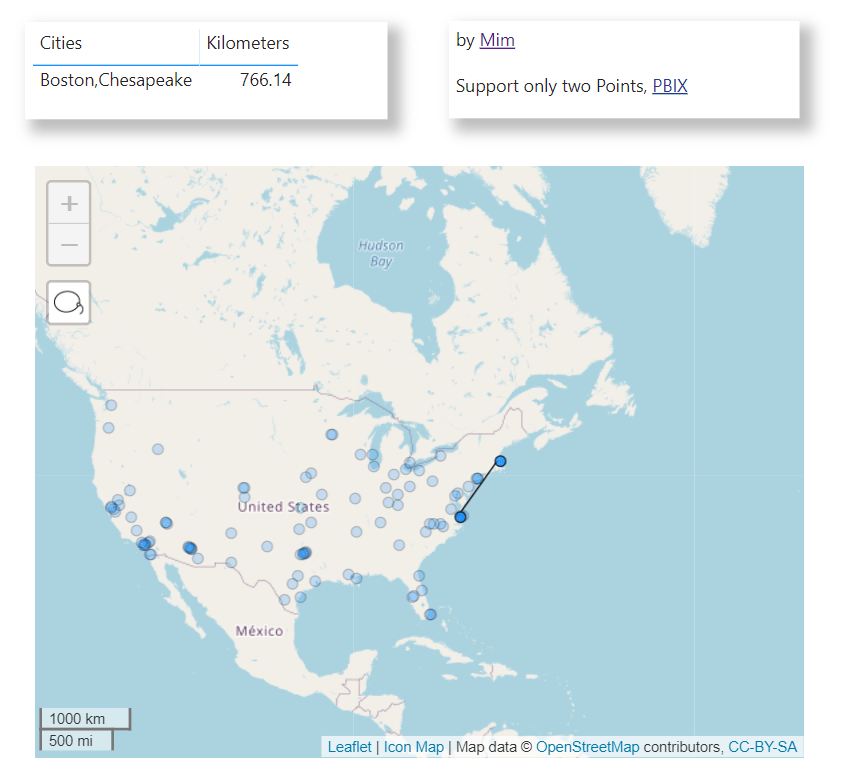
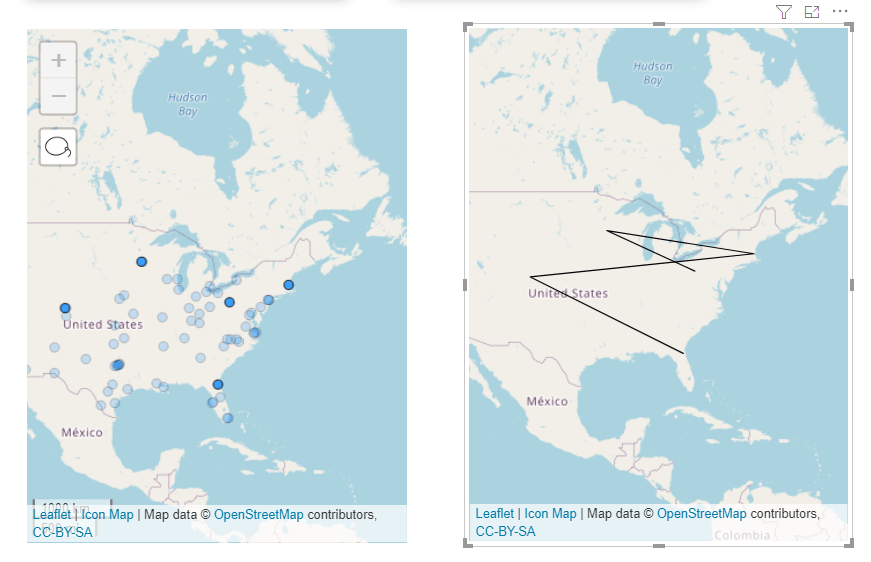
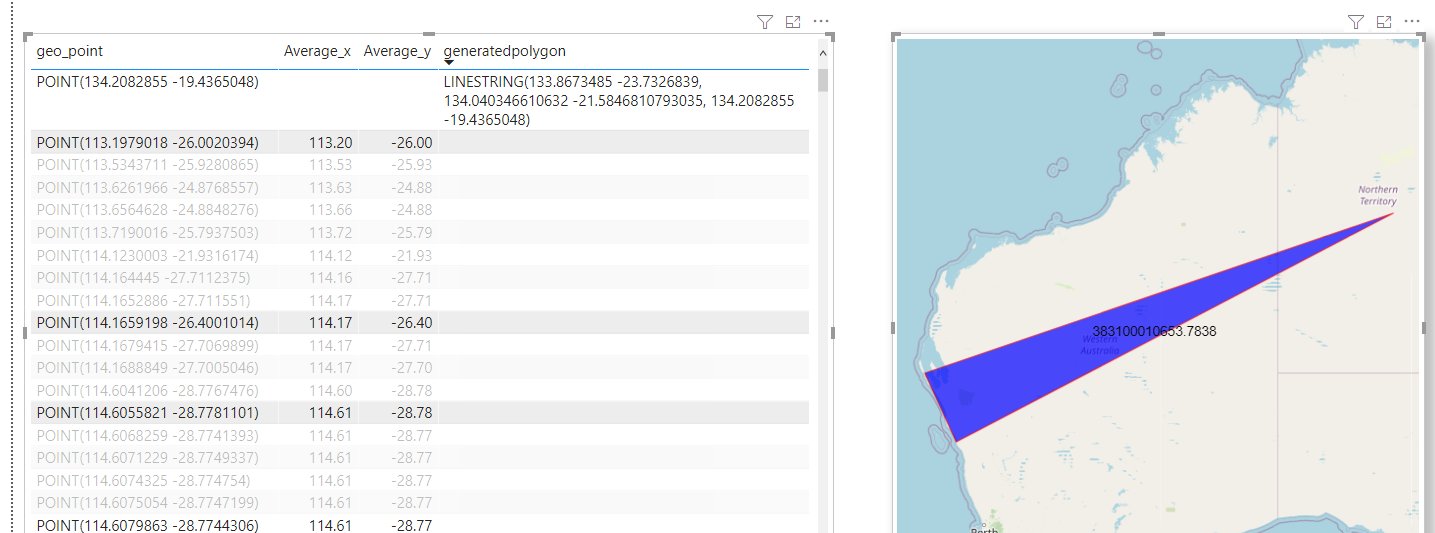
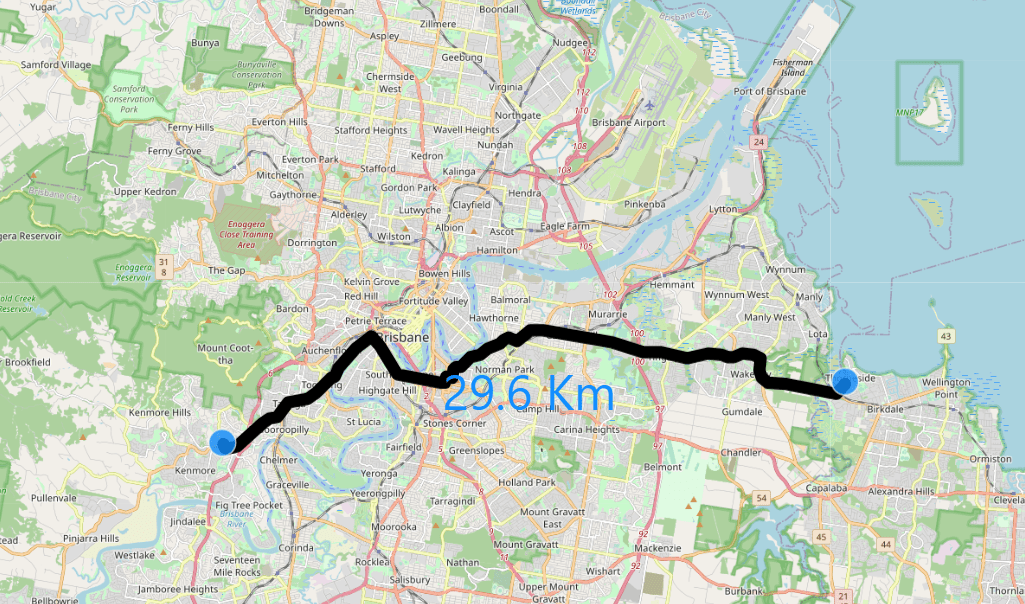
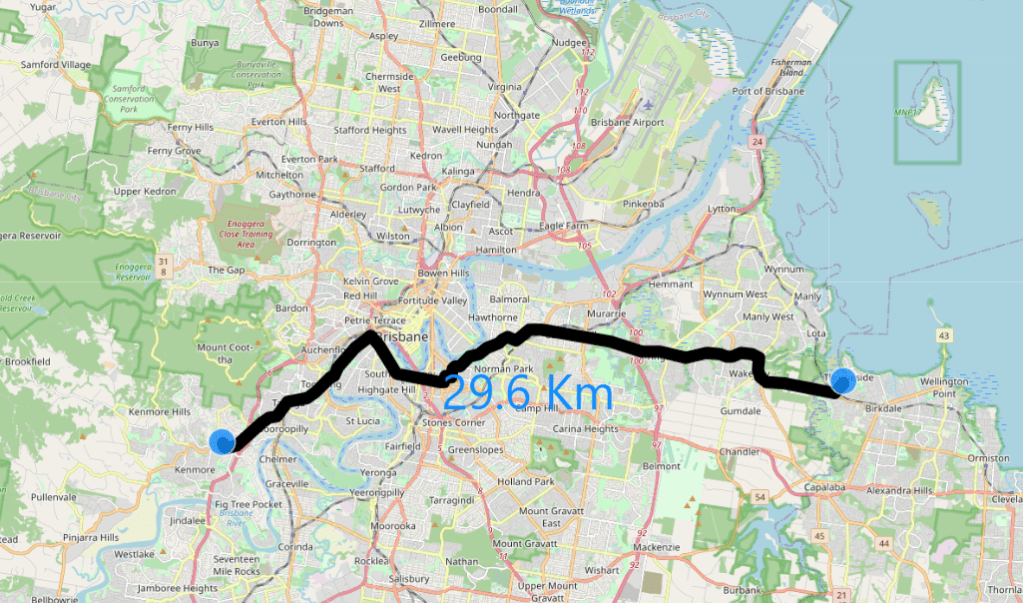
And here’s the result, a linestring and the length in Km, the Query took 7 second, to be honest I have no idea about the calculation complexity, so not sure if it is fast or not 🙂

PowerBI M Parameter
After we make sure the Query works with two fixed points, now we need just to make it interactive, so the user can select any two points, and that exactly what M parameter do
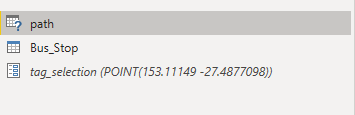
The Table path is using Direct Query
The Table Bus_Stop is import mode, which is used to as the Parameter filter
The Parameter is Tag_Selection , for a very detailed explanation, Please read this blog first
and here is the M Query
let
TagsList =
    if
    //check to see if the parameter is a list
      Type.Is(
        Value.Type(tag_selection),
        List.Type
      ) then
        //if it is a list
        let
          //add single quotes around each value in the list
          AddSingleQuotes = List.Transform(
              tag_selection,
              each "'" & _ & "'"
            ),
          //then turn it into a comma-delimited list
          DelimitedList = "[" & Text.Combine(
              AddSingleQuotes,
              ","
            ) &"]"

        in
          DelimitedList
    else
      //if the parameter isn't a list
      //just add single quotes around the parameter value
      "['" & tag_selection & "']",
    Source =
    Value.NativeQuery(GoogleBigQuery.Database([BillingProject="testing-bi-engine"]){[Name="test-187010"]}[Data],
     "WITH
  initial_parameter AS (
  SELECT
    *
  FROM
    UNNEST("& TagsList &" ) AS element ),
  mynetwork AS (
  SELECT
    ARRAY_AGG(geometry) roads   FROM   `test-187010.gis_free.brisbane_Road_Network_cluster` ),
  calculation AS(
  SELECT
    `libjs4us.routing.geojson_path_finder`(roads, st_geogfromtext(a.element), st_geogfromtext(b.element)) AS tt
  FROM
    mynetwork,    initial_parameter a,    initial_parameter b
  WHERE
    a.element>b.element
  LIMIT
    100)
SELECT
  1 AS DUMMY,  CASE     WHEN ARRAY_LENGTH("& TagsList &") =2 THEN ST_ASTEXT (tt.path)  ELSE  NULL END  AS GEO,
  CASE    WHEN ARRAY_LENGTH("& TagsList &") =2 THEN tt.weight  ELSE  0 END   AS len
FROM  calculation"
       , null, [EnableFolding=true])

    in
       Source
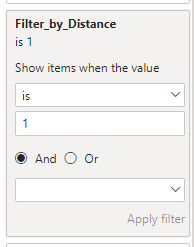
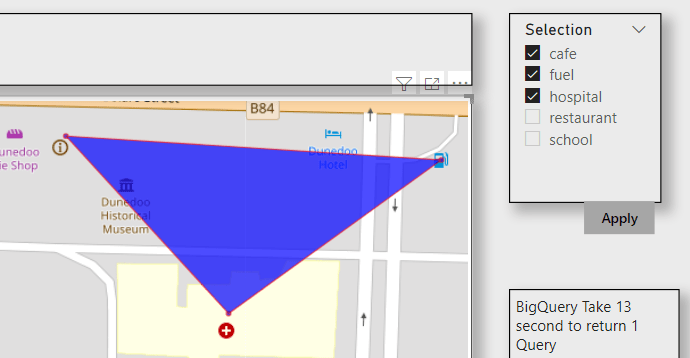
Notice I added this condition ARRAY_LENGTH(“& TagsList &”) =2 then 0, just to reduce the calculation when the user select only 1 point, Currently in PowerBI, there is no way to have Query reduction option for cross filtering
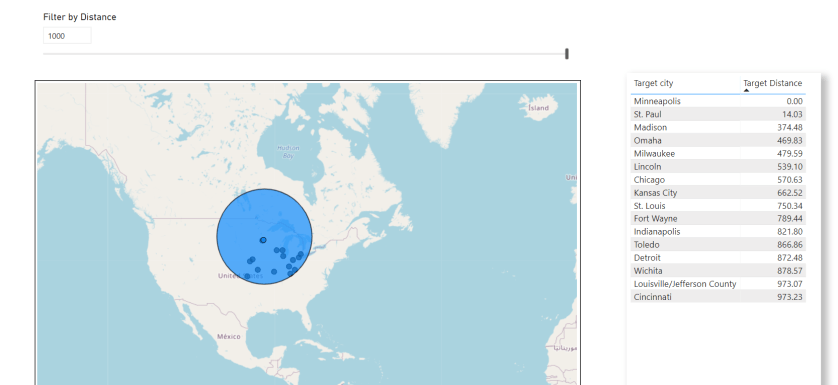
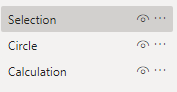
Icon Map
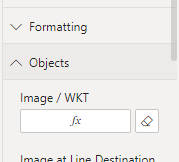
Icon map is the only visual that can render WKT geometry in PowerBI, this previous blog explain how we simulate multi layer interaction
Performance
The Performance unfortunately it is a bit disappointing, around 20 second, javascript UDF is slow and PowerBI is very chatty , which is a nice way to say, PowerBI send a lot of SQL Queries,everytime I select two points, PowerBI send 4 Queries
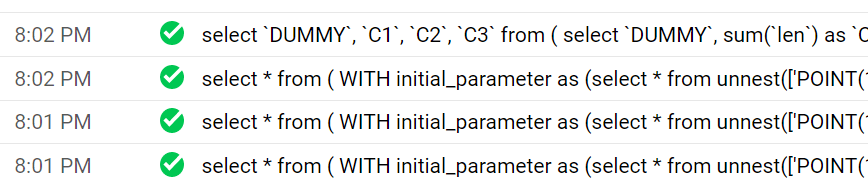
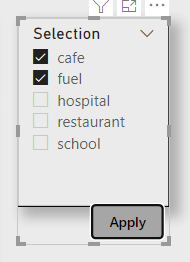
The first Query is when I select the first point, hopefully one day we will have an option to action cross filtering only after we finish the selection
Query 2 and 3 are identical and are used to check the field type of the Table, I wonder why PowerQuery is sending the same Query twice
Query 4 is the real Query that bring the result
you can download the pbix here
Edit : Carto which is the same company that released the javascript function is now offering a native SQL functions which should be substantially faster, I have not used it as it is commercial, but if you have a massive network, maybe it is worth it, just to be clear I have no affiliation with them.
Edit : added the same report but now using Tableau