DeltaProtocolError: The table has set these reader features: {'deletionVectors'} but these are not yet supported by the deltalake reader.
Alternative: Using DuckDB
A simple alternative is to use DuckDB:
import duckdb

duckdb.sql("SELECT COUNT(*) FROM delta_scan('/lakehouse/default/Tables/xxx')")
Tested with a file that contains Deletion vectors
Column Mapping
The same approach applies to column mapping as well.
Upgrading DuckDB
Currently, Fabric Notebook comes preinstalled with DuckDB version 1.1.3. To use the latest features, you need to upgrade to the latest stable release (1.2.1) :
Note: Installing packages using %pip install does not restart the kernel when you run the notebook , you need to use sys.exit(0) to apply the changes, as some packages may already be loaded into memory.
import duckdb
duckdb.sql(" force install delta from core_nightly ")
duckdb.sql(" from delta_scan('/lakehouse/default/Tables/dbo/evolution_column_change') ")
The Future of Delta Rust .
Currently, there are two Rust-based implementations of Delta:
Delta_rs: The first and more mature implementation, developed by the community. It is an independent implementation of the Delta protocol and utilizes DataFusion and PyArrow (which will soon be deprecated) as its engine. However, Delta_rs does not support deletion vectors or column mapping, though it does support writing Delta tables.
Delta Kernel_rs: The newer, “official” implementation of Delta, providing a low-level API for query engines. It is currently being adopted by DuckDB ( and Clickhouse apparently) with more engines likely to follow. However, it is still a work in progress and does not yet support writing.
There are ongoing efforts to merge Delta_rs with Delta Kernel_rs to streamline development and reduce duplication of work.
Note : although they are written in Rust, we mainly care about the Python API 🙂
Conclusion
At least for now, in my personal opinion, the best approach is to:
Before proceeding, ensure you have the necessary tools installed and configured. For more details, refer to the official installation guide: Install Azure CLI on Windows.
Install Azure CLI (one-time setup) winget install Microsoft.AzureCLI Ensure you have the latest version installed.
Login to Azureaz login Follow the browser-based authentication flow.
Installing Required Python Package
The obstorepackage is a Python API for the Rust-based Object Store crate, which simplifies interaction with cloud storage systems.
pip install obstore --upgrade
Connecting to OneLake Storage
Once installed, you can connect to OneLake using the obstore package:
import obstore
from obstore.store import from_url

# Define storage path
store = from_url('abfss://sqlengines@onelake.dfs.fabric.microsoft.com/power.Lakehouse/Files', azure_use_azure_cli=True)
there is a PR by someone from the community where azure_use_azure_cli=True will not be needed the system will automatically pick the available authentification
Listing Files in OneLake
To list the files and folders inside OneLake, always specify a prefix to avoid long processing times:
obstore.list(store, 'tmp').collect()
Uploading Local Files to OneLake
To upload files from a local directory to OneLake, use the following script:
import os

folder_path = '/test'  # Change this to the directory containing your files

for root, dirs, files in os.walk(folder_path):
    for file in files:
        local_path = os.path.join(root, file).replace("\\", "/")
        print(f"Uploading: {local_path}")
        obstore.put(store, local_path, local_path)
Downloading Files
for downloading files, you use get
xx = obstore.get(store,'plan/plan.png').bytes()
with open('output_file.png', 'wb') as file:
    file.write(xx)
Compatibility with Other Storage Solutions
The beauty of this approach is that the code remains largely the same whether you’re using OneLake or an S3-compatible storage service. The main differences lie in updating:
The storage path
Authentication credentials
Note:OpenDale provides a similar solution, but it does not currently support Entra OAuth 2
Summary
This short blog outlines a straightforward way to load files into OneLake using Python. With Azure CLI authentication and obstore, managing files in OneLake becomes both simple and specially standardized.
Obviously, it was always possible to do the same using Azure storage SDK but, the API is far from being user friendly (Personal opinion), it is designed for developers, but as a business user I like this package 🙂
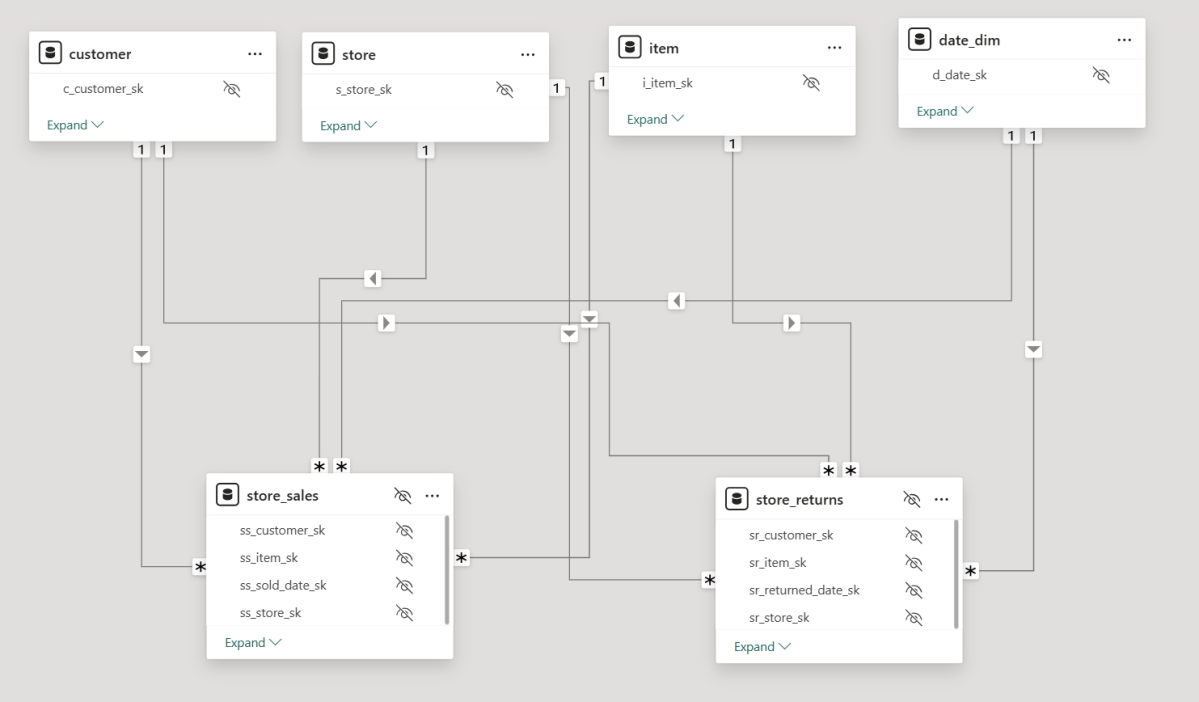
For no particular reason, I recently opened a Power BI report with two fact tables, exported the model definition to TMDL, saved it as a file, and loaded it into several state-of-the-art LLMs, including ChatGPT, Grok, Anthropic, and Qwen QWQ. I wasn’t particularly interested in comparing specific models—I just wanted to get a general sense of how they performed. To keep things simple, I used only the free tiers.
To my surprise, these models are getting really smart. They all recognized that the file represented a Power BI semantic model. They understood the concept of tables, columns, relationships, and measures, which was quite impressive.
You can download the Model here , i added a semantic Model as a text file in case you don’t have PowerBI
The Power of Semantic Models
Power BI, and before that PowerPivot, has supported multiple fact tables from day one. I remember the first time I used PowerPivot— a colleague showed me how to handle multiple fact tables: just don’t join fact to fact. Instead, use a common dimension, and everything will work fine. Back then, I had no idea about Kimball, multi-stage SQL queries, chasm trap etc. As a business user, I only cared that I got the correct results. It took me years to appreciate the ingenuity and engineering that went into making this work seamlessly. To me, this is an example of great product design: solve a very hard problem, and people will use it.
But this blog isn’t about Power BI and DAX—that’s a solved problem. Instead, I wanted to explore whether LLMs, by reading only metadata, could generate correct SQL queries for relatively complex questions.
Note: for people not familiar with TMDL, it is a human readable format of PowerBI semantic Model ( if human can read it, then LLMs will understand it too)
Testing LLMs with SQL Generation
I started with simple queries involving only one fact table, and the results were straightforward. The models correctly referenced measure definitions, avoiding column name hallucinations. Good news so far.
Things got more interesting when I asked for a query using a more complex measure, such as Net Sales:
Net Sales = [Total Sales] - [Total Returns]
This measure involves two tables: store_sales and store_returns.
Expected SQL Approach: Drilling Across
My expectation was that the models would use the Drilling Across technique. For example, when asked for net sales and cumulative sales by year and brand, a well-structured query would look like this:
Compute total sales by year and brand.
Compute total returns by year and brand.
Join these results on year and brand.
Calculate net sales as [Total Sales] - [Total Returns].
Calculate cumulative Sales
Most LLMs generated a similar approach. Some required a hint (“don’t ever join fact to fact”), but the biggest issue was the final join. Many models defaulted to a LEFT JOIN, which is problematic—some returns for a brand might not occur in the same period as the sales, leading to incomplete results.
That said, some models got it right on the first attempt, which was very impressive. something like this:
WITH sales AS (
    SELECT
        d.d_year,
        i.i_brand,
        SUM(s.ss_sales_price * s.ss_quantity) AS total_sales
    FROM store_sales s
    JOIN item i ON s.ss_item_sk = i.i_item_sk
    JOIN date_dim d ON s.ss_sold_date_sk = d.d_date_sk
    GROUP BY d.d_year, i.i_brand
),
returns AS (
    SELECT
        d.d_year,
        i.i_brand,
        SUM(r.sr_return_amt) AS total_returns
    FROM store_returns r
    JOIN item i ON r.sr_item_sk = i.i_item_sk
    JOIN date_dim d ON r.sr_returned_date_sk = d.d_date_sk
    GROUP BY d.d_year, i.i_brand
)
SELECT
    COALESCE(s.d_year, r.d_year) AS year,
    COALESCE(s.i_brand, r.i_brand) AS brand,
    COALESCE(s.total_sales, 0) AS total_sales,
    COALESCE(r.total_returns, 0) AS total_returns,
    (COALESCE(s.total_sales, 0) - COALESCE(r.total_returns, 0)) AS net_sales,
    SUM(COALESCE(s.total_sales, 0) - COALESCE(r.total_returns, 0))
        OVER (PARTITION BY COALESCE(s.i_brand, r.i_brand) ORDER BY COALESCE(s.d_year, r.d_year)
        ROWS BETWEEN UNBOUNDED PRECEDING AND CURRENT ROW) AS cumulative_net_sales
FROM sales s
FULL OUTER JOIN returns r
ON s.d_year = r.d_year AND s.i_brand = r.i_brand
ORDER BY COALESCE(s.i_brand, r.i_brand), COALESCE(s.d_year, r.d_year);
An Alternative Approach: UNION ALL
One LLM got creative and proposed a different solution using UNION ALL:
WITH combined AS (
    SELECT d.d_year, i.i_brand, 'sales' AS type, s.ss_sales_price * s.ss_quantity AS amount
    FROM store_sales s
    JOIN date_dim d ON s.ss_sold_date_sk = d.d_date_sk
    JOIN item i ON s.ss_item_sk = i.i_item_sk
    UNION ALL
    SELECT d.d_year, i.i_brand, 'returns' AS type, r.sr_return_amt AS amount
    FROM store_returns r
    JOIN date_dim d ON r.sr_returned_date_sk = d.d_date_sk
    JOIN item i ON r.sr_item_sk = i.i_item_sk
)
SELECT
    d_year AS year,
    i_brand AS brand,
    SUM(CASE WHEN type = 'sales' THEN amount ELSE 0 END) AS total_sales,
    SUM(CASE WHEN type = 'returns' THEN amount ELSE 0 END) AS total_returns,
    (SUM(CASE WHEN type = 'sales' THEN amount ELSE 0 END) - SUM(CASE WHEN type = 'returns' THEN amount ELSE 0 END)) AS net_sales,
    SUM(SUM(CASE WHEN type = 'sales' THEN amount ELSE 0 END) - SUM(CASE WHEN type = 'returns' THEN amount ELSE 0 END))
        OVER (PARTITION BY i_brand ORDER BY d_year ROWS BETWEEN UNBOUNDED PRECEDING AND CURRENT ROW) AS cumulative_net_sales
FROM combined
GROUP BY d_year, i_brand
ORDER BY i_brand, d_year;
Edit : people who know what they are doing , did not like the union all solution for performance reason
So, Is SQL a Solved Problem?
No, of course not. There’s still no guarantee of getting the same answer when asking the same question multiple times. Additionally, AI has no real understanding of the data. The moment you introduce filters, you can get all sorts of unexpected results,Although Providing sample values from columns into a semantic model helps a lot, still real-world models are far more complex and often contain ambiguities.
While LLMs generate correct SQL, they don’t always generate the most efficient queries, But you can argue, it is the Database problem to solve 🙂
Compute Considerations
I don’t know enough to make a strong statement about the current cost of running LLMs, but I ran a simple experiment: I tested QWQ-32 on my laptop (which has an NVIDIA RTX A2000 GPU with 4GB of dedicated memory). The good news? It worked. Running an open-source “thinking model” on a personal laptop is already impressive. The bad news? It was painfully slow—so much so that I’m not eager to repeat the test.
From a practical perspective, generating SQL queries this way seems extremely expensive. A decent BI tool can generate similar queries in milliseconds, using orders of magnitude less compute power, but as LLMs continue to improve in efficiency, maybe in a couple of years, the compute requirement to generate SQL Queries will become trivial ?
Final Thoughts
Having experimented with LLMs since 2023, I can say with confidence that they have improved significantly ( LLMs in 2023 were not very good to be honest). They are getting better and, more importantly, cheaper, opening the door for new applications.
The initial promise was that you could just throw data at an AI system, and it would figure out everything. I suspect that’s not true. In reality, to get useful results, you need more structure, and well-defined semantic models will play a crucial role in making asking your Data a reality.
If you’re utilizing Microsoft Fabric and notice consistently high usage—perhaps averaging 90%—or experience occasional throttling, it’s a clear indication that you’re nearing your capacity limit. This situation could pose challenges as you scale your workload. To address this, you have three primary options to consider:
Upgrade to a Higher SKU Increasing your capacity by upgrading to a higher SKU is a straightforward solution, though it comes with additional costs. This option ensures your infrastructure can handle increased demand without requiring immediate changes to your workflows.
Optimize Your Workflows Workflow optimization can reduce capacity consumption, though it’s not always a simple task. Achieving meaningful improvements often demands a higher level of expertise than merely maintaining functional operations. This approach requires a detailed analysis of your processes to identify inefficiencies and implement refinements.
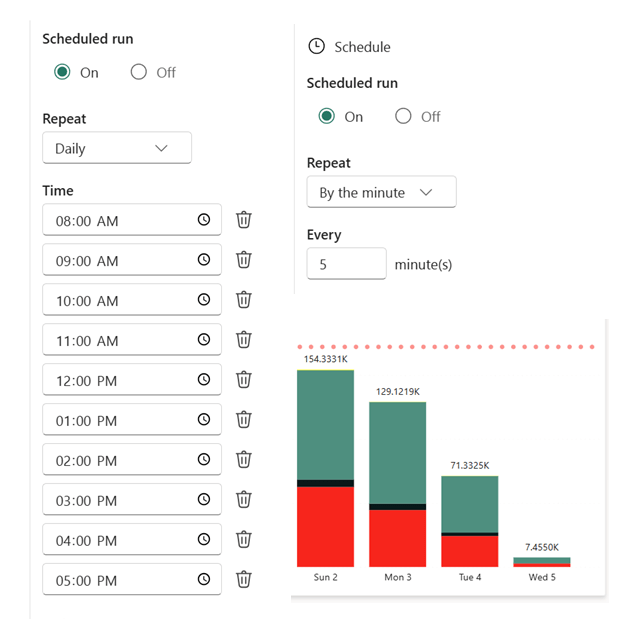
Reduce Data Refresh Frequency A practical and often overlooked option is to adjust the freshness of your data. Review the workflows consuming the most capacity and assess whether the current refresh rate is truly necessary. For instance, if a process runs continuously or frequently throughout the day, consider scheduling it to operate within a specific window—say, from 9 AM to 5 PM—or at reduced intervals. As an example, I adjusted a Python notebook that previously refreshed every 5 minutes to run hourly, limiting it to 10 executions per day. The results demonstrated a significant reduction in capacity usage without compromising core business needs.
8000 CU(s) total usage for a whole solution is just a bargain !!! Python Notebook and Onelake are just too good !!! the red bar is the limit of F2
Choosing the Right Path
If your organization has a genuine requirement for frequent data refreshes, reducing freshness may not suffice. In such cases, you’ll need to weigh the benefits of optimization against the simplicity of upgrading your SKU.