Microsoft Fabric lets you dynamically configure the number of vCores for a Python notebook session at runtime — but only when the notebook is triggered from a pipeline. If you run it interactively, the parameter is simply ignored and the default kicks in.
This is genuinely useful: you can right-size compute on a job-by-job basis without maintaining separate notebooks. A heavy backfill pipeline can request 32 cores; a lightweight daily refresh can get by with 2.
How It Works
Place a %%configure magic cell at the very top of your notebook (before any other code runs):
%%configure
{
"vCores":
{
"parameterName": "pipelinecore",
"defaultValue": 2
}
}
The parameterName field ("pipelinecore" here) is the name of the parameter you’ll pass in from the pipeline’s Notebook activity. The defaultValue is the fallback used when no parameter is provided — or when you run the notebook interactively.
Fabric supports vCore counts of 4, 8, 16, 32, and 64. Memory is allocated automatically to match.
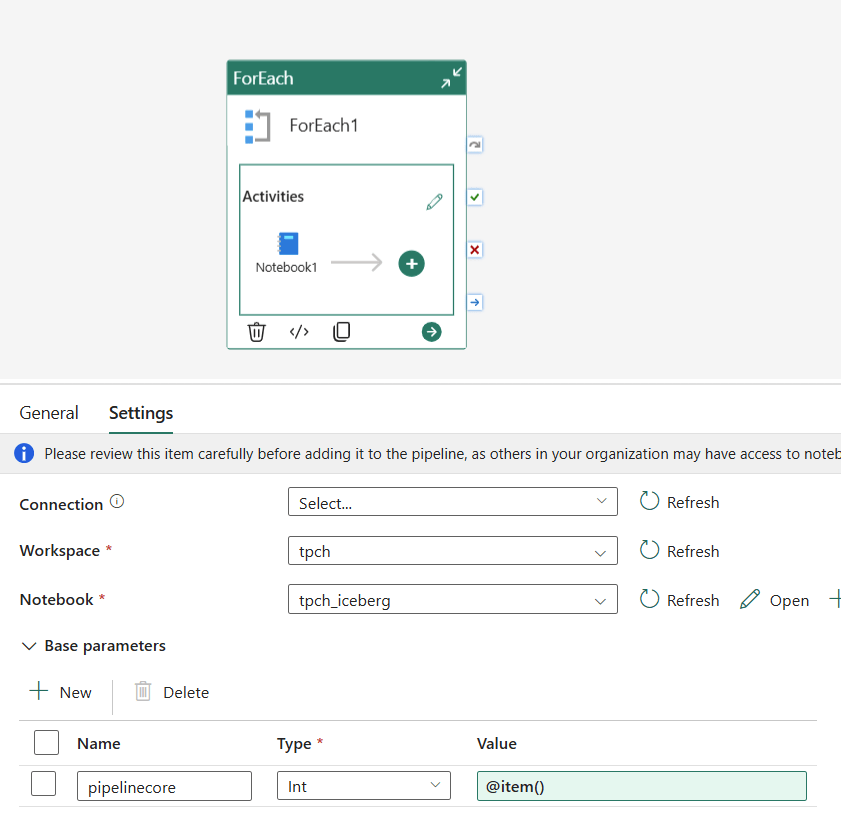
Wiring It Up in the Pipeline
In your pipeline, add a Notebook activity and open the Base parameters tab. Create a parameter named pipelinecore of type Int and set the value to @item().
When the pipeline runs, Fabric injects the value into %%configure before the session starts.
A Neat Trick: Finding the Right Compute Size
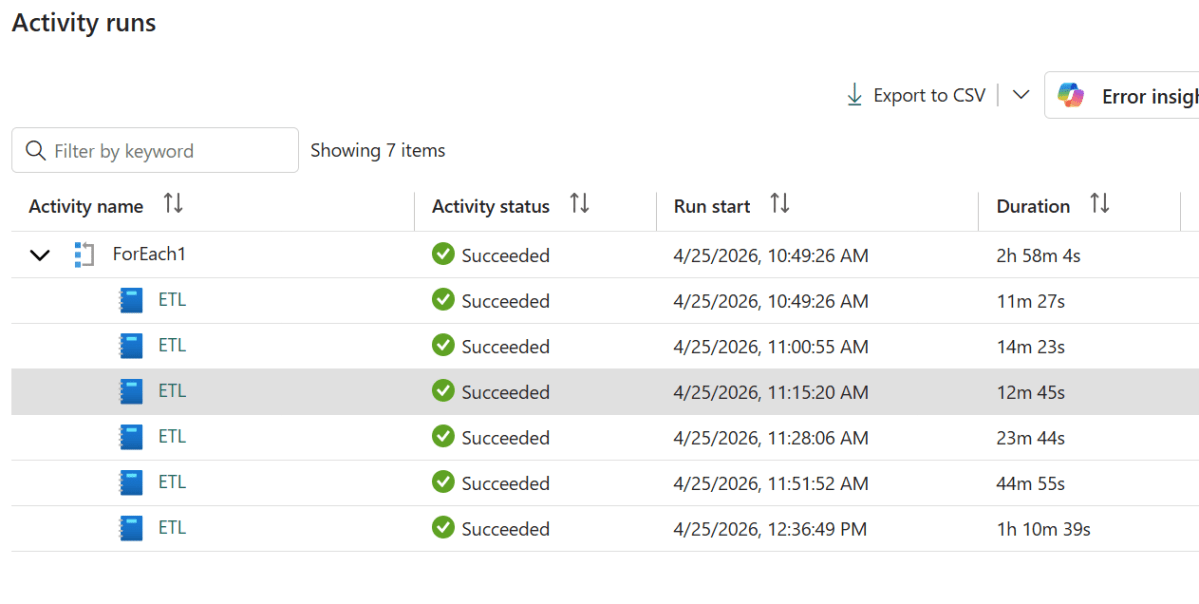
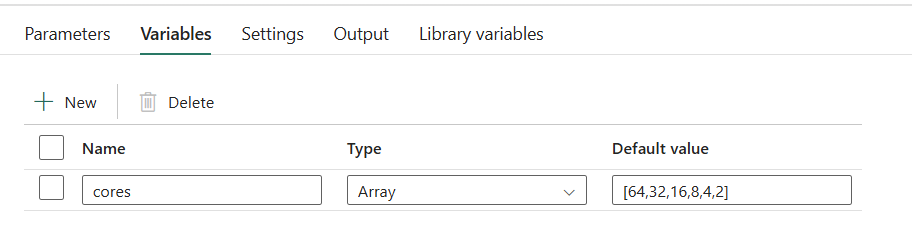
Because the vCore value is just a pipeline parameter, you can use a ForEach activity to run the same notebook across multiple core counts in sequence — great for benchmarking or profiling how your workload scales.
Set up a pipeline variable cores of type Array with a default value of [64,32,16,8,4,2]:
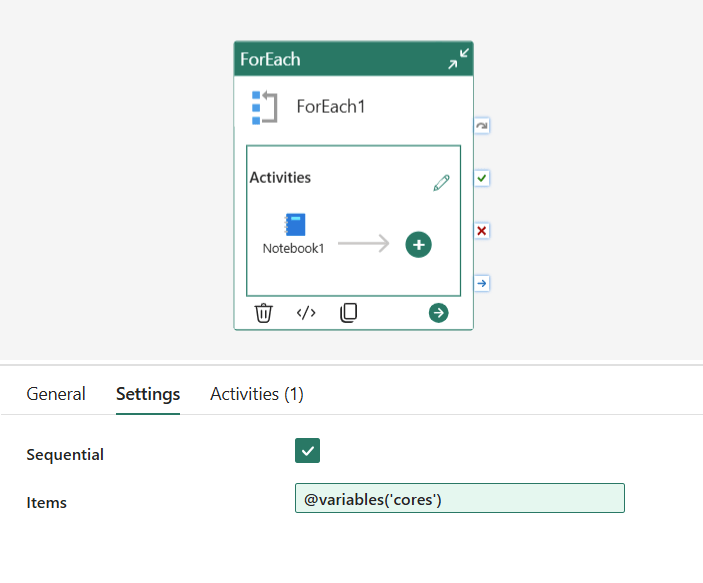
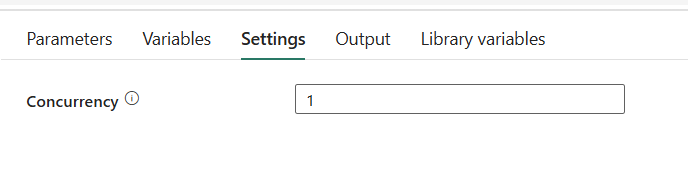
Then configure the ForEach activity with:
Items: @variables('cores')
Sequential: ✅ checked (so runs don’t overlap)
Concurrency: 1
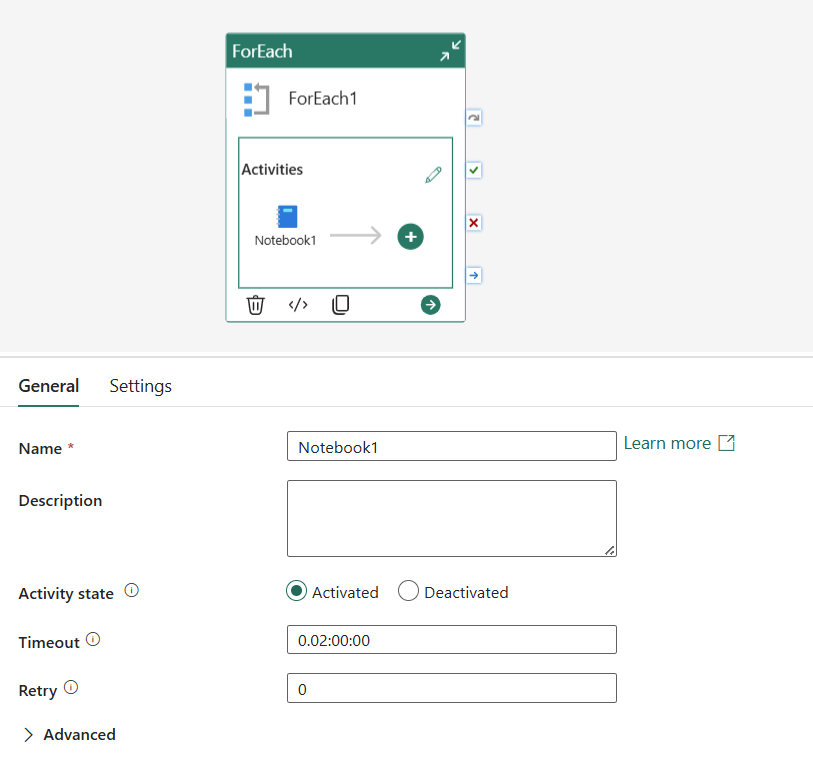
Inside the ForEach, add a Notebook activity and set the pipelinecore base parameter to @item(). Each iteration picks the next value from the array and passes it to the notebook, so you get a clean sequential run at 64, 32, 16, 8, 4, and 2 cores.
and of course the time, always change it to a more sensible value
What the Numbers Say
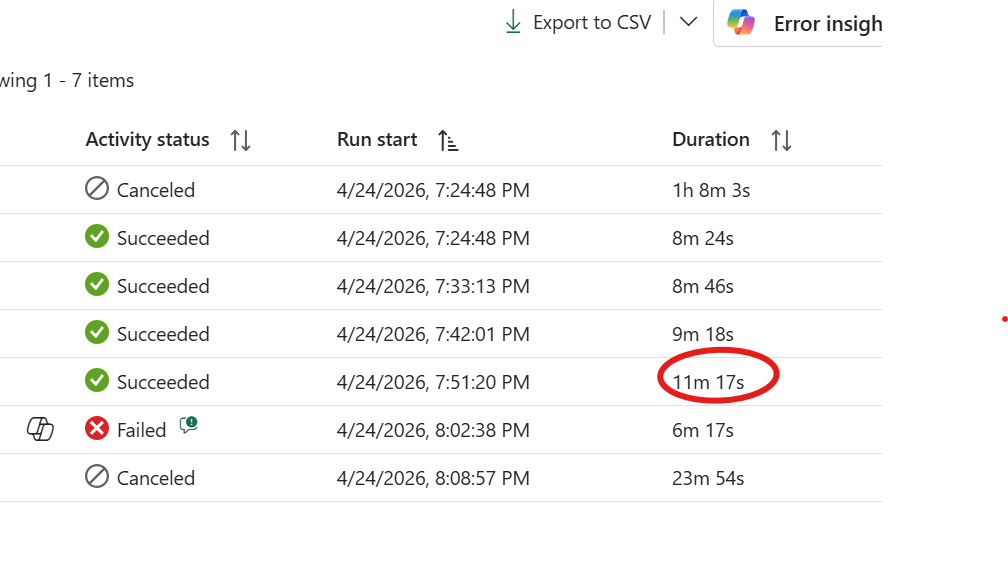
Running the previous workload across all supported core counts produced these results:
Cores
Duration
64
8m 24s
32
8m 46s
16
9m 18s
8
11m 17s
4
Failed
2
Canceled
The answer here is 8 cores. Yes, it’s about 2 minutes slower than 16 , but it’s half the compute. Going from 64 down to 8 cores costs you less than 3 minutes of runtime, which is a reasonable trade. Below 8 the workload simply falls apart. The sweet spot is not always the fastest run; it’s the point where adding more cores stops meaningfully improving the result.
btw for the CU consumption, the formula is very simple
nb of cores X 0.5 X active duration
Notice you will not be charged for startup duration.
Another Workload: 158 GB of CSV with DuckDB
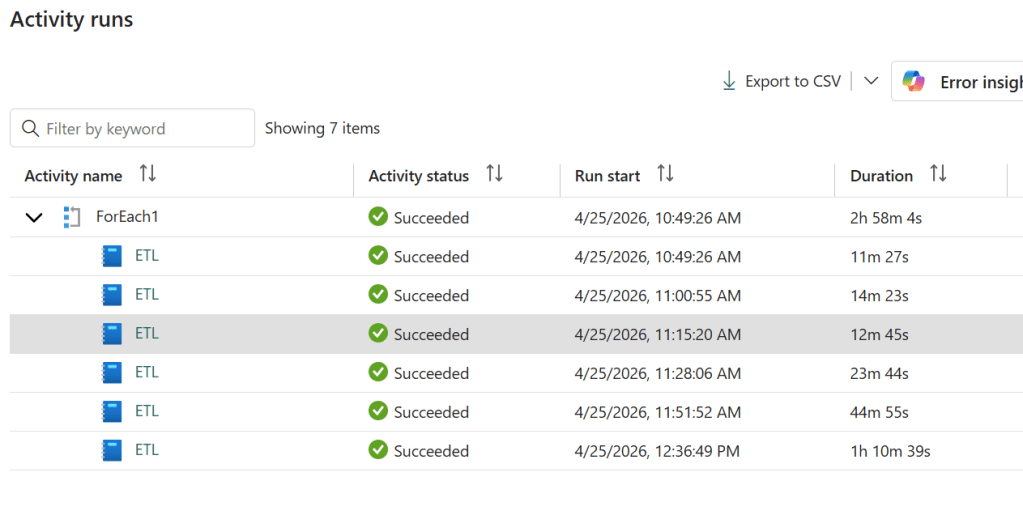
To make this concrete, here’s a second run — an ETL notebook processing 158 GB of CSV files using DuckDB 1.4.4, the default version available in the Fabric Python runtime.
I’d pick 16 cores here. The jump from 16 to 64 saves you barely a minute and a half — well within the noise, as 16 actually outran 32 in this test. Below 8 cores the runtime climbs steeply, roughly doubling at each step. The reason is that 158 GB of CSV is largely an I/O-bound workload: DuckDB parallelises reads aggressively, but at some point you’re just waiting on storage, not on CPU. More cores stop helping.
Two things worth noting. First, 2 cores completed the job — which is remarkable given that 2 cores comes with only 16 GB of RAM for a 158 GB dataset. DuckDB’s out-of-core execution handled it, but at 1h 10m it pushed close to the limit. And that brings up the second point: OneLake storage tokens have a lifetime of around one hour. A run that creeps past that boundary risks losing access mid-execution. For a workload this size, anything below 8 cores is probably not worth the gamble.
A Word of Caution: Startup Overhead
Before you start bumping up core counts, there’s an important trade-off to keep in mind: anything above 2 cores adds several minutes of python runtime just to provision the session — and that startup time is included in your total duration. For large, long-running workloads it barely registers. For small ones it can easily dominate the total run time.
And most real-world workloads are small. A daily incremental load, a lookup refresh, a small aggregation — these often complete in under a minute of actual computation. If the session startup costs you 3 minutes and the work itself costs 30 seconds, more cores aren’t helping.
The default of 2 cores starts fast and is the right choice for the majority of jobs. Reach for more only when you’ve measured that the workload actually benefits from it.
Beyond Benchmarking: Dynamic Resource Allocation
The benchmarking pattern is useful, but the more powerful idea is using this in production. Because the vCore count is just a number passed through the pipeline, nothing stops a first stage of your pipeline from deciding what that number should be.
Imagine a pipeline that starts by scanning a data lake to count the number of files or estimate the volume of data to process. Based on that output, it computes an appropriate core count and passes it to the notebook that does the actual work — 4 cores for a small daily increment, 32 for a full month’s backfill, 64 for a one-off historical load. The notebook itself doesn’t change; the compute scales to the workload automatically.
This kind of adaptive orchestration is normally something you’d build a lot of custom logic around. Here it’s just a parameter.
The Catch: Interactive Runs Use the Default
This only works end-to-end when triggered from a pipeline. Running the notebook manually in the Fabric UI will silently use the defaultValue — there’s no error, the parameter just won’t be overridden. Keep that in mind when testing.
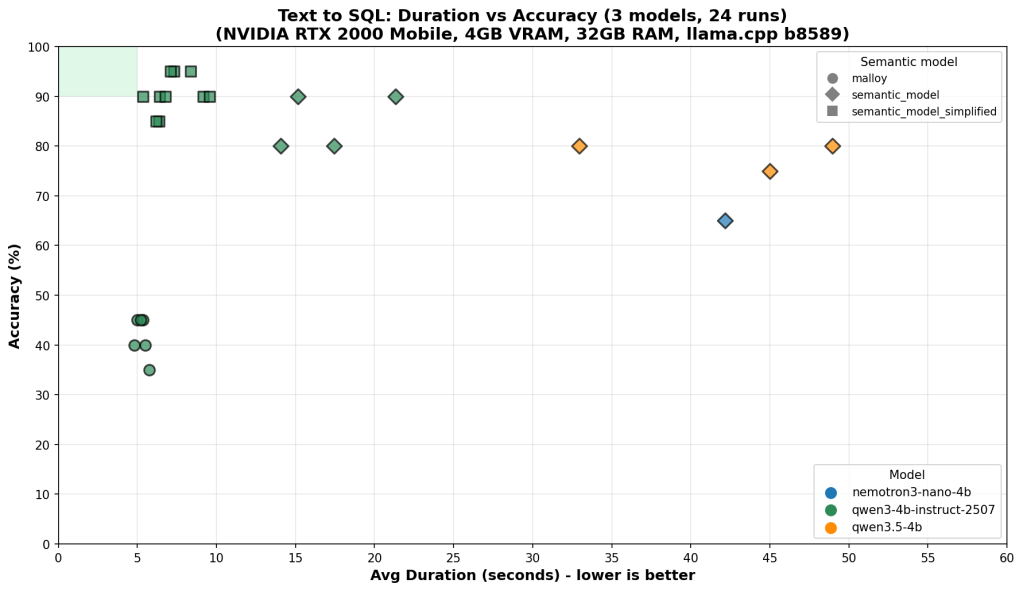
TL;DR : The high-end version of this problem is mostly solved. GPT-4 or Claude Opus paired with a mature proprietary semantic layer like Microsoft Power BI’s will handle natural language queries reliably in production, This blog is a much narrower use case: how do small language models (4B parameters, 4GB VRAM) perform when paired with open-source semantic layers? not great, not terrible as of April 2026 😦
Running a 4B model through an immature open-source semantic layer on a laptop GPU is not a production architecture — but it turns out to be a surprisingly useful lens for measuring fundamental SLM progress. How much reasoning capability fits in 4GB? How well do small models follow explicit constraints? Where do they break down under complexity?
Curiosity is a valid reason to run a benchmark. even for fun
The hardware constraint is real. An NVIDIA RTX A2000 Laptop has 4GB VRAM. Models above ~4GB Q4_K_M overflow into Windows virtual memory and run painfully slow. The practical ceiling is a 4B parameter model at Q4_K_M quantization.
The bet: give a small model a semantic model as its system prompt, and it should close the gap. Encode the domain knowledge — measure definitions, join rules, anti-patterns — so the model doesn’t have to infer them from a raw schema. Reduce the cognitive load, reduce the capability requirements, get closer to fast and correct.
On the benchmark chart, that target lives in a small green rectangle in the top-left corner: high accuracy, low latency. This post is about what it takes to reach it — and why we’re still not reliably there.
What the Tests Measure
20 questions, graded from trivial to genuinely hard. Every answer is judged by exact result matching: every row must be correct, column order ignored, 0.5% numeric tolerance for floating point aggregations. Partial credit doesn’t exist.
The easy end (Q1–Q5): total revenue, total quantity sold, list of store names. Any model that can read a schema gets these right.
The hard end (Q18–Q20):
Return rate broken down by customer age group × weekend/weekday flag, joined through two fact tables
Brand-level year-over-year return rate change filtered by store state
Average net sales per transaction by item class and customer preferred flag
These require correctly combining multiple joins, conditional aggregations, and derived measures — and producing results that exactly match the reference answer.
Each run is plotted as accuracy vs. average duration per question. Speed matters because on 4GB VRAM, model size and inference cost are real constraints, not theoretical ones.
Results
One experiment: strip the full YAML semantic model (31KB, two explicit fact tables, extensive field metadata) down to a simplified version (23KB, single logical model, reduced noise). Less token budget spent on metadata, more focus on the patterns that matter.
Results across 3 models × 3 semantic model variants, 24 total runs:
                         Accuracy     Speed      Consistency
qwen3-4b + full model    ~90%         ~10s       scattered
qwen3-4b + simplified    ~90–95%      ~5–8s      tight → green box
nemotron + either        40–85%       ~5–12s     high variance regardless
qwen3.5-4b               ~75–80%      ~45–55s    slow regardless
A capable LLM writing raw SQL can score well on individual runs — 90%+ accuracy on the best models. That sounds promising until you look at the consistency column. The same question, asked twice, can produce correct SQL one run and wrong SQL the next. That variance doesn’t go away with better prompting — it’s a fundamental property of using a probabilistic model for a deterministic task.
Simplifying the semantic model helped the strongest model converge into the green box — higher accuracy, faster, more consistent. For weaker models, variance stayed high regardless of which semantic model they received. The bottleneck had shifted from context quality to model capability.
You cannot simplify your way past a capability ceiling.
Why Raw LLM Breaks
The failure patterns are specific and instructive.
The CTE + FULL OUTER JOIN pattern. The semantic model is explicit: never join the two fact tables (store_sales and store_returns) directly. Always aggregate each separately in a CTE, then combine with FULL OUTER JOIN. Direct joins cause row multiplication. When a model gets this wrong, the result looks plausible — same columns, similar numbers — but every figure is wrong. Models violate this more than you’d expect, especially when the question doesn’t obviously signal that two fact tables are involved.
-- Wrong: direct join multiplies rows
SELECT s.s_store_name, SUM(ss_sales_price * ss_quantity) as total_sales,
SUM(sr_return_amt) as total_returns
FROM store_sales ss
JOIN store_returns sr ON ss.ss_item_sk = sr.sr_item_sk
JOIN store s ON ss.ss_store_sk = s.s_store_sk
GROUP BY s.s_store_name;
-- Right: aggregate each fact separately, then join the summaries
WITH sales AS (
SELECT ss_store_sk, SUM(ss_sales_price * ss_quantity) as total_sales
FROM store_sales GROUP BY ss_store_sk
),
returns AS (
SELECT sr_store_sk, SUM(sr_return_amt) as total_returns
FROM store_returns GROUP BY sr_store_sk
)
SELECT s.s_store_name,
COALESCE(sales.total_sales, 0),
COALESCE(returns.total_returns, 0)
FROM store s
LEFT JOIN sales ON s.s_store_sk = sales.ss_store_sk
LEFT JOIN returns ON s.s_store_sk = returns.sr_store_sk;
Literal instructions ignored. Q9 requires the raw flag values as group labels: 'Y' and 'N', not 'Preferred' and 'Non-Preferred'. The semantic model says this explicitly. LLMs substitute human-readable labels anyway — not because they misread the instruction, but because “Preferred / Non-Preferred” is the more natural output. The model understood what you wrote. It decided it knew better.
These failures share a structure: the semantic model content is correct, but LLM use of it is unreliable. The context is a hint, not a guarantee. You cannot build a production analytics system on a component whose failure modes are unpredictable. Reliability requires a deterministic layer — a compiler that enforces the patterns, not a model that may or may not follow them.
The Right Architecture: LLM Intent + Deterministic Compilation
The right split between LLM and algorithm is this: use the LLM for what only an LLM can do, and use deterministic code for everything else.
Natural language understanding is irreducibly fuzzy — only the LLM can map “show me underperforming stores last quarter” to the right intent. But once that intent is expressed as a structured query, everything downstream is deterministic. The join logic, the measure definitions, the SQL generation — these are mechanical translations that a compiler does perfectly, every time, for free. Running them through an LLM instead wastes token budget on a task that doesn’t need intelligence, while leaving less capacity for the task that does.
The ideal split: the LLM translates natural language into a compact domain-specific query expression. The compiler translates that into SQL. The LLM never touches raw schema column names; the compiler never sees ambiguous natural language.
A query compiler is the right architecture for this problem. It’s deterministic: the same query gives the same answer every time. It enforces join logic and measure definitions by construction, not by suggestion. You can build systems around deterministic limitations. You cannot build systems around random failures.
The DSL the LLM targets doesn’t need to be as simple as SELECT measure FROM model GROUP BY dimension. Users ask for year-over-year comparisons, cohort breakdowns, conditional aggregations — the DSL has to be expressive enough to capture these. But “expressive enough for analytics” is still a far smaller language than SQL. The LLM has a much easier job expressing intent in a constrained, familiar DSL than generating arbitrarily complex raw SQL correctly every time.
Why Open-Source Compilers Aren’t There Yet
The current open-source implementations just aren’t there yet.
Fact-first structural limitations. Most open-source semantic layers are fact-first by design: all queries anchor to the fact table. “List all stores” should return 8 stores. Running through boring-semantic-layer, it returns 6 — stores with no sales are excluded because they have no fact rows. This is not an edge case; it breaks a whole category of queries that any real analytics system must handle. (see example here: boring-semantic-layer #224) Dimension-first routing — queries that go directly to dimension tables when no fact aggregation is needed — is a fundamental capability gap.
Niche query languages. Malloy compiles high-level queries to SQL — the LLM writes Malloy, the compiler handles join logic. In theory this is exactly right: offload SQL generation to a trusted compiler, let the LLM express what to compute. In practice, LLMs have seen enormous amounts of SQL during training and almost no Malloy. Syntax errors were common, measure references wrong. The compiler generated correct SQL from correct Malloy — but getting correct Malloy out of the LLM was harder than getting correct SQL directly.
The proprietary proof that this architecture is buildable: Microsoft Power BI’s query planner handles multi-fact joins, period-over-period comparisons, and dimension-first routing reliably, backed by years of engineering investment. The open-source ecosystem isn’t there yet — and there’s no guarantee it gets there. The commercial incentive that drove Power BI and Looker to solve these problems doesn’t exist for open-source projects in the same way.
The Ceiling Is Implementation Quality
The semantic model doesn’t need to pre-declare every possible query pattern — that’s the point of having an LLM in the loop. “Sales performance in 2020 vs 2021” should be composable: the SLM reads the base measures (total_sales, date_dim keys, grain definitions) and constructs the year-over-year logic itself. Multi-period comparisons, cohort filters, conditional aggregations — these should emerge from creative composition of well-defined primitives, not from an ever-growing library of pre-baked templates. The semantic model’s job is to define what things mean; the SLM’s job is to figure out how to combine them. When that division holds, the system is genuinely expressive. When it breaks down — when the SLM can’t compose reliably from primitives.
Query planner quality degrades fast once you move beyond simple aggregations. The moment you introduce measures that ignore filter context — MAX(date) computed across the full table regardless of what the user filtered — the planner has to reason about predicate pushdown, materialization order, and query cost. A naive planner gets this wrong silently: it scans everything, computes the max, then filters afterward. A recent semi-proprietary semantic layer ( which should remain nameless), supposedly mature, did exactly this on a simple max date ignore filter measure , a sub-second query became a 30-second full table scan.
Where This Goes
There are two truths that can coexist here.
On one side, models are clearly improving. Techniques like aggressive quantization are delivering more reasoning capability within tight resource constraints, making smaller deployments increasingly viable. At the same time, the architectural pattern of separating LLM intent from deterministic compilation is sound. It reflects how the most reliable production systems are built today. In that sense, the open source ecosystem is moving in the right direction, even if current implementations are still maturing.
On the other side, there is a meaningful gap between something being buildable and being built correctly. That gap is easy to underestimate. What looks like a working system often breaks down under real-world conditions: edge cases, ambiguous semantics, inconsistent schemas, and the need for cost-aware execution planning.
Bridging that gap is not just a matter of better ideas. It requires depth. Years of iteration, careful handling of corner cases, and continuous refinement of query planning and semantic layers. Systems like Power BI or Looker did not arrive there by accident. They reflect sustained, focused investment in exactly these problems.
Whether the open source ecosystem will reach that same level of depth remains an open question. It is not a question of capability or intent, but of coordination, time, and sustained effort across a fragmented landscape.
So the current state is this: the architecture is directionally correct, but the hardest parts are still unresolved, and progress on those parts is inherently slow.
Edit: There is also a credible alternative trajectory. If smaller language models continue to improve, direct SQL generation may become reliable enough for a large class of use cases. In that world, the need for a semantic query compiler does not disappear, but it becomes less central, reserved for cases where correctness, governance, or performance guarantees truly matter.
Microsoft Fabric now has a proper CLI deploy, and it works. I built a fully automated CI/CD pipeline that deploys a Python notebook, Lakehouse, Semantic Model, and Data Pipeline to Fabric using nothing but the fab CLI and GitHub Actions. Here’s what I learned along the way , what works great, what to watch out for, and where a few small additions could make the experience even better.
The Blog and the code was written by AI, to be clear, Fabric had always excellent API. and I perosnally used adhoc pythion script to deploy, but this time, it feels more natural
maybe the main take away when working with Agent and writing python code, logs everything including API response specially at the begining, AI is very good at autocorrecting !!!
The Goal
Push to main or production, and everything deploys automatically:
A Lakehouse gets created (with schemas enabled)
A Python Notebook gets deployed and attached to the Lakehouse (dbt need local path)
The notebook’s supporting files get copied to OneLake
The notebook runs — transforming data and creating Delta tables
A Direct Lake Semantic Model gets deployed (pointing at those Delta tables)
A Data Pipeline gets deployed and scheduled on a cron
Each Fabric item lives in a folder named {displayName}.{ItemType} under fabric_items/. The deploy script discovers them dynamically — no hardcoded item names.
What Works Well
The fab deploy command is brand new — v1.5.0, March 12, 2026. For a tool that just shipped, two things stood out.
Native .ipynb Support for Notebooks
Fabric’s default Git format for notebooks is notebook-content.py — a custom FabricGitSource format that flattens your notebook into a single .py file with metadata comments. It’s fine for Git diffs, but you lose the cell structure, can’t preview outputs, and can’t use standard Jupyter tooling to edit it.
As of Fabric CLI v1.4.0 (February 2026), you can now deploy notebooks as standard .ipynb files. Before v1.4.0, the CLI only supported the .py format.
With .ipynb support, what you see in VS Code or Jupyter is exactly what gets deployed:
fabric_items/
run.Notebook/
.platform
notebook-content.ipynb # standard Jupyter format, deployed as-is
You can edit notebooks locally with proper cell boundaries, use Jupyter tooling, and the deploy just works. Notebooks are finally first-class citizens in the deployment story.
model.bim Is Beautifully Simple
Fabric supports two formats for Semantic Models: TMDL (a folder of .tmdl files, one per table — the default) and TMSL (a single model.bim JSON file). TMDL is better for Git diffs on large models. But for my use case, model.bim is perfect.
One file. Everything in it — tables, columns, measures, relationships, and the Direct Lake connection. The entire environment-specific configuration boils down to a single OneLake URL:
Two GUIDs. That’s it. Swapping environments is a two-line string replacement:
bim_path.write_text(
bim_text.replace(source_ws_id, WS_ID)
.replace(source_lh_id, target_lh_id)
)
Compare this to the pipeline, where you’re hunting through deeply nested JSON paths with fab set. The BIM format is refreshingly straightforward.
The deploy works perfectly with just Python string replacement — three lines of code and a git checkout to restore.
TMSL (model.bim) vs TMDL: Which Format for CI/CD?
Fabric supports two formats for Semantic Models, and this choice matters more than it might seem.
TMDL is the default. It splits your model into a folder of .tmdl files — one per table, plus separate files for relationships, the model definition, and the database config:
definition/
├── tables/
│ ├── dim_calendar.tmdl
│ ├── dim_duid.tmdl
│ └── fct_summary.tmdl
├── relationships.tmdl
├── model.tmdl
└── database.tmdl
TMSL is a single model.bim JSON file with everything in it.
For CI/CD pipelines, TMSL wins hands down. Here’s why:
One file to manage. Your deploy script reads one file, replaces two GUIDs, deploys, and runs git checkout to restore. With TMDL, you’d need to find which .tmdl file contains the OneLake URL and handle multiple files.
Two .replace() calls. The entire environment swap is two string replacements on one file. With TMDL, the connection expression lives in model.tmdl, but table definitions reference it indirectly — more files to reason about during deployment.
Easier to grep and debug. When something goes wrong with your Direct Lake connection, you open one file, search for the OneLake URL, and see everything. No jumping between files.
When TMDL makes more sense:
Large models with dozens of tables where multiple people edit measures and columns — per-file Git diffs are cleaner and merge conflicts are smaller
Teams using Tabular Editor who need reviewable PRs on individual table changes
Models that change frequently at the table level
But if your semantic model is authored once and deployed across environments — which is the typical CI/CD pattern — you’re not reviewing table-level diffs. You’re swapping two GUIDs and pushing. TMSL keeps it simple.
I chose model.bim and haven’t looked back.
Things to Know Before You Start
Lesson 1: Deploy Order Matters — A Lot
This was my biggest source of failed deployments. Fabric items have implicit dependencies, and deploying them out of order causes cryptic failures.
The correct sequence:
Lakehouse → Notebook → (run notebook) → Semantic Model → Data Pipeline
Why this specific order:
The Notebook needs a Lakehouse to attach to. If the Lakehouse doesn’t exist yet, the attachment step fails.
The Semantic Model uses Direct Lake mode, which validates that the Delta tables it references actually exist. If you deploy the model before running the notebook that creates those tables, validation fails.
The Data Pipeline references the Notebook by ID. You need the Notebook deployed first to get its target workspace ID.
# 5. Deploy Semantic Model (Delta tables now exist)
# 6. Refresh Semantic Model via Power BI API
# 7. Deploy + schedule Data Pipeline
Lesson 2: fab job run Does Nothing for Notebooks Without -i '{}'
This one cost me hours of debugging. Running a notebook via the CLI:
# Does NOTHING — silently succeeds but notebook never executes
fab job run prod.Workspace/run.Notebook
# Actually runs the notebook
fab job run prod.Workspace/run.Notebook -i '{}'
Notebooks require the -i '{}' flag (empty JSON input). Without it, the command returns success but the notebook never fires. There’s no error, no warning — it just silently does nothing.
Lesson 3: parameter.yml Token Replacement Is Surprisingly Limited
Fabric CLI has a parameter.yml mechanism for replacing GUIDs across environments. The idea is great — use tokens like $workspace.id and $items.Lakehouse.data.$id that get resolved at deploy time.
In practice, the rules are strict and poorly documented:
Tokens only resolve if the entire value starts with $
# WRONG — token is embedded in a URL, never resolves
The pattern: modify → deploy → git restore. No token resolution needed.
Lesson 4: item_types_in_scope Must Be Plural
The deploy config YAML key is item_types_in_scope (plural). Use the singular item_type_in_scope and Fabric CLI silently ignores it — deploying everything in your repository directory instead of just the types you specified.
# CORRECT
item_types_in_scope:
- Notebook
- Lakehouse
# WRONG — silently deploys ALL item types
item_type_in_scope:
- Notebook
This is the kind of bug that only shows up in production when your Semantic Model gets deployed before your Delta tables exist.
Lesson 5: New Lakehouses Need a Provisioning Wait
Creating a Lakehouse returns immediately, but the underlying infrastructure isn’t ready yet:
result = subprocess.run(["fab", "create", LAKEHOUSE, "-P", "enableSchemas=true"])
if result.returncode == 0:
# Brand new lakehouse — need to wait for provisioning
print("Waiting 60s for provisioning...")
time.sleep(60)
On first deploy to a new workspace, this 60-second wait is essential. Without it, subsequent operations (deploying items, copying files) fail with opaque errors.
Lesson 6: Attaching a Lakehouse to a Notebook Requires fab set
Deploying a notebook doesn’t automatically connect it to a Lakehouse. You need a separate fab set call:
The JSON path is deeply nested and not well documented. I had to inspect the API responses to find the correct path: definition.parts[0].payload.metadata.dependencies.lakehouse.
Lesson 7: Semantic Model Refresh Uses the Power BI API, Not the Fabric API
After deploying a Direct Lake semantic model, you need to trigger a refresh. But this isn’t a Fabric API call — it’s a Power BI API call:
# Note the -A powerbi flag — this targets the Power BI API endpoint
fab api -A powerbi -X post "groups/{workspace_id}/datasets/{model_id}/refreshes"
Without the -A powerbi flag, you’ll get 404s because the Fabric API doesn’t have a refresh endpoint for semantic models.
Lesson 8: Pipeline References Are Hardcoded GUIDs
A Data Pipeline that runs a notebook stores the notebook’s ID and workspace ID as hardcoded GUIDs in its definition:
fab auth login -t ${{ secrets.AZURE_TENANT_ID }} \
-u ${{ secrets.AZURE_CLIENT_ID }} \
--federated-token "$FED_TOKEN"
This means no client secrets to rotate — just configure the Azure AD app registration to trust your GitHub repo’s OIDC issuer. It works well, but you still need to set up an Azure AD app registration, configure federated credentials, and grant it Fabric permissions. It would be nice if Fabric supported direct service-to-service authentication — something like a Fabric API key or a native GitHub integration — without needing Azure as the intermediary.
Lesson 10: Use Variable Libraries for Runtime Config
Instead of baking config values into your notebook or using parameter.yml, Fabric has Variable Libraries:
This makes your notebook fully portable — the same code runs everywhere:
Local dev: swap to a local path or Azurite connection
Deployed to staging: notebookutils resolves to the staging workspace/lakehouse IDs
Deployed to production: same code, different IDs at runtime
The alternative — hardcoding workspace names or using /lakehouse/default/ mount paths — ties your notebook to a specific workspace. With abfss://, the notebook doesn’t care where it’s running. The IDs come from the runtime context, and the deploy script handles attaching the right Lakehouse. Zero code changes between environments.
Lesson 12: Copying Files to OneLake Is Parallel but Slow
The notebook needs supporting files (SQL models, configs) available in OneLake. The fab cp command handles this, but it’s one file at a time. I parallelized with 8 workers:
with ThreadPoolExecutor(max_workers=8) as executor:
executor.map(copy_file, files)
Before copying files, you need to create the directory structure with fab mkdir. OneLake doesn’t auto-create parent directories.
Lesson 13: Schedule Idempotently
Don’t recreate the pipeline schedule every deploy — check first:
result = subprocess.run(["fab", "job", "run-list", PIPELINE, "--schedule"],
capture_output=True, text=True)
if "True" not in result.stdout:
fab(["job", "run-sch", PIPELINE,
"--type", "cron",
"--interval", cfg["schedule_interval"],
"--start", cfg["schedule_start"],
"--end", cfg["schedule_end"],
"--enable"])
This prevents duplicate schedules stacking up across deploys.
The Big Picture
Here’s the overall architecture in one diagram:
GitHub Push
│
▼
GitHub Actions (OIDC → fab auth login)
│
▼
deploy.py
├── fab create → Lakehouse (with schemas)
├── fab deploy → Notebook
├── fab set → Attach Lakehouse to Notebook
├── fab cp → Copy data files to OneLake (8 parallel workers)
├── fab job run → Execute Notebook (creates Delta tables)
├── fab deploy → Semantic Model (with GUID replacement + git restore)
├── fab api → Refresh Semantic Model (Power BI API)
├── fab deploy → Data Pipeline
├── fab set → Update Pipeline notebook/workspace refs
└── fab job run-sch → Schedule Pipeline (if not already scheduled)
Everything is driven by a single deploy_config.yml that maps branch names to workspace IDs:
defaults:
schedule_interval: "30"
schedule_start: "2025-01-01T00:00:00"
schedule_end: "2030-12-31T23:59:59"
main:
ws_id: "e446a5e7-..."
schedule_interval: "720" # 12 hours (staging)
production:
ws_id: "be079b0f-..."
download_limit: "60" # full data
Push to main → deploy to staging workspace. Push to production → deploy to production workspace.
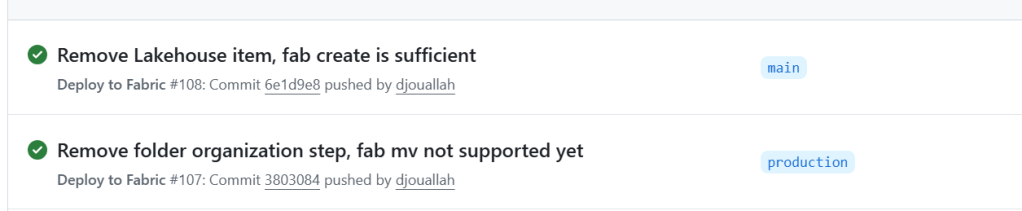
Lesson 14: Don’t Deploy the Lakehouse Item — Let the Data Define the Schema
I had a data.Lakehouse/ folder in fabric_items/ with a .platform file and a lakehouse.metadata.json that just set defaultSchema: dbo. I was running fab deploy for it. Then I realized: I was already creating the Lakehouse with fab create before the deploy step:
fab create "prod.Workspace/data.Lakehouse" -P enableSchemas=true
The fab create handles everything. The fab deploy of the Lakehouse item was redundant.
But there’s a deeper point here: the Lakehouse schema should be driven by your data, not by CI/CD. Your notebook creates the tables, your data transformation defines the schemas. The Lakehouse is just the container — it doesn’t need a deployment definition. Trying to manage Lakehouse schema through fab deploy is fighting the natural flow. Create the container, let the data populate it.
I deleted the entire data.Lakehouse/ folder from my repo. One less item to deploy, one less thing to break.
What I’d Tell My Past Self
Read every fab CLI error message carefully. Many failures are silent (wrong key name, missing -i flag). Add verbose logging.
Deploy in phases, not all at once. Item dependencies are real and the error messages when you get the order wrong are unhelpful.
Skip parameter.yml for anything non-trivial. Direct GUID replacement in Python with git restore is simpler and fully transparent.
fab set is the power tool. Most post-deploy configuration — attaching lakehouses, updating pipeline references — goes through deeply nested JSON paths in fab set.
Test in a separate workspace mapped to a non-production branch. The deploy_config.yml pattern of mapping branches to workspaces makes this trivial.
The Power BI API and Fabric API are different surfaces. Some operations (like semantic model refresh) only exist on the Power BI side. Use fab api -A powerbi.
Don’t deploy what you don’t need to. If fab create handles it, drop the item definition. Let your data drive the schema.
The Fabric CLI is new — fab deploy landed in v1.5.0 just this month — and it already handles a full end-to-end deployment pipeline. The foundation is solid. Everything you need is already there — it just takes knowing where to look. Hopefully this saves you some of that discovery time.
Acknowledgements
Special thanks to Kevin Chant — Data Platform MVP and Lead BI & Analytics Architect — whose blog has been an invaluable resource on Fabric CI/CD and DevOps practices for the data platform. If you’re working with Fabric deployments, his posts are well worth following.
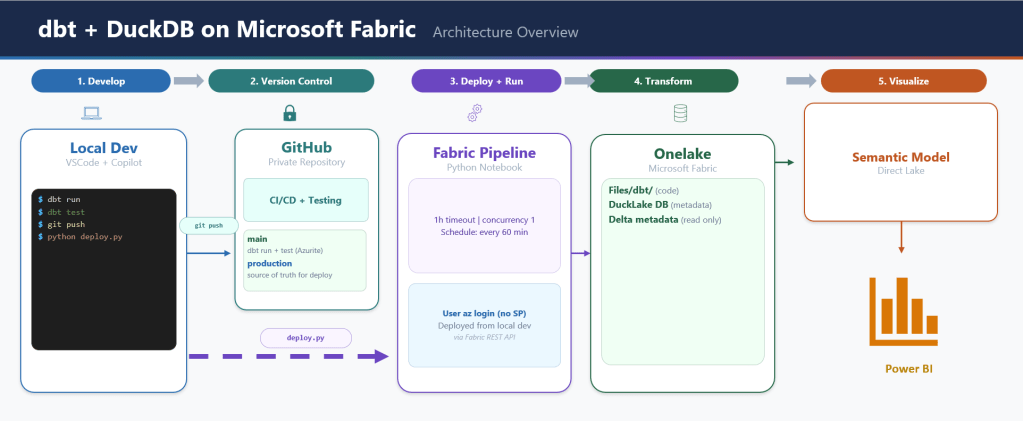
A complete data pipeline running on Microsoft Fabric that downloads public data, transforms it into a star schema, exports it as Delta Lake tables, and serves it through a Power BI semantic model with Direct Lake — all from a single Python notebook and using pure SQL
DuckDB as the compute engine — could have been Polars or Lakesail, just a personal preference to be honest
dbt as the transformation framework
A Python script to deploy everything via Fabric REST API
GitHub for source control, documentation, and testing
Note: DuckDB is not officially supported by Microsoft Fabric. Every effort is made to ensure compatibility with OneLake.
Overall Architecture
Why DuckDB + Delta Export
Microsoft Fabric’s lakehouse uses Delta Lake or Apache Iceberg as its table format. Power BI’s Direct Lake mode reads the data directly from OneLake. So whatever engine you use, you need to produce Delta Lake files on OneLake.
DuckDB cannot write Delta Lake natively (it is experimental at this stage). It has its own table format via the DuckLake extension, but DuckLake writes Parquet files with a DuckDB/SQLite/PostgreSQL metadata catalog.
OneLake catalog has only Iceberg read support, so that’s not an option for now.
The solution: delta_export, a community DuckDB extension that exports DuckLake tables as Delta Lake. The pipeline works like this:
dbt transforms data into DuckLake tables (Parquet + metadata)
ducklake_rewrite_data_files and ducklake_merge_adjacent_files compact the Parquet files
CALL delta_export() converts every DuckLake table into a proper Delta Lake table on OneLake
Without delta_export, DuckLake is not useful in this context. DuckLake manages tables internally, but Fabric has no idea what a SQLite metadata catalog is. It needs Delta transaction logs.
DuckLake stores table metadata in a database and writes data as Parquet files to any storage backend (local, S3, Azure). The DuckDB connection looks like this:
METADATA_LOCAL_PATH points to /lakehouse/default/Files/metadata.db — the Files section of the OneLake lakehouse. In a Fabric notebook, /lakehouse/default/ is a local mount of the lakehouse storage. The SQLite file lives right there on OneLake, persisting across notebook runs without any special sync logic. data_path points to the Tables section on OneLake (abfss://...). DuckDB computes in memory, DuckLake tracks what’s in each table via SQLite, and Parquet files land on OneLake.
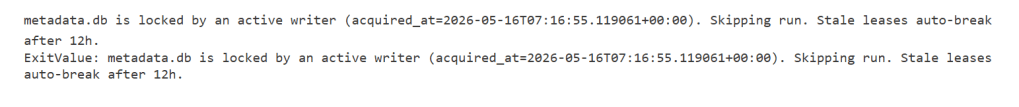
The single-writer limitation. DuckLake when used with a file-based DB is basically a single-writer architecture. Only one process can write to a DuckLake database at a time. This means:
No parallel pipeline runs
No concurrent notebooks writing to the same tables
The Fabric pipeline is set to concurrency: 1 specifically because of this
For this use case, it’s fine — one notebook runs every hour, processes new files, and exits. But if you need concurrent writers, DuckLake is not the right choice.
Edit – May 2026: Updated the pipeline to enforce a single writer at any time — accidental duplicate runs exit cleanly instead of racing. Thanks to OneLake exposing primitives like leases and mutexes, DuckLake’s single-writer model becomes a much more viable option in practice.
Obviously you can use PostgreSQL as a catalog, but that makes the architecture more complex.
dbt as the Orchestrator
dbt does everything here — not just transformations. The on-run-start hook downloads data from the web, archives it to OneLake, and tracks state in a parquet log. The on-run-end hook compacts files and exports Delta.
Fetching daily SCADA and price reports from AEMO’s website
Fetching intraday 5-minute dispatch data
Downloading generator reference data
Archiving everything as partitioned ZIPs on OneLake
Maintaining a csv_archive_log.parquet file for deduplication
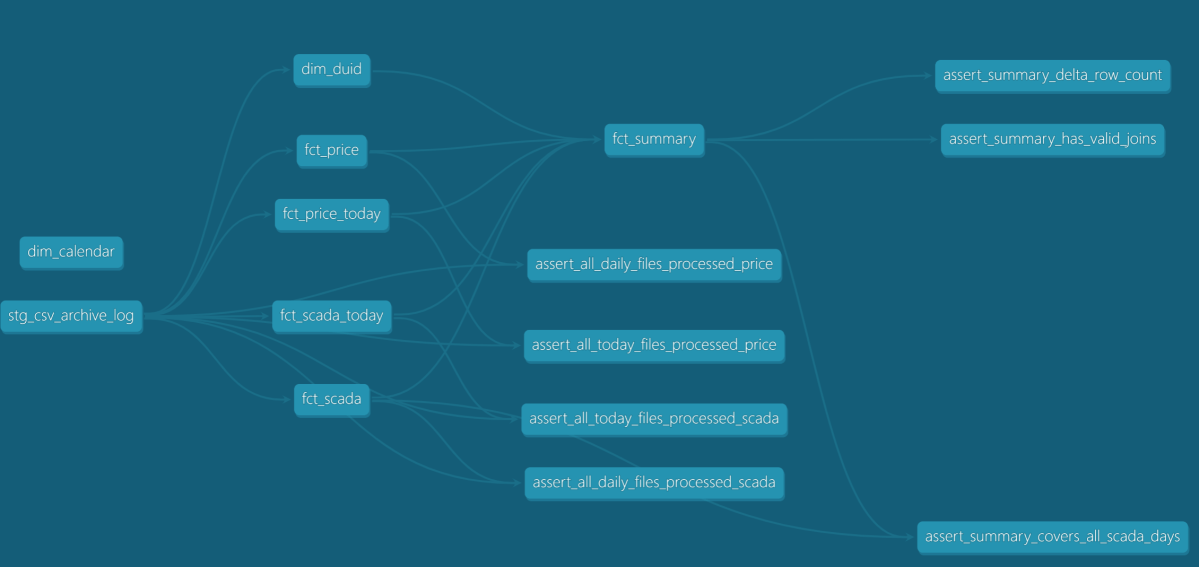
The 8 dbt models then process this data:
stg_csv_archive_log — view over the archive log
dim_calendar — date dimension (one-time load)
dim_duid — generator unit reference (smart refresh: only rebuilds when new generators appear)
fct_scada, fct_price — daily historical data, incremental by file
fct_scada_today, fct_price_today — intraday data, incremental by file
fct_summary — combined fact table exposed to Power BI
Every fact model uses file-based incremental processing. Pre-hooks query the archive log, filter out already-processed files, and set DuckDB VARIABLEs with the remaining ZIP paths. The model’s SQL reads from those paths. Next run, those files are skipped.
The Semantic Model: AI-Generated from Thin Air
This is the part that surprises me the most. The model.bim file — the Power BI semantic model definition — was generated entirely by AI (Claude). No Power BI Desktop. No click-through wizards. No SSDT.
The model.bim is a JSON file in TMSL (Tabular Model Scripting Language) format. It defines:
3 tables exposed to Power BI: dim_calendar, dim_duid, fct_summary
5 hidden tables (raw layer, not needed for reporting)
{{ONELAKE_URL}} is a placeholder. The deploy script substitutes it with the actual OneLake URL at deploy time.
Each table partition maps to a Delta table on OneLake:
{
"mode": "directLake",
"source": {
"type": "entity",
"entityName": "fct_summary",
"expressionSource": "DirectLake",
"schemaName": "aemo"
}
}
This maps to Tables/aemo/fct_summary/ — exactly where DuckLake + delta_export writes the Delta files.
AI generated all of this by reading the dbt schema definitions (column names, types, descriptions) and understanding the Direct Lake requirements. No manual TMSL authoring. No reverse engineering from Power BI Desktop. The entire semantic model is version-controlled, diffable, and deployable via API.
Poor Man CI/CD, No Service Principal
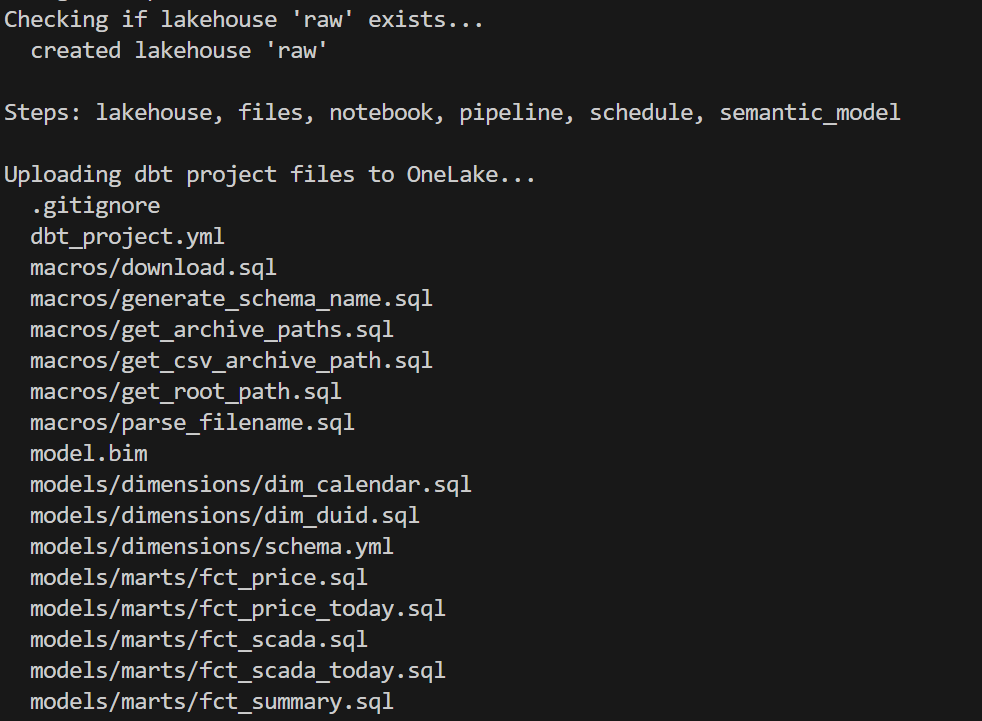
deploy_to_fabric.py is a single Python script that deploys everything to Fabric using the REST API. It has 6 steps:
lakehouse — Create the OneLake lakehouse (with schema support)
files — Upload all dbt project files to Files/dbt/
notebook — Create a 2-cell notebook (install deps + run dbt)
pipeline — Create a pipeline that runs the notebook
schedule — Set up hourly cron schedule
semantic_model — Deploy model.bim with Direct Lake config + refresh
You can run any subset: python deploy_to_fabric.py semantic_model deploys just the BIM.
Authentication uses az login — your browser opens, you sign in, done. The script reads from the production git branch (clones it into a temp directory) so what you deploy is always what’s been merged to production.
python deploy_to_fabric.py # deploy everything
python deploy_to_fabric.py semantic_model # just the semantic model
python deploy_to_fabric.py files notebook # just files + notebook
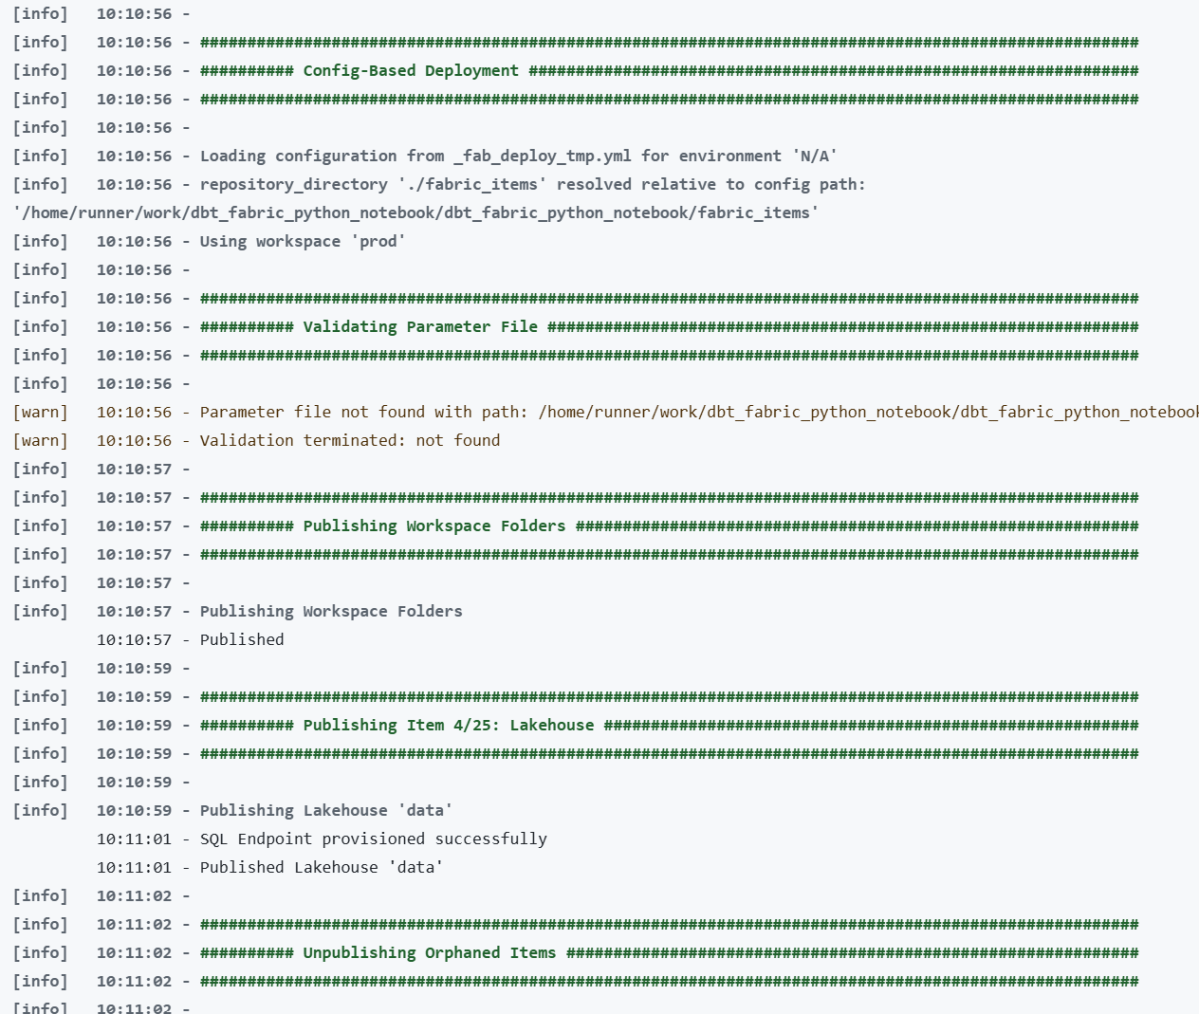
and here is the script in action
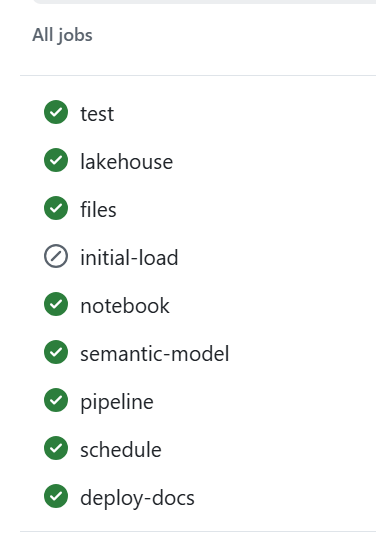
CI/CD
assuming you got pass the app registration in Azure, GitHub Actions handles CI — on every push and pull request to production:
Q&A
Why deploy to Fabric from local instead of from GitHub Actions?
CI (testing, docs, DAG) runs in GitHub Actions — no cloud credentials needed, just Azurite. But Fabric deployment requires authenticating to the Fabric REST API, which means a service principal.
This is just my personal experience working in different companies. As a business user, there is almost zero chance IT will give permission to register an app. And even if a miracle happens, you still need to convince a Fabric admin. This is not a technical limitation, it is human behaviour.
Instead, deploy_to_fabric.py uses AzureCliCredential — you run az login, your browser opens, you sign in, done. The script picks up your existing identity. You already have the Fabric permissions. No secrets to store, no service principal to manage.
The tradeoff is that deployment requires a human at a keyboard. For a single-person or small-team project, that’s fine — you deploy when you’re ready, not on every push.
Why not just use Datawarehouse/Spark/Dataflow etc? It’s built into Fabric.
All those tools in Fabric are awesome, but it is a lakehouse and the whole point of a lakehouse is to use whatever you want as long as it produces Parquet and Delta/Iceberg metadata, ideally sorted with a decent row group size from 2M to 16M.
Why DuckLake instead of Delta or Iceberg?
DuckDB Delta write support is still experimental.
OneLake Catalog supports Iceberg read only.
If we had Iceberg write, that would be my first preference.
Why is the semantic model AI-generated?
Because it is cool 🙂 and it is unbelievable that AI managed to write it out of thin air and did cool stuff like generating descriptions so Power BI AI behaves better.
What happens if the pipeline fails mid-run?
The DuckLake metadata DB lives on OneLake (Files section). If the run fails mid-way:
Downloaded source files are already archived on OneLake (no re-download needed)
DuckLake metadata reflects whatever was committed before the failure
Next run picks up where it left off using the archive log
The pipeline has a 1-hour timeout. If it hangs, Fabric kills it and the next hourly run starts fresh.
Can this scale?
Python notebooks scale to half a TB of RAM. If you need more, then you are reading the wrong blog 🙂
Where is TMDL?
I could not deploy using TMDL, even after feeding AI all kurt buhler articles 🙂 bim seems to be better undersood at least for now.
Why use SQLite instead of DuckDB to store the metadata DB?
The Files section of OneLake is not a real POSIX filesystem. It is not like your local disk — it basically uses FUSE. All Python engines think it is a real filesystem, but I noticed SQLite works better than DuckDB for this. It flushes data more reliably.
What is skill
In this case, a skill is simply a way to capture what was learned during the work so the AI can reuse that knowledge later.
I wrote the skill after finishing the task, then asked the AI to summarize the key learnings and steps. The idea is that next time the AI runs a similar task, it will be better informed and produce better results.
This is not specific to Claude. The same approach works with Copilot as well. The format is different, but the idea is exactly the same: capture the knowledge once so the AI can reuse it later.
Parting Thoughts
Everything you have heard about AI is pretty much true. The only wrong part was the timing. We all knew about AI’s potential, but in my experience something changed around December 2025. Suddenly AI became genuinely useful — less hallucination, and it just works well enough. Especially when you can test the outcome. And that is the key insight: data engineering is, in a sense, just software engineering. AI writes the code, AI does everything. Your job as a user is to make sure the tests are comprehensive. Contrary to what you hear from professional software engineers, you don’t need to care about the general case. If it is solid enough and it works for your use case, that is all that matters. Nothing more.
There is another aspect worth mentioning. There is a real market for business users who are not programmers. There is enormous value in using your laptop as your main dev and test environment. You open VSCode, you talk to your favorite AI agent, you run dbt run, and you see results in seconds. That feedback loop changes everything. Data platforms like Fabric become a hosting environment with security boundaries, governance, and all that.
and if you are still reading, dbt test are just awesome !!!